
13
Getting results and how to measure them
What you will learn in this chapter
- Why monitoring and benchmarking matter
- The importance of getting results by building brands
- How to identify brand essence and brand equity
- Why customer satisfaction metrics are pivotal to improving your organisation’s strategy and execution
- Tools and techniques for measuring performance
- Why consistent monthly reports work better
- Feedback formats for continuing learning and success
I was fortunate enough to spend the first seventeen years of my career at two marketing powerhouses, with an enviable record of sustained commercial success: P&G and Mars. Both have brand-building at the centre of business development; both are highly advanced in understanding their customers; both are dedicated to measuring performance, and make intelligent use of performance data available. It was only when I left these companies that I realised that they are the exceptions. In many companies, marketing is little more than logos and communications. When it comes to monitoring and measuring performance, too many companies measure too little, or too much, or the wrong things.
In earlier sections, I covered managing yourself, and managing others. In later sections I will cover aspects of change management, such as handling stakeholders, especially customers, and innovation. Here, the focus is the commercial core of developing a business: building brands, delivering services, measuring to check you’ve achieved what you intended and learning from the results.
Why monitoring and benchmarking matter
You’ve got the strategy, the plan, the budget and the team. But six months into your plan, you are 20 per cent down on income and profit against your budget. Morale is down. Hours worked are up. Your boss and your board are asking big questions. If you have ever been in a situation like this, then you’ll know the feeling. The problem is, by that time, it’s almost always too late.
In well-managed organisations there’s a real ‘hunger’ for knowing results and monitoring the trends. At P&G, the highlight of the day for many brand managers was when the daily shipment report came in, so they could check where their brand was compared with other brands and the target. The reverse is also true. Organisations in trouble often don’t measure, measure the wrong things or too many things. Many of the recent crises in the UK’s NHS hospitals were caused by measuring the number of patients processed rather than employee engagement and quality of patient care. When employee engagement was measured and correlated with mortality rates, patient care and cost targets, all headed in a positive direction.1
As well as measuring your own results, it helps to ‘benchmark’ – compare with others. With the internet, this is much simpler. If you’re in sales and marketing, you can benchmark your open rates, click-through rates and conversion and closing rates. Just be sure you are genuinely comparing like with like.
In this chapter, I am going to share ways of measuring that I have seen work over the years. I am also going to encourage you to feed your measurements back into your strategy, understand and probe them, and encourage ongoing improvement. You will get better results from doing this. You will become curious. You will help set yourself and your team on a path of continual discovery. In short, you’ll be a much more successful manager.
Getting results by building brands
The most high-performing companies understand that everything is connected: the brand is a reflection of how you do business collectively, not just a task on a checklist for the marketing department. Companies that build leading brands reap many rewards, including: more loyal customers, more market share, category-leading innovation, a positional priority in stores and media, higher prices, better-quality job applicants, lower borrowing costs and higher shareholder value. Interbrand, which has pioneered the valuation brands in the market place, estimates that the top 100 global brands are worth US$1,384,644,000,000.2
When building a brand, the first thing to define is its essence, or equity: the brand’s personality and values, the relationship the brand has with the target consumer, and the benefit it delivers. It is important to understand your target consumer(s) (and here, I mean consumer as customer). For example, if you run a convenience store and your target consumer is an urban, savvy, 20-something single person, then stocking your store full of baby-care items is inappropriate. Finally, always be aware of the competitive context. How is your brand really different from and better than the main alternatives from your customer’s point of view?
There are many frameworks for articulating this. In my view, the simpler ones are the best. The most common is the pyramid, which describes functional attributes at the bottom, and the emotional benefits and brand personality at the top (see Figure 13.1).
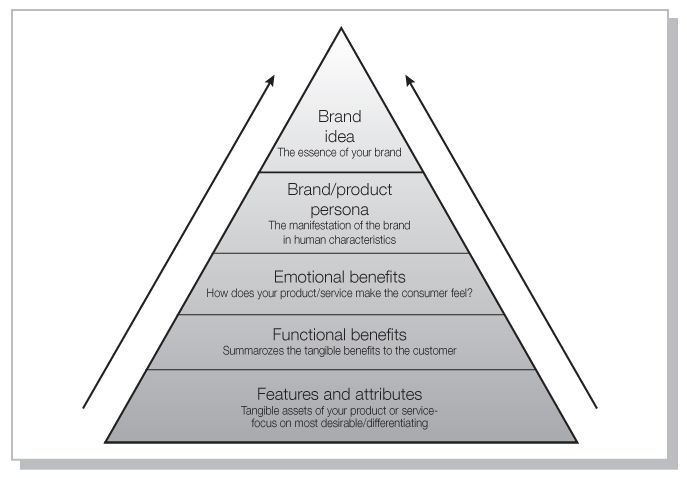
I strongly recommend that you turn this into a brand strategy – a simple set of words and/or pictures. It will force you to simplify and get to the heart of your brand. Try addressing the key dimensions in your brand strategy as follows:
- Benefit What need are you satisfying for the consumer or customer?
- Emotional benefit What emotional need are you fulfilling?
- Reason why Functional attribute that supports this benefit (proven by research).
- Brand personality Values of brand that also reflect values of user.
If you are dealing in highly emotional categories such as beauty care, pictures can often express these values better than words. It’s important that you develop a consistent visual style and look for your brand. A clearly articulated brand essence gives everyone a guideline for the brand strategy and execution, including distribution, media, innovation and product development. In well-run companies, brand strategy or pyramid is based on consumer research and mapping in order to identify the target market and values. The emotional benefits are well understood and functional benefits are tested against the competition to ensure they are superior. And the innovation and routes to market and communications are kept in line with the brand personality. This approach is rigorous, and makes it easier to replicate globally. Although these brands’ pyramids and essences are updated, they are rarely changed. Consistency is a key attribute. The brand pyramid transcends particular campaigns. It is the DNA of the brand.
It is best to make the choices on the basis of market analysis and data. If the brand’s features do not have this foundation, recognise that they are aspirational and be prepared to go through these steps. For example, if you are a skincare brand aimed at outperforming prestige brands for a fraction of the cost but your packaging looks cheap and nasty then your brand will not deliver on the promise and will quickly be in trouble.
Some pitfalls to watch out for in setting brand essences and pyramids:
- Too complicated
- Too generic
- Too ambiguous
- Not relevant
- Not proven
- Not distinctive versus competition.
Brand equity: shaping the customer experience consistently
Once you have defined your brand essence, it is time to shape what your brand stands for in the hearts and minds of the target consumers. This is your brand equity. To shape this, you need to be aware of what you want your customers to feel and think about your product or service, and what you want them to experience. Brand equity should be specific, positive and create thoughts and feelings. It helps to use an activity system, as advocated by The Monitor Company. This looks at the different ways the consumer experiences your brands. There are generally three ways:
- The shopping experience How the consumer experiences your channels to market (stores, sales visits, check-ins, etc.).
- The product experience How the consumer experiences your product or service when they are using it.
- The bonding experience How your consumer experiences how you communicate with them (advertisements, customer service and so on).
Different aspects of your brand experience should be mutually reinforcing. Apple does a brilliant job of this (see also Chapter 11). The stores, the communicating channels and packaging and the products themselves are impeccably designed, user-centric, clean and consistent.
case study
The make-up of the make-up artist
Max Factor was the original make-up artist in Hollywood. When we repositioned the brand as ‘the make-up of make-up artists’, we translated the in-store look to focus on make-up artist tips, and made the counters look like a make-up artist’s box. We linked up with Hollywood make-up artists and used them for testimonials, advertising and in store events. We used product names like ‘Lasting performance foundation’, and featured the make-up in situ in demanding movie situations. The brand doubled sales in Europe and attracted a younger target audience without alienating its core older user.
By ensuring the shopping, product and bonding experiences are ‘on equity’ you strengthen the likelihood that the consumer will remain loyal. It helps if you prioritise the customer experience that is most likely to shape his or her impressions of you. For example, Pampers are used by parents several times a day, seven days a week. If the product isn’t working, the parent knows about it. You could have the world’s best shopping experience; it still wouldn’t help. Conversely, in make-up, over 90 per cent of purchase decisions are made in-store. Companies like Estée Lauder devote meticulous effort and attention and measurement to the in-store shopping experience as a result. Finally, with ‘cool’ brands like b headphones, they may not be the best, but the bonding experience of knowing these are the brainchild of Dr Dre, the rapper, makes them a must-have for many.
You can and should measure your brand equity annually, benchmarked against your competition. If it increases, it is very likely your sales and profits have increased as well. You can measure your brand equity many different ways. The most widely used is an annual tracking study, which measures awareness, advertising awareness, consideration, trial, purchase, repeat purchase. It also measures specific attributes you want your brand to stand for and the degree to which you do compared with your competition.
exercise
Try to develop an ‘activity system’ for your brand. Do your product, bonding and shopping experiences reinforce each other or contradict each other? Think about where your purchase decisions are made. This will help you to identify the key focus area for your brand and prioritise getting that right.
Value propositions and messaging
An insight is something that will change the way people think about your brand, and ultimately has the power to change their behaviour. Effective ads have some sort of insight which convinces us to behave differently and choose the brand being advertised. You can think about insights in any market. For example, furniture giant IKEA urged UK consumers to ‘chuck out their chintz’ because they needed to get people to break with their traditional interior decorating habits in order to switch them to IKEA’s modern, functional look.
If you have your brand pyramid and your insight that you will use to change behaviour, you are ready to form your value proposition. The best value propositions are based on an insight that will help consumers understand and appreciate the value of your brand. Often you will work with an agency on this. The main thing is to be convincing, distinctive and credible. When we launched Always (at Procter & Gamble), we knew that women didn’t trust a pad so thin, so we needed to confront that scepticism directly (see ‘More strategic stories’, in Chapter 10).
exercise
Think of a target group that is not buying your brand. Why? What are they thinking and feeling? What would you need to overcome if you were to change what they think and feel? What insight would do that? Once you understand these barriers you can build an insightful campaign which will convince him or her to try it. Insights are vital to effective campaigns.
It is always best to test your propositions and insights before spending a lot of money to develop an ad campaign. This has become easier in the digital age, as you can use online research. When you test your proposition, you are looking for the purchase intent – the likelihood that people will try; and relevance – whether it matters to them and helps them to deal with an issue; and the credibility – whether they believe your promise. Measure these on a five-point scale. You will want to score higher than the competition or higher than your current proposition, which you can use as a control.
Integrating your messages
There are many different media: television, print and radio advertising, digital banner, pay-per-click, email marketing, social media, event marketing, sampling, in-store advertising, sponsorship and many more. You should choose media depending on your target audience, their media habits, and what you want to achieve.
Selection is usually the job of the ad agency. The best media plans have an integrated approach, where similar messaging is delivered across many formats consistently, exploiting the advantages of each particular platform. Make sure your messages join up. The media weight of these campaigns is measured in something called GRP, or gross rating point. This is about the reach and frequency. A GRP = reach × frequency. What percentage of your target audience are you reaching how many times? You can compare this against your competition in a measurement known as SOV or Share of Voice.
Typically, digital media will be cheaper. They can also be up to four times more effective than other forms of media. However, they are still not the majority of spend, because there is more glory, and profitability (for the agencies!), in TV commercials. If you are just starting out, it pays to use lower-cost means of communicating, provided you can reach your target audience. Always measure the effectiveness of campaigns. This can be more precise with the web and data analytics.
If you are launching a new product as an extension to your brand, then linking up the brand essence and equity of the new product with that of the ‘mother brand’ is very important. This is because doing so will stimulate sales of the ‘mother brand’. This is known as the ‘halo effect’, and it can be very important to building a successful ‘power brand’ that spans several categories. For example, when we launched Olay body wash, Olay skincare sales increased by several percentage points. But you will only achieve this if your equity and messaging is consistent.
exercise
Measure your campaign effectiveness: map your campaigns across different media. Are the messages, tone, look and feel integrated? Or are they different? Plan your media so things join up in terms of message, tone, visual and verbal style.
Business-to-Business campaigns
B2B campaigns are much more likely to rely on content marketing than Business-to-Consumer. The B2B role is about creating content, capturing leads, and developing compelling stories for the sales force. Much of this is likely to be measurable and benchmarked and should be. It’s very important that you have a consistent lead classification and nurturing process, as well as a clearly defined handover point from marketing to sales. Otherwise, many leads get lost in the middle. Make sure you have tracking systems that enable you to figure out how many leads you are getting from content marketing from your website, and from your emails, and what is happening to these leads. Measure your open and click-through rates on emails and websites. And always, always, benchmark. Test different emails, subject lines and content formats. Which works better? Why?
Campaigns can always be measured and should be. How much did the campaign cost? How many click-throughs did it generate? You may also want to set KPIs around how many leads you need to generate, given the average closing rate of the leads, in order to hit your sales targets.
The sales force
The sales force is vital in Business-to-Business, because they are the route to market, unlike in business-to-consumer, where you can influence purchase behaviour more directly. Sales may be categorised as ‘hunters’ – new business specialists, whose job it is to get new customers; and ‘farmers’, or account executives, whose job it is to up-sell and cross-sell customers and penetrate further into an account. Both are very important.
These five key steps are a useful outline of sales excellence:
- Plan and prepare for customer visits.
- Conduct a business review to gain and retain the client interest.
- Test intention – does the customer recognise that you have appreciated his or her needs?
- Propose and provide solutions – does the customer agree that the solution provided meets his or her needs? Is the price right?
- Agree service requirements.
Nowadays there is more ‘solution selling’, and less product-based selling, because solutions are increasingly specific and complex. They may require a package of certain products and service that is unique to the customer. However, selling remains basically a numbers game. Good sales people are numeric, inherently targets-oriented and like to be measured. It is one of the few functions where KPIs are very easy to measure.
When you distribute accounts you should ideally use customer insight and analytics in order to target those accounts most likely to convert, lapse or up-trade.
Six tips for handling the sales force:
- Make it easy to prepare for visits and ensure you give good access to account history and reasons to buy.
- Make sure all metrics are clear and tracked: number of leads, appointments and visits per week; lead to close ratios, etc.
- Reward and rank frequently – sales people enjoy healthy competition.
- Feed the producers – it’s easier to feed the top performers than to move the bottom third up.
- Avoid sales versus marketing blame by having one director responsible for both.
- Customer service is a valuable source of leads. Make sure you partner sales with customer service.
Customer satisfaction – and how to measure it
Measuring customer satisfaction is something that all companies do. When it’s done well, it can be a great source of customer insight. You can figure out which customers are advocates or fans, and which customers are about to lapse, and install efforts to retain them. You can look at the impact of different products, sales people, or geographies on customer service. You can even link messaging that customers have received to their response, or what interventions have impacted satisfaction either positively or negatively. But in order to get all this information, customer service systems must be integrated with the rest of your systems so you can look at the data end to end. This is where it becomes really valuable and important to have a single view of the customer.
There are many different ways to measure customer satisfaction. Too often it is on a five-point scale, and comes in between 4 and 4.5 – and has stayed at this level for years. This offers little insight. Even worse is when companies ask, would you recommend us? And give responders two choices: yes or no. Typically 93–95 per cent say yes, but this rosy picture could be misleading.
A much better measure is the Net Promoter Score (NPS). This is a customer focus measure developed by Fred Reichheld of Bain and Company, based on research that investigated the correlation between customer survey responses and actual customer behaviour. They determined that the top-ranking question (on a ten-point scale) was far and away the most effective across industries:
- How likely is it that you would recommend [company X] to a friend or colleague?
They determined that customers can be either Promoters or Detractors. You can calculate the percentage of customers who respond with nine or ten (these are ‘Promoters’) and the percentage who respond between zero and six (‘Detractors’). Subtract the percentage of detractors from the percentage of promoters to arrive at your Net Promoter Score. Compare these scores from different regions, branches, sales reps and customer segments, and how you compare against the competition. This often reveals causes of differences as well as best practices.
Companies that use NPS find that the rigorous implementation of a simple customer feedback system has had a clear impact on their business. To be effective NPS must become a prominent metric known throughout the organisation, and also linked to KPIs for employees.
Other tools and techniques for performance measurement
The customer experience should always be measured, and should find its place in a range of organisational measurement approaches. There are many other tools. Some get highly technical and we won’t cover those here. The main point is to put the effort into deciding what to measure rather than which framework you use.
Balanced scorecard
This was created in the 1990s by Robert Kaplan and David Norton (see Chapter 22). Its origins were to wean people away from over-reliance on financial measures, as this tended to produce short-term thinking and also didn’t provide any insights as to why the results were as they were. The balanced scorecard looks at four key areas:
- How do we look to our customers?
- How do we look to our owners?
- What do we need to excel at?
- How do we innovate and learn?
All of these are linked. The idea is to set concrete objectives, measures and targets for each area, and to then reflect these in your overall initiative plans.
Table 13.1 An example of a balanced scorecard
The priority should be to focus on what matters. Take call centres for instance: if the main measure is the number of calls per hour, then you will have customer service reps not resolving issues and keeping calls short so they can be ‘productive’. If the main measure is to resolve the customer complaint in a single call, they will have a much more positive impact on customer satisfaction.
Companies often add perspectives to the scorecard, such as community or brand. But if you have too many they will become meaningless or misleading. One company I worked for had an entire page in the central management accounts devoted to KPIs – there must have been sixty of them. No one in the business units even looked at them, but because they were required reporting, everyone just stuck numbers in to comply. The result was meaningless data. The company ended up with no common performance measures across the units, and much unnecessary conflict and mistrust among senior management.
exercise
Try creating a balanced scorecard from your strategy. Debate and discuss what really will matter to your organisation. Try to come up with no more than one objective and three primary measures and targets for each area. Any more and people will get lost and it will become too complicated.
KPIs
KPIs are the Key Performance Indicators that will enable to you to track and hit your targets. For example, if your target is to have 500,000 customers overall, one key performance measure might be around customer retention.
For each measure, you should ask a series of simple questions:
- What is the measure?
- Why are we measuring this?
- Who measures this?
- How often is it measured?
- Where does the data come from to measure it?
- Who acts on the data?
- What do they do?
Notice how often the simple: who, what, when, where and why and how are used in setting these measures. If you cannot answer these questions they may be the wrong targets.3
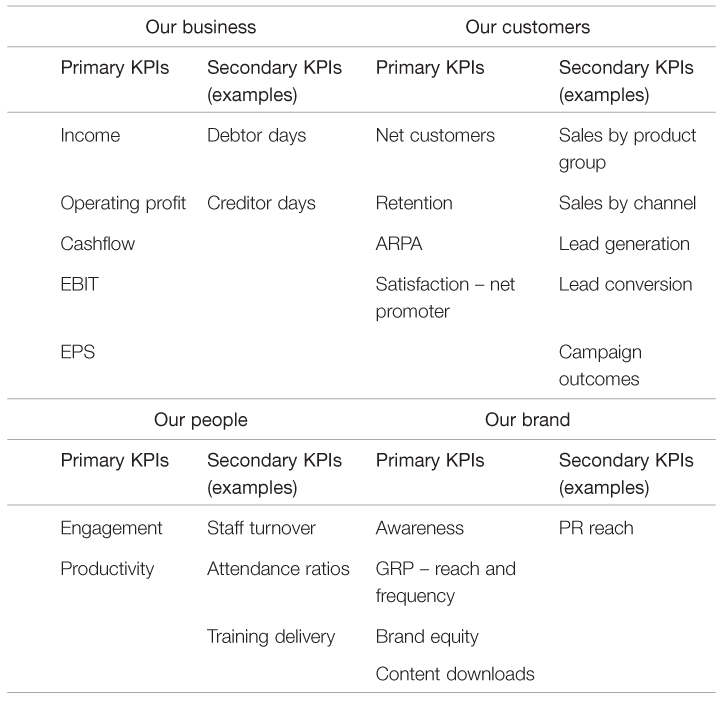
Drilling down and linking primary KPIs and secondary KPIs and deciding which initiatives are critical to achieve your objectives and KPIs is an essential part of measuring: ‘In order to achieve this we need to achieve that.’ It’s really important that everyone in your team, and ultimately organisation, understands how their work is linked together to deliver the KPIs.
Example
The sales department needs to achieve 100 sales per month of a product or service. In order to achieve this, they need 300 appointments, since one in three visits ‘converts’ to a sale. In order to achieve the 300 appointments, they need the marketing department to generate 3,000 qualified leads per month, because one in ten converts to an appointment.
In order to generate the leads, the marketing department looks to three sources; email marketing, Google ad words and PR. Each of these has a different conversion rate and is done by a different team. So each of the teams looks at how many emails they need to send, how many Google ad words they need to run and how many PR articles should be generated to hit the target. Secondary KPIs are set accordingly so everyone is working towards achieving the same objectives, and they nest within each other in the same way as a Russian stacking doll.
In reality, of course, customers may do more than one of these activities, so it can be difficult to measure interactions between these things without sophisticated tools, which I will discuss later (in Chapter 19). But it’s a good way of getting you started in thinking about how your work links into the overall KPIs of your organisation.
Suppose you have now set your KPI for customer retention and customer satisfaction. What do you do now? This is where Critical Success Factors (CSFs) come in. In order for you to achieve your KPI, you will need to deliver certain things that will help to retain and satisfy your customers. It could be they will need certain levels of performance from your product or service, or a swift resolution of a complaint or a competitive price point. If you analyse the relative proportion of those people who have left because of dissatisfaction in each of these areas you will be able to prioritise which requires attention. These are your CSFs. Often, they will not be your or your team’s job, but the job of another department. This is why it is so important to work together.
- KPI = number of new customers. For example, 1,000 per year, or 20 per week. (Measurable, quantifiable.)
- CSF = a website where customers can buy online and could be a critical success factor enabling you to achieve your number of new customers. It is a key enabler of your strategy.
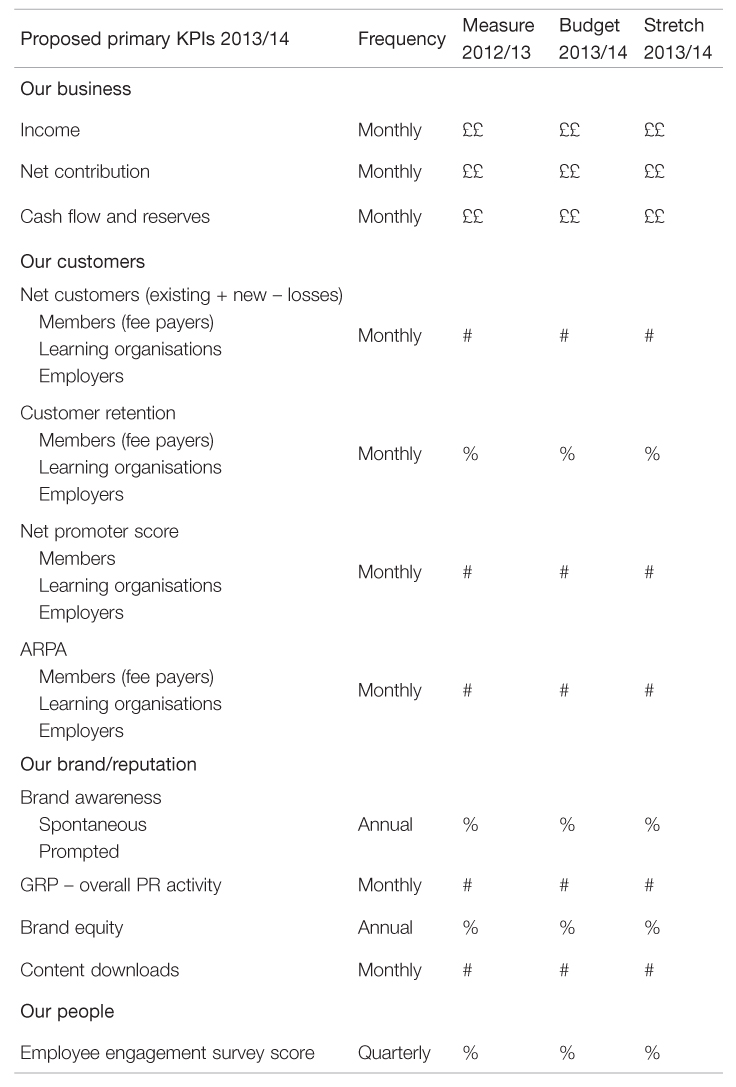
- It’s important to agree your reported KPIs – it is also worth investing time in narrowing this down to the top 10.
exercise
Look at you and your team’s objectives and KPIs. Do you understand how they link to the overall KPIs of your organisation? Will what you are doing help the organisation to achieve those objectives, targets, and KPIs? If not, why not? Have a chat with your boss – you may not have the right KPIs.
Table 13.2 An example of a KPI report
Monthly reports and briefings: consistency of format is best
Now that you have your scorecard and KPIs, talk about them! Initiate monthly reports from your entire department and for your staff on how you are doing. Do this routinely, and use the same format. In one company I worked for each of the regional managing directors had their own monthly report format. Often the MDs would try to justify these differences on the basis of cultural variations.
Cultural variations may explain why an outcome is different, but they should not be used to justify different metrics. In this case the behaviour was political: each regional managing director was trying to window-dress their results. This is the worst kind of reporting, as it hides problems that need fixing.
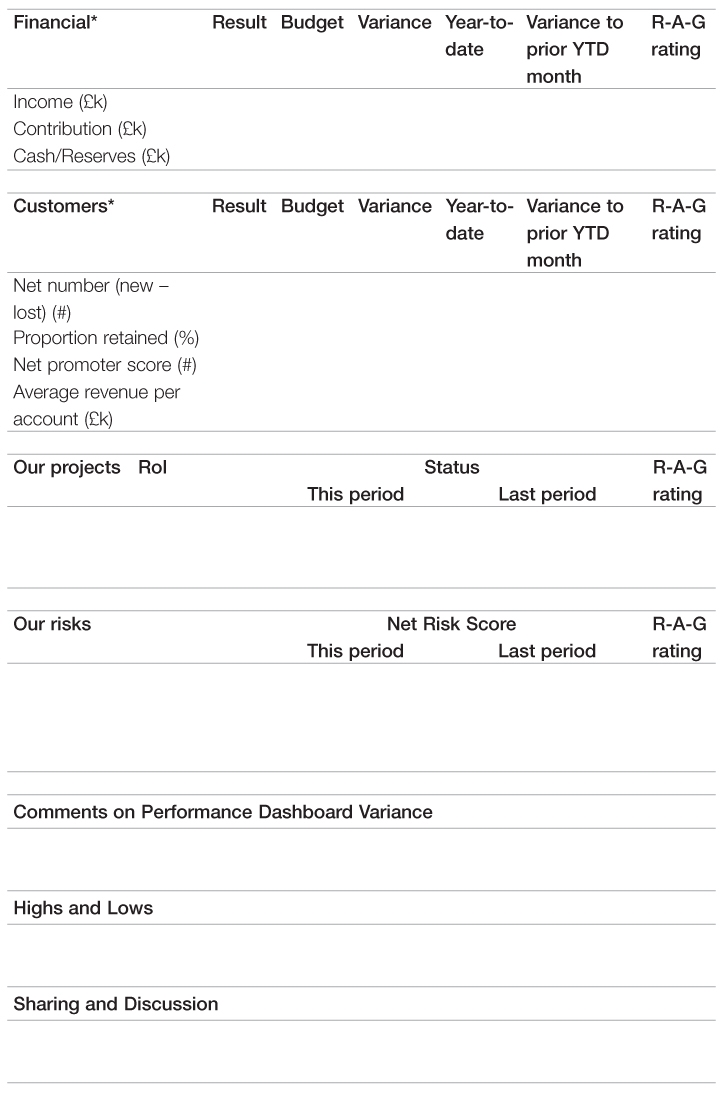
If you have a standard format, you can quickly benchmark and see where you are good and where you might need to improve. Table 13.3 shows one example of a standard format that I like.
Briefings for all employees are a very good idea. If you expect employees to deliver the strategy, inform them on a monthly basis how your organisation is doing. The best way to do this is to have a simple version of the monthly report shared at each briefing, and encourage different people to share what they are doing. I encourage you to be very open about financial and performance information. Why keep it secret? If you expect your employees to achieve things, they need to know what, why and how. Don’t hide it away in a desk drawer or a top management meeting. It may also be that your employees have some great ideas on how to improve performance.
Don’t be afraid to escalate bad news. One CEO told me a story of how, in his first managing director position, he used to report to his board on all the bad things that were happening. One day his Chairman took him aside and told him not to do that, as it made a bad impression, but he carried on. So he got fired. He went on to found Berkeley Homes – a very successful FTSE 250 company.
Table 13.3 Performance dashboard
The annual ‘business review’
It bears repeating that all measurement tools are a means to an end: to challenge and improve your strategy, execution and results. It helps to complete a thorough analysis of the business and the KPIs once a year. This is called a business review: it looks at the overall objective and targets, which were met and which not, and then drills down into each of the measures and initiatives to look at why that is.
Begin with detailed findings for each area. For example, you might look at pricing, product performance, customer satisfaction, campaign performance or communication effectiveness, employee engagement and manufacturing efficiency. Do so systematically, using the available data in each case. For each area you explore, identify specific actions for improvement. A picture will emerge, which can be translated into overall conclusions: Which were the most important areas that explained the over- or under-performance? Which actions will make the biggest difference?
These methods might not work for disruptive innovations that are about inventing totally new business models, but they are very effective for most organisations that need to undergo change and improvement. Organisations are like managers – the more aware they are of their strengths and shortcomings, and the more committed they are to learning to correct them, the better and more successful they will be!
Top tips, pitfalls and takeaways
Top tips
- Understand your brand’s ‘essence’ or equity, and always make sure the product lives up to the promise.
- Measure your open and click-through rates on promotional emails and websites. And always benchmark.
- Use a ‘Net Promoter Score’ (NPS) to determine the likelihood that customers would recommend your product or service.
- Reports for different departments, such as monthly performance reports, should always be to the same format, testing the same things.
- Use Key Performance Indicators to support Critical Success Factors – those matters absolutely essential for achieving your goals.
Top pitfalls
- A brand pyramid that is too complicated, too generic, too ambiguous, not relevant, not proven, or not distinctive.
- Setting too many KPIs, such that no one is able properly to understand and use them.
- Relying too heavily on data without checking its accuracy and validity.
Top takeaways
- Marketing is not just about logos and communication; the heart of the discipline concerns understanding customers and customer behaviour.
- You can measure your brand equity, benchmarked against competitors, in many different ways.
- Measurement is an essential part of ensuring you are on target to reach strategic goals.
- Measurement of inappropriate targets can create perverse incentives and lead to serious operational problems: for example, tracking activity but not checking quality of service.
- Any measurement is no more than a means to an end, so indicators should be relevant and proportionate.
- A balanced scorecard can help prevent too much reliance on financial data.
1 Michael West, 2012.
2 Jez Frampton, Interbrand CEO.
3 Adapted from Balanced Scorecard, Bourne, Mike and Bourne, Pippa, Chartered Management Institute Instant Manager Series, Hodder, 2007, p. 64.