
Querying hardware resources and services on local and remote computers
Using the Server Explorer to easily add code that works with computer resources to your applications
The Server Explorer is one of the few tool windows in Visual Studio that is not specific to a solution or project. It allows you to explore and query hardware resources and services on local or remote computers. You can perform various tasks and activities with these resources, including adding them to your applications.
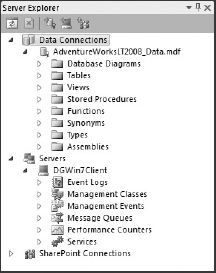
The Server Explorer, shown in Figure 9-1, has three types of resources to which it can connect. The first, under the Servers node, enables you to access hardware resources and services on a local or remote computer. This functionality is explored in detail in this chapter. The second type of resources is under the Data Connections node and allows you to work with all aspects of data connections, including the ability to create databases, add and modify tables, build relationships, and even execute queries. Chapter 26 covers the Data Connections functionality in detail. Finally, you can add a connection to a SharePoint server and browse SharePoint-specific resources such as Content Types, Lists, Libraries, and Workflows. SharePoint connections are covered in more detail in Chapter 24.
The Servers node would be better named Computers, because it can be used to attach to and interrogate any computer to which you have access, regardless of whether it is a server or a desktop workstation. Each computer is listed as a separate node under the Servers node. Below each computer node is a list of the hardware, services, and other components that belong to that computer. Each of these contains a number of activities or tasks that can be performed. Several software vendors have components that plug into and extend the functionality provided by the Server Explorer.
To access Server Explorer, select Server Explorer on the View menu. By default, the local computer appears in the Servers list. To add another computer, right-click the Servers node and select Add Server from the context menu.
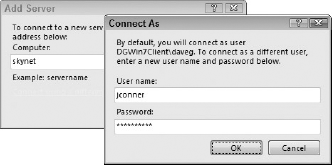
Entering a computer name or IP address initiates an attempt to connect to the machine using your credentials. If you do not have sufficient privileges, you can elect to connect using a different username by clicking the appropriate link. The link appears to be disabled, but clicking it does bring up a dialog, shown in Figure 9-2, in which you can provide an alternative username and password.
Note
You will need Administrator privileges on any server that you want to access through the Server Explorer.
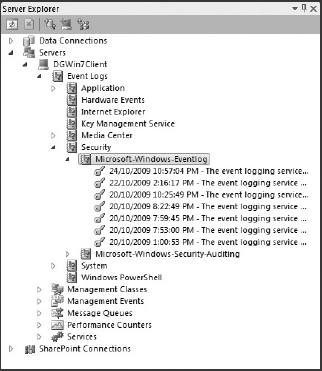
The Event Logs node gives you access to the machine event logs. You can launch the Event Viewer from the right-click context menu. Alternatively, as shown in Figure 9-3, you can drill into the list of event logs to view the events for a particular application. Clicking any of the events displays information about the event in the Properties window.
Although the Server Explorer is useful for interrogating a machine while writing your code, the true power comes with the component creation you get when you drag a resource node onto a Windows Form. For example, if you drag the Application node onto a Windows Form, you get an instance of the System.Diagnostics.EventLog class added to the nonvisual area of the designer. You can then write an entry to this event log using the following code:
- C#
this.eventLog1.Source = "My Server Explorer App";
this.eventLog1.WriteEntry("Something happened",
                          System.Diagnostics.EventLogEntryType.Information);
- VB
Me.EventLog1.Source = "My Server Explorer App"
Me.EventLog1.WriteEntry("Something happened",
                        System.Diagnostics.EventLogEntryType.Information)
Note
Because the preceding code creates a new Source in the Application Event Log, it requires administrative rights to execute. If you are running Windows Vista or Windows 7 with User Account Control enabled, you should create an application manifest. This is discussed in Chapter 6.
After you run this code, you can view the results directly in the Server Explorer. Click the Refresh button on the Server Explorer toolbar to ensure that the new Event Source is displayed under the Application Event Log node.
For Visual Basic programmers, an alternative to adding an EventLog class to your code is to use the built-in logging provided by the My namespace. For example, you can modify the previous code snippet to write a log entry using the My.Application.Log.WriteEntry method:
VB
My.Application.Log.WriteEntry("Button Clicked", TraceEventType.Information)You can also write exception information using the My.Application.Log.WriteException method, which accepts an exception and two optional parameters that provide additional information.
Using the My namespace to write logging information has a number of additional benefits. In the following configuration file, an EventLogTraceListener is specified to route log information to the event log. However, you can specify other trace listeners — for example, the FileLogTraceListener, which writes information to a log file by adding it to the SharedListeners and Listeners collections:
<?xml version="1.0" encoding="utf-8" ?>
<configuration>
    <system.diagnostics>
        <sources>
            <source name="DefaultSource" switchName="DefaultSwitch">
                <listeners>
                    <add name="EventLog"/>
                </listeners>
             </source>
        </sources>
        <switches>
            <add name="DefaultSwitch" value="Information"/>
        </switches>
<sharedListeners>
<add name="EventLog"
type="System.Diagnostics.EventLogTraceListener"
initializeData="ApplicationEventLog"/>
</sharedListeners>
</system.diagnostics>
</configuration>This configuration also specifies a switch called DefaultSwitch. This switch is associated with the trace information source via the switchName attribute and defines the minimum event type that will be sent to the listed listeners. For example, if the value of this switch were Critical, events with the type Information would not be written to the event log. The possible values of this switch are shown in Table 9-1.
Table 9.1. Values for DefaultSwitch
DEFAULTSWITCH | EVENT TYPES WRITTEN TO LOG |
|---|---|
Off | No Events |
Critical | Critical Events |
Error | Critical and Error Events |
Warning | Critical, Error, and Warning Events |
Information | Critical, Error, Warning, and Information events |
Verbose | Critical, Error, Warning, Information, and Verbose events |
ActivityTracing | Start, Stop, Suspend, Resume, and Transfer events |
All | All Events |
Note that there are overloads for both WriteEntry and WriteException that do not require an event type to be specified. In this case the event types will default to Information and Error, respectively.
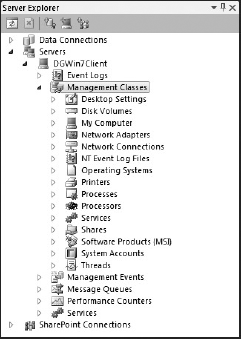
Figure 9-4 shows the full list of management classes available via the Server Explorer. Each node exposes a set of functionalities specific to that device or application. For example, right-clicking the Printers node enables you to add a new printer connection, whereas right-clicking the named node under My Computer enables you to add the computer to a domain or workgroup. The one thing common to all these nodes is that they provide a strongly typed wrapper around the Windows Management Instrumentation (WMI) infrastructure. In most cases, it is simply a matter of dragging the node representing the information in which you're interested across to the form. From your code you can then access and manipulate that information.
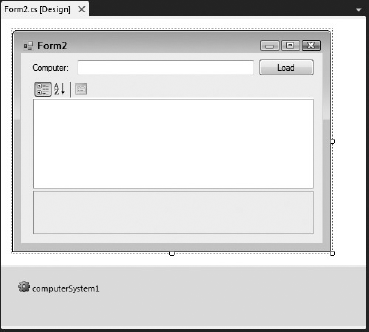
To give you an idea of how these wrappers can be used, this section walks through how you can use the management classes to retrieve information about a computer. Under the My Computer node, you will see a node with the name of the local computer. Selecting this node and dragging it onto the form gives you a ComputerSystem component in the nonvisual area of the form. Also add a Label control, a TextBox control, a Button, and a PropertyGrid control from the All Windows Forms tab on the Toolbox and arrange them on the Form as shown in Figure 9-5.
If you look in the Solution Explorer, you will see that it has also added a custom component called root.CIMV2.Win32_ComputerSystem (or similar depending on the computer configuration). This custom component is generated by the Management Strongly Typed Class Generator (Mgmtclassgen.exe) and includes the ComputerSystem and other classes, which will enable you to expose WMI information.
If you click the computerSystem1 object on the form, you can see the information about that computer in the Properties window. In this application, however, you're not that interested in that particular computer; that computer was selected as a template to create the ComputerSystem class. The ComputerSystem1 object can be deleted, but before deleting it, take note of the Path property of the object. The Path is used, combined with the computer name entered in the form in Figure 9-5, to load the information about that computer. You can see this in the following code that is added to the button click event handler for the Load button:
- C#
const string compPath = "\\{0}\root\CIMV2:Win32_ComputerSystem.Name="{0}"";

if (!string.IsNullOrEmpty(this.textBox1.Text))
{
    string computerName = this.textBox1.Text;
    string pathString = string.Format(compPath, computerName);
    var path = new System.Management.ManagementPath(pathString);
    ROOT.CIMV2.ComputerSystem cs = new ROOT.CIMV2.ComputerSystem(path);
    this.propertyGrid1.SelectedObject = cs;
}
- VB
Const compPath As String = "\{0}
ootCIMV2:Win32_ComputerSystem.Name=""{0}"""

If Not Me.TextBox1.Text = "" Then
    Dim computerName As String = Me.TextBox1.Text
    Dim pathString As String = String.Format(compPath, computerName)
    Dim path As New System.Management.ManagementPath(pathString)
    Dim cs As New ROOT.CIMV2.ComputerSystem(path)

    Me.PropertyGrid1.SelectedObject = cs
End If
In this example, the Path property, which was obtained earlier from the computerSystem1 object, has been used in a string constant with the string replacement token {0} where the computer name should go. When the button is clicked, the computer name entered into the textbox is combined with this path using String.Format to generate the full WMI path. The path is then used to instantiate a new ComputerAccount object, which is in turn passed to the PropertyGrid control. The result of this at run time is shown in Figure 9-6.
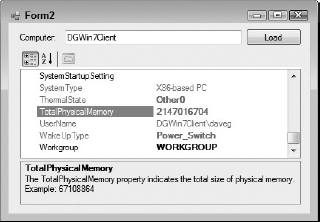
Though most properties are read-only, for those fields that are editable, changes made in this PropertyGrid are immediately committed to the computer. This behavior can be altered by changing the AutoCommit property on the ComputerSystem class.
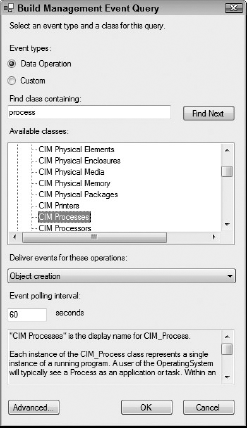
In the previous section you learned how you can drag a management class from the Server Explorer onto the form and then work with the generated classes. The other way to work with the WMI interface is through the Management Events node. A management event enables you to monitor any WMI data type and have an event raised if an object of that type is created, modified, or deleted. By default, this node is empty, but you can create your own by right-clicking the Management Events node and selecting Add Event Query, which invokes the dialog shown in Figure 9-7.
Use this dialog to locate the WMI data type in which you are interested. Because there are literally thousands of these, it is useful to use the Find box. In Figure 9-7, the search term "process" was entered, and the class CIM Processes was found under the rootCIMV2 node. Each instance of this class represents a single process running on the system. You are only interested in being notified when a new process is created, so ensure that Object Creation is selected from the drop-down menu.
After clicking OK, a CIM Processes Event Query node is added to the Management Events node. If you open a new instance of an application on your system, such as Notepad, you will see events being progressively added to this node. In the Build Management Event Query dialog shown in Figure 9-7, the default polling interval was set to 60 seconds, so you may need to wait up to 60 seconds for the event to show up in the tree once you have made the change.
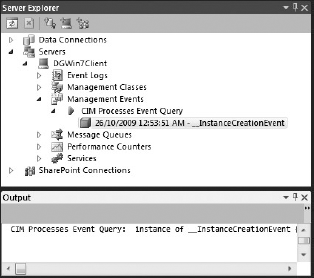
When the event does finally show up, it appears along with the date and time in the Server Explorer, and it also appears in the Output window, as shown in the lower pane of Figure 9-8. If you select the event, you will notice that the Properties window is populated with a large number of properties that don't really make any sense. However, once you know which of the properties to query, it is quite easy to trap, filter, and respond to system events.
To continue the example, drag a CheckBox control and a ListBox control from the Toolbox onto a new Windows Form.
Next drag the CIM Processes Event Query node from the Server Explorer onto a new form. This generates an instance of the System.Management.ManagementEventWatcher class, with properties configured so it will listen for the creation of a new process. The actual query can be accessed via the QueryString property of the nested ManagementQuery object. As with most watcher classes, the ManagementEventWatch class triggers an event when the watch conditions are met — in this case, the EventArrived event. To handle this event, add the following code:
- C#
private void managementEventWatcher1_EventArrived(System.Object sender,
                                     System.Management.EventArrivedEventArgs e)
{
    foreach (System.Management.PropertyData p in e.NewEvent.Properties)
    {
        if (p.Name == "TargetInstance")
        {
            var mbo = (System.Management.ManagementBaseObject)p.Value;
            string[] sCreatedProcess = {(string)mbo.Properties["Name"].Value,
                                        (string)mbo.Properties["ExecutablePath"].
                                        Value };
            this.BeginInvoke(new LogNewProcessDelegate(LogNewProcess),
                             sCreatedProcess);
        }
    }
}
delegate void LogNewProcessDelegate(string ProcessName, string ExePath); private void LogNewProcess(string ProcessName, string ExePath) { this.listBox1.Items.Add(string.Format("{0}—{1}", ProcessName, ExePath)); } private void checkBox1_CheckedChanged(System.Object sender, System.EventArgs e) { if (this.checkBox1.Checked) { this.managementEventWatcher1.Start(); } else { this.managementEventWatcher1.Stop(); } }
- VB
Private Sub ManagementEventWatcher1_EventArrived(ByVal sender As System.Object, _
                              ByVal e As System.Management.EventArrivedEventArgs)
    For Each p As System.Management.PropertyData In e.NewEvent.Properties
        If p.Name = "TargetInstance" Then
            Dim mbo As System.Management.ManagementBaseObject = _
                           CType(p.Value, System.Management.ManagementBaseObject)
            Dim sCreatedProcess As String() = {mbo.Properties("Name").Value, _
                                          mbo.Properties("ExecutablePath").Value}
            Me.BeginInvoke(New LogNewProcessDelegate(AddressOf LogNewProcess), _
                           sCreatedProcess)
        End If
    Next
End Sub

Delegate Sub LogNewProcessDelegate(ByVal ProcessName As String, _
                                   ByVal ExePath As String)
Private Sub LogNewProcess(ByVal ProcessName As String, ByVal ExePath As String)
    Me.ListBox1.Items.Add(String.Format("{0}—{1}", ProcessName, ExePath))
End Sub

Private Sub CheckBox1_CheckedChanged(ByVal sender As System.Object, _
                                             ByVal e As System.EventArgs) _
                                             Handles CheckBox1.CheckedChanged
    If Me.CheckBox1.Checked Then
        Me.ManagementEventWatcher1.Start()
    Else
        Me.ManagementEventWatcher1.Stop()
    End If
End Sub
In the event handler, you need to iterate through the Properties collection on the NewEvent object. Where an object has changed, two instances are returned: PreviousInstance, which holds the state at the beginning of the polling interval, and TargetInstance, which holds the state at the end of the polling interval. It is possible for the object to change state multiple times within the same polling period. If this is the case, an event will be triggered only when the state at the end of the period differs from the state at the beginning of the period. For example, no event is raised if a process is started and then stopped within a single polling interval.
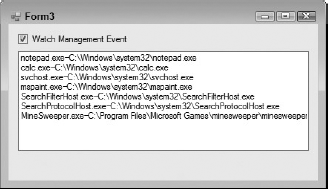
The event handler constructs a new ManagementBaseObject from a value passed into the event arguments to obtain the display name and executable path of the new process. Since UI controls can only be updated from the UI thread, you cannot directly update the ListBox. Instead you must call BeginInvoke to execute the LogNewProcess function on the UI thread. Figure 9-9 shows the form in action.
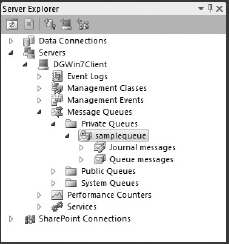
The Message Queues node, expanded in Figure 9-10, gives you access to the message queues available on your computer. You can use three types of queues: private, which will not appear when a foreign computer queries your computer; public, which will appear; and system, which is used for unsent messages and other exception reporting.
Note
To use the Message Queues node, you need to ensure that MSMQ is installed on your computer. You can do this via Programs and Features in the Control Panel. Select the Turn Windows Features On or Off task menu item and then select the checkbox to enable the Microsoft Message Queue (MSMQ) Server feature.
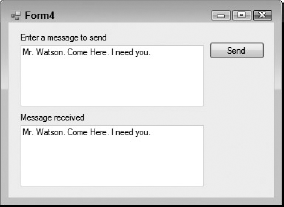
In Figure 9-10, a message queue called samplequeue has been added to the Private Queues node by selecting Create Queue from the right-click context menu. Once you have created a queue, you can create a properly configured instance of the MessageQueue class by dragging the queue onto a new Windows Form. To demonstrate the functionality of the MessageQueue object, add two TextBoxes and a button to the form, laid out as shown in Figure 9-11. The Send button is wired up to use the MessageQueue object to send the message entered in the first textbox. In the Load event for the form, a background thread is created that continually polls the queue to retrieve messages, which will populate the second textbox:
- C#
public Form4()
{
    InitializeComponent();
    var monitorThread = new System.Threading.Thread(MonitorMessageQueue);
monitorThread.IsBackground = true; monitorThread.Start(); this.Button1.Click +=new EventHandler(btn_Click); } private void btn_Click(object sender, EventArgs e) { this.messageQueue1.Send(this.TextBox1.Text); } private void MonitorMessageQueue() { var m = default(System.Messaging.Message); while (true) { try { m = this.messageQueue1.Receive(new TimeSpan(0, 0, 0, 0, 50)); this.ReceiveMessage((string)m.Body); } catch (System.Messaging.MessageQueueException ex) { if (!(ex.MessageQueueErrorCode == System.Messaging.MessageQueueErrorCode.IOTimeout)) { throw ex; } } System.Threading.Thread.Sleep(10000); } } private delegate void MessageDel(string msg); private void ReceiveMessage(string msg) { if (this.InvokeRequired) { this.BeginInvoke(new MessageDel(ReceiveMessage), msg); return; } this.TextBox2.Text = msg; }
- VB
Private Sub Form_Load(ByVal sender As Object, ByVal e As System.EventArgs) _
                      Handles Me.Load
    Dim monitorThread As New Threading.Thread(AddressOf MonitorMessageQueue)
    monitorThread.IsBackground = True
    monitorThread.Start()
End Sub
Private Sub btn_Click(ByVal sender As System.Object, ByVal e As System.EventArgs) _ Handles Button1.Click Me.MessageQueue1.Send(Me.TextBox1.Text) End Sub Private Sub MonitorMessageQueue() Dim m As Messaging.Message While True Try m = Me.MessageQueue1.Receive(New TimeSpan(0, 0, 0, 0, 50)) Me.ReceiveMessage(m.Body) Catch ex As Messaging.MessageQueueException If Not ex.MessageQueueErrorCode = _ Messaging.MessageQueueErrorCode.IOTimeout Then Throw ex End If End Try Threading.Thread.Sleep(10000) End While End Sub Private Delegate Sub MessageDel(ByVal msg As String) Private Sub ReceiveMessage(ByVal msg As String) If Me.InvokeRequired Then Me.BeginInvoke(New MessageDel(AddressOf ReceiveMessage), msg) Return End If Me.TextBox2.Text = msg End Sub
Note in this code snippet that the background thread is never explicitly closed. Because the thread has the IsBackground property set to True, it is automatically terminated when the application exits. As with the previous example, because the message processing is done in a background thread, you need to switch threads when you update the user interface using the BeginInvoke method. Putting this all together, you get a form like the one shown in Figure 9-11.
As messages are sent to the message queue, they appear under the appropriate queue in Server Explorer. Clicking the message displays its contents in the Properties window.
One of the most common things developers forget to consider when building an application is how it will be maintained and managed. For example, consider an application that was installed a year ago and has been operating without any issues. All of a sudden, requests start taking an unacceptable amount of time. It is clear that the application is not behaving correctly, but there is no way to determine the cause of the misbehavior. One strategy for identifying where the performance issues are is to use performance counters. Windows has many built-in performance counters that can be used to monitor operating system activity, and a lot of third-party software also installs performance counters so administrators can identify any rogue behavior.
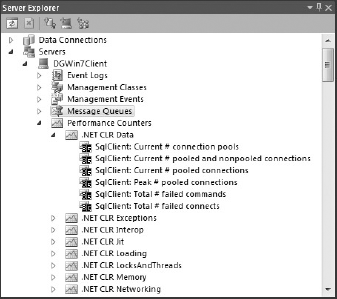
The Performance Counters node in the Server Explorer tree, expanded in Figure 9-12, has two primary functions. First, it enables you to view and retrieve information about the currently installed counters. You can also create new performance counters, as well as edit or delete existing counters. As you can see in Figure 9-12, under the Performance Counters node is a list of categories and under those is a list of counters.
Note
You must be running Visual Studio with Administrator rights to view the Performance Counters under the Server Explorer.
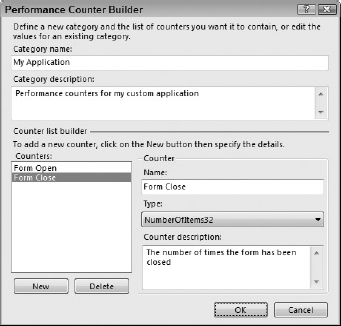
To edit either the category or the counters, select Edit Category from the right-click context menu for the category. To add a new category and associated counters, right-click the Performance Counters node and select Create New Category from the context menu. Both of these operations use the dialog shown in Figure 9-13. Here, a new performance counter category has been created that will be used to track a form's open and close events.
The second function of the Performance Counters section is to provide an easy way for you to access performance counters via your code. By dragging a performance counter category onto a form, you gain access to read and write to that performance counter. To continue with this chapter's example, drag the new My Application performance counters, Form Open and Form Close, onto a new Windows Form. Also add a couple of textboxes and a button so you can display the performance counter values. Finally, rename the performance counters so they have friendly names. This should give you a form similar to the one shown in Figure 9-14.
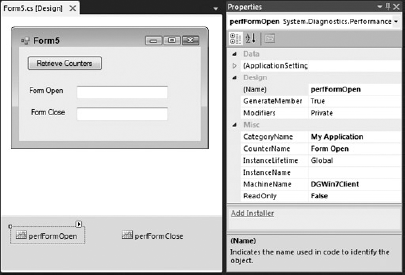
In the properties for the selected performance counter, you can see that the appropriate counter — in this case, Form Close — has been selected from the My Application category. You will also notice a MachineName property, which is the computer from which you are retrieving the counter information, and a ReadOnly property, which needs to be set to False if you want to update the counter. (By default, the ReadOnly property is set to True.) To complete this form, add the following code to the Retrieve Counters button click event handler:
- C#
this.textBox1.Text = this.perfFormOpen.RawValue.ToString();
this.textBox2.Text = this.perfFormClose.RawValue.ToString();

- VB
Me.textBox1.Text = Me.perfFormOpen.RawValue
Me.textBox2.Text = Me.perfFormClose.RawValue

You also need to add code to the application to update the performance counters. For example, you might have the following code in the Form Load event handlers:
- C#
this.perfFormOpen.Increment();
- VB
Me.perfFormOpen.Increment()
When you dragged the performance counter onto the form, you may have noticed a smart tag (small arrow that appears near the top-right corner when a control is selected) on the performance counter component that had a single item, Add Installer. When the component is selected, as in Figure 19-14, you will notice the same action at the bottom of the Properties window. Clicking this action in either place adds an Installer class to your solution that can be used to install the performance counter as part of your installation process. Of course, for this installer to be called, the assembly it belongs to must be added as a custom action for the deployment project. For more information on custom actions, see Chapter 48.
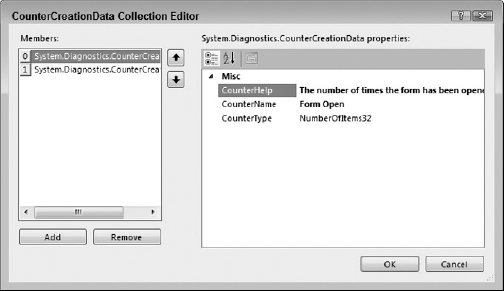
Prior to Visual Studio 2008, you needed to manually modify the installer to create multiple performance counters. In the current version, you can simply select each additional performance counter and click Add Installer. Visual Studio 2010 will direct you back to the first installer that was created and will have automatically added the second counter to the Counters collection of the PerformanceCounterInstaller component, as shown in Figure 9-15.
You can also add counters in other categories by adding additional PerformanceCounterInstaller components to the design surface. You are now ready to deploy your application with the knowledge that you will be able to use a tool such as PerfMon to monitor how your application is behaving.
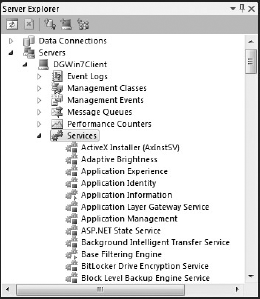
The Services node, expanded in Figure 9-16, shows the registered services for the computer. Each node indicates the state of that service in the bottom-right corner of the icon. Possible states are Stopped, Running, or Paused. Selecting a service displays additional information about the service, such as other service dependencies, in the Properties window.
As with other nodes in the Server Explorer, each service can be dragged onto the design surface of a form. This generates a ServiceController component in the nonvisual area of the form. By default, the ServiceName property is set to the service that you dragged across from the Server Explorer, but this can be changed to access information and control any service. Similarly, the MachineName property can be changed to connect to any computer to which you have access. The following code shows how you can stop a Service using ServiceController component:
- C#
this.serviceController1.Refresh();
if (this.serviceController1.CanStop)
{
    if (this.serviceController1.Status ==
             System.ServiceProcess.ServiceControllerStatus.Running)
    {
        this.serviceController1.Stop();
        this.serviceController1.Refresh();
    }
}
- VB
Me.ServiceController1.Refresh()
If Me.ServiceController1.CanStop Then
   If Me.ServiceController1.Status = _
         ServiceProcess.ServiceControllerStatus.Running Then
      Me.ServiceController1.Stop()
      Me.ServiceController1.Refresh()
   End If
End If
In addition to the three main states — Running, Paused, or Stopped — other transition states are ContinuePending, PausePending, StartPending, and StopPending. If you are about to start a service that may be dependent on another service that is in one of these transition states, you can call the WaitForStatus method to ensure that the service will start properly.
The Data Connections node allows you to connect to a database and perform a large range of administrative functions. You can connect to a wide variety of data sources including any edition of SQL Server, Microsoft Access, Oracle, or a generic ODBC data source. Figure 9-17 shows the Server Explorer connected to a SQL Server database file.
The Server Explorer provides access to the Visual Database, which will allow you to perform a large range of administrative functions on the connected database. You can create databases, add and modify tables, views, and stored procedures, manage indexes, execute queries, and much more. Chapter 26 covers all aspects of the Data Connections functionality.

New to Visual Studio 2010 is the ability to connect to a Microsoft Office SharePoint Server with the Server Explorer. This feature allows you to navigate and view many of the SharePoint resources and components.
The Server Explorer only provides read-only access to SharePoint resources — you cannot, for example, create or edit a list definition. Even so, it can be useful to have ready access to this information in Visual Studio when developing a SharePoint application. As with many of the components under the Servers Node you can also drag and drop certain SharePoint resources directly onto the design surface of your SharePoint project.
Using the Server Explorer to browse SharePoint resources is covered in detail in Chapter 24.
In this chapter you learned how the Server Explorer can be used to manage and work with computer resources and services. Chapter 22 continues the discussion on the Server Explorer, covering the Data Connections node in more detail. Chapter 24 wraps it all up with an in-depth look at managing SharePoint resources using the Server Explorer.