CHAPTER 12
NETWORK MANAGEMENT
NETWORK MANAGERS perform two key tasks: (1) designing new networks and network upgrades and (2) managing the day-to-day operation of existing networks. This chapter examines day-to-day network management, discussing the things that must be done to ensure that the network functions properly. We discuss the network management organization and the basic functions that a network manager must perform to operate a successful network.
OBJECTIVES ![]()
- Understand what is required to manage the day-to-day operation of networks
- Be familiar with the network management organization
- Understand configuration management
- Understand performance and fault management
- Be familiar with end user support
- Be familiar with cost management
CHAPTER OUTLINE ![]()
12.2 ORGANIZING THE NETWORK MANAGEMENT FUNCTION
12.2.1 The Shift to LANs and the Internet
12.2.2 Integrating LANs, WANs, and the Internet
12.2.3 Integrating Voice and Data Communications
12.3.1 Configuring the Network and Client Computers
12.3.2 Documenting the Configuration
12.4 PERFORMANCE AND FAULT MANAGEMENT
12.4.2 Failure Control Function
12.4.3 Performance and Failure Statistics
12.5.2 Providing End User Training
12.7 IMPLICATIONS FOR MANAGEMENT
12.1 INTRODUCTION
Network management is the process of operating, monitoring, and controlling the network to ensure it works as intended and provides value to its users. The primary objective of the data communications function is to move application-layer data from one location to another in a timely fashion and to provide the resources that allow this transfer to occur. This transfer of information may take place within a single department, between departments in an organization, or with entities outside the organization across private networks or the Internet.
Without a well-planned, well-designed network and without a well-organized network management staff, operating the network becomes extremely difficult. Unfortunately, many network managers spend most of their time firefighting—dealing with breakdowns and immediate problems. If managers do not spend enough time on planning and organizing the network and networking staff, which are needed to predict and prevent problems, they are destined to be reactive rather than proactive in solving problems.
In this chapter, we examine the network management function. We begin by examining the job of the network manager and how the network management function can be organized within companies. We then break down the activities that network managers perform into four basic functions: configuration management (knowing what hardware and software are where), performance and fault management (making sure the network operates as desired), end user support (assisting end users), and cost management (minimizing the cost of providing network services). In practice, it is difficult to separate the network manager's job into these four neat categories, but these are useful ways to help understand what a network manager does.
12.2 ORGANIZING THE NETWORK MANAGEMENT FUNCTION
Communication and networking functions present special organizational problems because they are both centralized and decentralized. The developers, gatherers, and users of data are typically decentralized. The need for communications and networking affects every business function, so the management of voice and data communications has traditionally been highly centralized. Networks and mainframe servers were “owned” and operated by centralized IT departments that were used to controlling every aspect of the IT and communication environment.
12.2.1 The Shift to LANs and the Internet
Since the late 1980s, this picture has changed dramatically. There has been an explosion in the use of microcomputer-based networks. In fact, more than 90 percent of most organizations’ total computer processing power (measured in millions of instructions per seconds) now resides on microcomputer-based LANs. Since the early 1990s, the number of computers attached to LANs has grown dramatically. Today, the host mainframe computer provides less than 10 percent of the organization's total computing power whereas the number of Internet-based servers (e.g., Web servers, mail servers) has grown dramatically.
Although the management of host-based mainframe networks will always be important, the future of network management lies in the successful management of multiple clients and servers communicating over LANs, BNs, and the Internet. Many LANs and Web servers were initially designed and implemented by individual departments as separate networks and applications, whose goals were to best meet the needs of their individual owners, not to integrate with other networks and applications.
Because each LAN was developed by a different department within the organization, not all LANs used the same architecture (e.g., shared 100Base-T versus switched 10Base-T, routed backbone versus switched backbone). The more types of network technology used, the more complex network management becomes.
12.2.2 Integrating LANs, WANs, and the Internet
The key to integrating LANs, WANs, and the Internet into one overall organization network is for both LAN/Web and WAN managers to recognize that they no longer have the power they once had. No longer can network managers make independent decisions without considering their impacts on other parts of the organization's network. There must be a single overall communications and networking goal that best meets the needs of the entire organization. This will require some network managers to compromise on policies that are not in the best interests of their own departments or networks.
The central data communication network organization should have a written charter that defines its purpose, operational philosophy, and long-range goals. These goals must conform both to the parent organization's information-processing goals and to its own departmental goals. Along with its long-term policies, the organization must develop individual procedures with which to implement the policies. Individual departments and LAN/Web managers must be free to implement their own policies and procedures that guide the day-to-day tasks of network staff.
12.1 WHAT DO NETWORK MANAGERS DO?
MANAGEMENT FOCUS
If you were to become a network manager, some of your responsibilities and tasks would be to
- Manage the day-to-day operations of the network.
- Provide support to network users.
- Ensure the network is operating reliably.
- Evaluate and acquire network hardware, software, and services.
- Manage the network technical staff.
- Manage the network budget, with emphasis on controlling costs.
- Develop a strategic (long-term) networking and voice communications plan to meet the organization's policies and goals.
- Keep abreast of the latest technological developments in computers, data communications devices, network software, and the Internet.
- Keep abreast of the latest technological developments in telephone technologies and metropolitan area and local area network services.
- Assist senior management in understanding the business implications of network decisions and the role of the network in business operations.
12.2 FIVE KEY MANAGEMENT TASKS
MANAGEMENT FOCUS
Planning activities require
- Forecasting
- Establishing objectives
- Scheduling
- Budgeting
- Allocating resources
- Developing policies
Organizing activities require
- Developing organizational structure
- Delegating
- Establishing relationships
- Establishing procedures
- Integrating the smaller organization with the larger organization
Directing activities require
- Initiating activities
- Decision making
- Communicating
- Motivating
Controlling activities require
- Establishing performance standards
- Measuring performance
- Evaluating performance
- Correcting performance
Staffing activities require
- Interviewing people
- Selecting people
- Developing People
12.2.3 Integrating Voice and Data Communications
Another major organizational challenge is the integration of the voice communication function with the data communication function. Traditionally, voice communications were handled by a manager in the facilities department who supervised the telephone switchboard systems and also coordinated the installation and maintenance of the organization's voice telephone networks. By contrast, data communications traditionally were handled by the IT department because the staff installed their own communication circuits as the need arose, rather than coordinating with the voice communications staff.
This separation of voice and data worked well over the years, but today changing communication technologies are causing enormous pressures to combine these functions. These pressures are magnified by the high cost of maintaining separate facilities, the low efficiency and productivity of the organization's employees because there are two separate network functions, and the potential political problems within an organization when neither manager wants to relinquish his or her functional duties or job position. A key factor in voice/data integration might turn out to be the elimination of one key management position and the merging of two staffs.
There is no perfect solution to this problem because it must be handled in a way unique to each organization. Depending on the business environment and specific communication needs, some organizations may want to combine these functions whereas others may find it better to keep them separate. We can state unequivocally that an organization that avoids studying this situation might be promoting inefficient communication systems, lower employee productivity, and increased operating costs for its separate voice and data networks.
12.3 NETWORK MANAGER JOB REQUIREMENTS
MANAGEMENT FOCUS
Being a network manager is not easy. We reviewed dozens of job posting for the key responsibilities, skills, and education desired by employers. Those responsibilities listed below were commonly mentioned.
Responsibilities:
- Determine network needs and architect solutions to address business requirements.
- Procure and manage vendor relations with providers of equipment and services.
- Deploy new network components and related network systems and services, including the creation of test plans and procedures, documentation of the operation, maintenance and administration of any new systems or services, and training.
- Develop, document, and enforce standards, procedures, and processes for the operation and maintenance of the network and related systems.
- Manage the efficiency of operations of the current network infrastructure, including analyzing network performance and making configuration adjustments as necessary.
- Administer the network servers and the network-printing environment.
- Ensure network security including the development of applicable security, server and desktop standards, and monitoring processes to ensure that mission critical processes are operational.
- Manage direct reports and contractors. This includes task assignments, performance monitoring, and regular feedback. Hire, train, evaluate, and terminate staff and contractors under the direction of company policies and processes.
- Assist business in the definition of new product/service offerings and the capabilities and features of the systems in order to deliver those products and services to our customers.
Skills required:
- Strong, up-to-date technology skills in a variety of technologies
- LAN/WAN networking experience working with routers and switches
- Experience with Internet access solutions, including firewalls and VPN
- Network architecture design and implementation experience
- Information security experience
- Personnel management experience
- Project management experience
- Experience working in a team environment
- Ability to work well in an unstructured environment
- Excellent problem-solving and analytical skills
- Effective written and oral communication skills
Education:
- Bachelor's degree in an information technology field
- Security Certification
- Microsoft MCSE Certification preferred
- Cisco CCNA Certification preferred
In communications, we are moving from an era in which the computer system is the dominant IT function to one in which communications networks are the dominant IT function. In some organizations, the total cost of both voice and data communications will equal or exceed the total cost of the computer systems.
12.3 CONFIGURATION MANAGEMENT
Configuration management means managing the network's hardware and software configuration, and documenting it, and ensuring it is updated as the configuration changes.
12.3.1 Configuring the Network and Client Computers
One of the most common configuration activities is adding and deleting user accounts. When new users are added to the network, they are usually categorized as being a member of some group of users (e.g., faculty, students, accounting department, personnel department). Each user group has its own access privileges, which define what file servers, directories, and files they can access and provide a standard log-in script. The log-in script specifies what commands are to be run when the user first logs in (e.g., setting default directories, connecting to public disks, running menu programs).
Another common activity is updating the software on the client computers attached to the network. Every time a new application system is developed or updated (or, for that matter, when a new version is released), each client computer in the organization must be updated. Traditionally, this has meant that someone from the networking staff has had to go to each client computer and manually install the software, either from diskettes/CDs or by downloading over the network. For a small organization, this is time consuming but not a major problem. For a large organization with hundreds or thousands of client computers (possibly with a mixture of Windows and Apples), this can be a nightmare.
Desktop management sometimes called electronic software delivery or automated software delivery, is one solution to the configuration problem. ESD enables network managers to install software on client computers over the network without physically touching each client computer. Most desktop management packages provide application-layer software for the network server and all client computers. The server software communicates directly with the desktop management software on the clients and can be instructed to download and install certain application packages on each client at some predefined time (e.g., at midnight on a Saturday or as requested by the user. Microsoft and many antivirus software vendors use this approach to deliver updates and patches to their software).
Desktop management greatly reduces the cost of configuration management over the long term because it eliminates the need to update each and every client computer manually. It also automatically produces and maintains accurate documentation of all software installed on each client computer and enables network managers to produce a variety of useful reports. However, desktop management increases costs in the short term because it costs money (typically $50 per client computer) and requires network staff to install it manually on each client computer. Desktop Management Interface (DMI) is the emerging standard for desktop management.
12.3.2 Documenting the Configuration
Configuration documentation includes information about network hardware, network software, user and application profiles, and network documentation. The most basic information about network hardware is a set of network configuration diagrams that document the number, type, and placement of network circuits (whether organization owned or leased from a common carrier), network servers, network devices (e.g., hubs, routers), and client computers. For most organizations, this is a large set of diagrams: one for each LAN, BN, and WAN. Figure 12.1 shows a diagram of network devices in one office location.
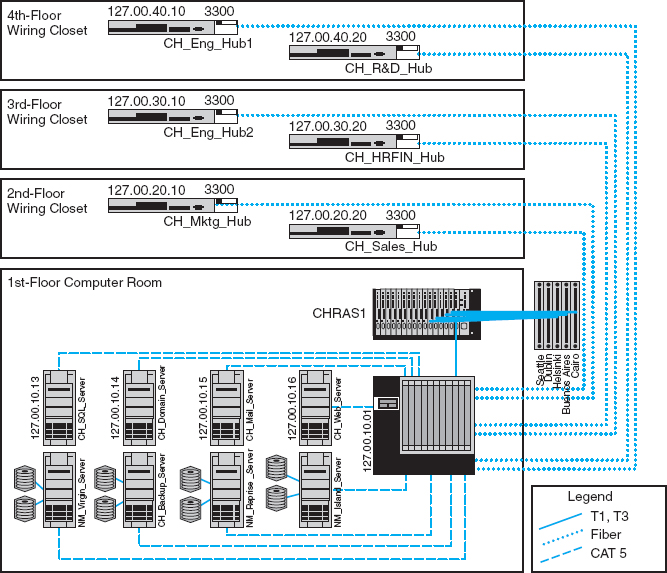
FIGURE 12.1 Network configuration diagram
Source: netViz
These diagrams must be supplemented by documentation on each individual network component (e.g., circuit, hub, server). Documentation should include the type of device, serial number, vendor, date of purchase, warranty information, repair history, telephone number for repairs, and any additional information or comments the network manager wishes to add. For example, it would be useful to include contact names and telephone numbers for the individual network managers responsible for each separate LAN within the network, and common carrier telephone contact information. (Whenever possible, establish a national account with the common carrier rather than dealing with individual common carriers in separate states and areas.)
A similar approach can be used for network software. This includes the network operating system and any special-purpose network software. For example, it is important to record which network operating system with which version or release date is installed on each network server. The same is true of application software. As discussed in Chapter 6 on LANs, sharing software on networks can greatly reduce costs although it is important to ensure that the organization is not violating any software license rules.
Software documentation can also help in negotiating site licenses for software. Many users buy software on a copy-by-copy basis, paying the retail price for each copy. It may be cheaper to negotiate the payment of one large fee for an unlimited use license for widely used software packages instead of paying on a per-copy basis.
The third type of documentation is the user and application profiles, which should be automatically provided by the network operating system or additional vendor or third-party software agreements. These should enable the network manager to easily identify the files and directories to which each user has access and each user's access rights (e.g., read-only, edit, delete). Equally important is the ability to access this information in the “opposite” direction; that is, to be able to select a file or directory and obtain a list of all authorized users and their access rights.
In addition, other documentation must be routinely developed and updated pertaining to the network. This includes network hardware and software manuals, application software manuals, standards manuals, operations manuals for network staff, vendor contracts and agreements, and licenses for software. The documentation should include details about performance and fault management (e.g., preventive maintenance guidelines and schedules, disaster recovery plan, and diagnostic techniques), end user support (e.g., applications software manuals, vendor support telephone numbers), and cost management (e.g., annual budgets, repair costs for each device). The documentation should also include any legal requirements to comply with local or federal laws, control, or regulatory bodies.
Maintaining documentation is usually a major issue for most organizations. Have you written programs? How well did you document them? Many technicians hate documentation because it is not “fun” and doesn't provide immediate value the same way that solving problems does. Therefore, it is often overlooked so when someone leaves the organization, the knowledge of the network leaves with them.
12.4 PERFORMANCE AND FAULT MANAGEMENT
Performance management means ensuring the network is operating as efficiently as possible whereas fault management means preventing, detecting, and correcting faults in the network circuits, hardware, and software (e.g., a broken device or improperly installed software). Fault management and performance management are closely related because any faults in the network reduce performance. Both require network monitoring, which means keeping track of the operation of network circuits and devices to ensure they are functioning properly and to determine how heavily they are used.
12.4.1 Network Monitoring
Most large organizations and many smaller ones use network management software to monitor and control their networks. One function provided by these systems is to collect operational statistics from the network devices. For small networks, network monitoring is often done by one person, aided by a few simple tools (discussed later in this chapter). These tools collect information and send messages to the network manager's computer.
A Day in the Life: Network Policy Manager
All large organizations have formal policies for the use of their networks (e.g., wireless LAN access, password, server space). Most large organizations have a special policy group devoted to the creation of network policies, many of which are devoted to network security. The job of the policy officer is to steer the policy through the policy making process and ensure that all policies are in the best interests of the organization as a whole. Although policies are focused inside the organization, policies are influenced by events both inside and outside the organization. The policy manager spends a significant amount of time working with outside organizations such as the U.S. Department of Homeland Security, CIO and security officer groups, and industry security consortiums. The goal is to make sure all policies (especially security policies) are up-to-date and provide a good balance between costs and benefits.
A typical policy begins with networking staff writing a summary containing the key points of the proposed policy. The policy manager takes the summary and uses it to develop a policy that fits the structure required for organizational policies (e.g., date, rationale, scope, responsible individuals, and procedures). This policy manager works with the originating staff to produce an initial draft of the proposed policy. Once everyone in the originating department and the policy office are satisfied with the policy, it is provided to an advisory committee of network users and network managers for discussion. Their suggestions are then incorporated in the policy or an explanation is provided is to why the suggestions will not be incorporated in the policy.
After several iterations, a policy becomes a draft policy and is posted for comment from all users within the organization. Comments are solicited from interested individuals and the policy may be revised. Once the draft is finalized, the policy is then presented to senior management for approval. Once approved, the policy is formally published, and the organization charged with implementing the policy begins to use it to guide their operations.
With thanks to Mark Bruhn
12.4 NETWORK MANAGEMENT SALARIES
MANAGEMENT FOCUS
Network management is not easy, but it doesn't pay too badly. Here are some typical jobs and their respective annual salaries.
| Network Vice President | $150,000 |
| Network Manager | 90,000 |
| Telecom Manager | 77,000 |
| LAN Administrator | 70,000 |
| WAN Administrator | 75,000 |
| Network Designer | 80,000 |
| Network Technician | 60,000 |
| Technical Support Staff | 50,000 |
| Trainer | 50,000 |
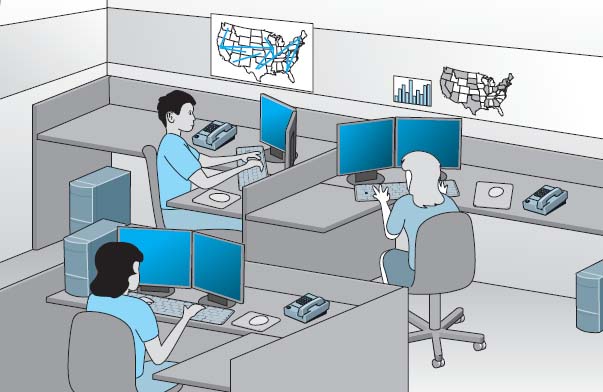
FIGURE 12.2 A network operations center
In large networks, network monitoring becomes more important. Large networks that support organizations operating 24 hours a day are often mission critical, which means a network problem can have serious business consequences. For example, consider the impact of a network failure for a common carrier such as AT&T or for the air traffic control system. These networks often have a dedicated network operations center (NOC) that is responsible for monitoring and fixing problems. Such centers are staffed by a set of skilled network technicians that use sophisticated network management software. When a problem occurs, the software immediately detects the problems and sends an alarm to the NOC. Staff members in the NOC diagnose the problem and can sometimes fix it from the NOC (e.g., restarting a failed device). Other times, when a device or circuit fails, they must change routing tables to route traffic away from the device and inform the common carrier or dispatch a technician to fix or replace it.
Figure 12.2 depicts an NOC similar to one at Indiana University. The NOC at Indiana University is staffed 24 hours a day, 7 days a week to monitor the university's networks. The NOC also has responsibility for managing portions of several very high-speed networks including the Abilene Network of Internet2 (see Management Focus Box 12.5).
The parameters monitored by a network management system fall into two distinct categories: physical network statistics and logical network information. Gathering statistics on the physical network parameters includes monitoring the operation of the network's modems, multiplexers, circuits linking the various hardware devices, and any other network devices. Monitoring the physical network consists of keeping track of circuits that may be down and tracing malfunctioning devices. Logical network parameters include performance measurement systems that keep track of user response times, the volume of traffic on a specific circuit, the destination of data routed across various networks, and any other indicators showing the level of service provided by the network.
Some types of management software operate passively, collecting the information and reporting it back to the central NOC. Others are active, in that they routinely send test messages to the servers or application being monitored (e.g., an HTTP Web page request) and record the response times. One common type of monitoring approach is the network weather map, which displays the usage of all major circuits in the network in real time.1
Performance tracking is important because it enables the network manager to be proactive and respond to performance problems before users begin to complain. Poor network reporting leads to an organization that is overburdened with current problems and lacks time to address future needs. Management requires adequate reports if it is to address future needs.
12.4.2 Failure Control Function
Failure control requires developing a central control philosophy for problem reporting, whether the problems are first identified by the NOC or by users calling in to the NOC or a help desk. Whether problem reporting is done by the NOC or the help desk, the organization should maintain a central telephone number for network users to call when any problem occurs in the network. As a central troubleshooting function, only this group or its designee should have the authority to call hardware or software vendors or common carriers.
Many years ago, before the importance (and cost) of network management was widely recognized, most networks ignored the importance of fault management. Network devices were “dumb” in that they did only what they were designed to do (e.g., routing packets) but did not provide any network management information.
For example, suppose a network interface card fails and begins to transmit garbage messages randomly. Network performance immediately begins to deteriorate because these random messages destroy the messages transmitted by other computers, which need to be retransmitted. Users notice a delay in response time and complain to the network support group, which begins to search for the cause. Even if the network support group suspects a failing network card (which is unlikely unless such an event has occurred before), locating the faulty card is very difficult and time consuming.
Most network managers today are installing managed devices that perform their functions (e.g., routing, switching) and also record data on the messages they process (see Chapter 12). These data can be sent to the network manager's computer when the device receives a special control message requesting the data, or it can send an alarm message to the network manager's computer if the device detects a critical situation. In this way, network faults and performance problems can be detected and reported by the devices themselves before they become serious. In the case of the failing network card, a managed device could record the increased number of retransmissions required to successfully transmit messages and inform the network management software of the problem. A managed hub or switch might even be able to detect the faulty transmissions from the failing network card, disable the incoming circuit so that the card could not send any more messages, and issue an alarm to the network manager. In either case, finding and fixing the fault is much simpler, requiring minutes, not hours.
MANAGEMENT FOCUS
The Abilene network is an Internet2 high-performance backbone that connects regional gigapops to provide high-speed network services to over 220 Internet2 university, corporate, and affiliate member institutions in all 50 states, the District of Columbia, and Puerto Rico. The current network is primarily an OC-192c (10 Gbps) backbone employing optical transport technology and advanced high-performance routers.
The network is monitored 24 hours a day, seven days a week from the network operations center (NOC) located on the campus of Indiana University in Indianapolis. The NOC oversees problem, configuration, and change management; network security; performance and policy monitoring; reporting; quality assurance; scheduling; and documentation. The center provides a structured environment that effectively coordinates operational activities with all participants and vendors related to the function of the network.
The NOC uses multiple network management software running across several platforms. Figure 12.3 shows one of the tools used by the NOC that is available to the general public: the Internet2 Weather Map. Each of the major circuits connecting the major Abilene gigapops is shown on the map. Each link has two parts, showing the utilization of the circuits to and from each pair of gigapops. The links are color-coded to quickly show the utilization of the link. Figure 12.3 is not in color so it is difficult to read, but if you visit the Abilene Web site (the URL is listed below), you can see that circuits with very low utilization are different shades of blue, which turn to green and then yellow and orange as utilization increases to 10 percent of capacity. Once utilization climbs above 30 percent, the link is shown in deeper shades of red and then purple. If you look back at the photo in Figure 12.2 you'll see the weather map displayed on the large screen in the NOC.
The link from the Chicago gigapop to the New York City gigapop, for example, indicates that over the last few minutes, an average of 546 Mbps has been transmitted, giving a 10 percent utilization. The link from New York City to Chicago shows that over the last few minutes, an average of 6.2 Gbps has been transmitted, giving a 70 percent utilization.
If you look carefully at the utilization rates and percentages, you will see that not all circuits in the Abilene network were 10 Gbps when this weather map was done. Currently, the plan is to upgrade most circuits to 100G.
__________
SOURCE: abilene.internet2.edu.
Numerous software packages are available for recording fault information. The reports they produce are known as trouble tickets. The software packages assist the help desk personnel so they can type the trouble report immediately into a computerized failure analysis program. They also automatically produce various statistical reports to track how many failures have occurred for each piece of hardware, circuit, or software package. Automated trouble tickets are better than paper because they allow management personnel to gather problem and vendor statistics. There are four main reasons for trouble tickets: problem tracking, problem statistics, problem-solving methodology, and management reports.
Problem tracking allows the network manager to determine who is responsible for correcting any outstanding problems. This is important because some problems often are forgotten in the rush of a very hectic day. In addition, anyone might request information on the status of a problem. The network manager can determine whether the problem-solving mechanism is meeting predetermined schedules. Finally, the manager can be assured that all problems are being addressed. Problem tracking also can assist in problem resolution. Are problems being resolved in a timely manner? Are overdue problems being flagged? Are all resources and information available for problem solving?
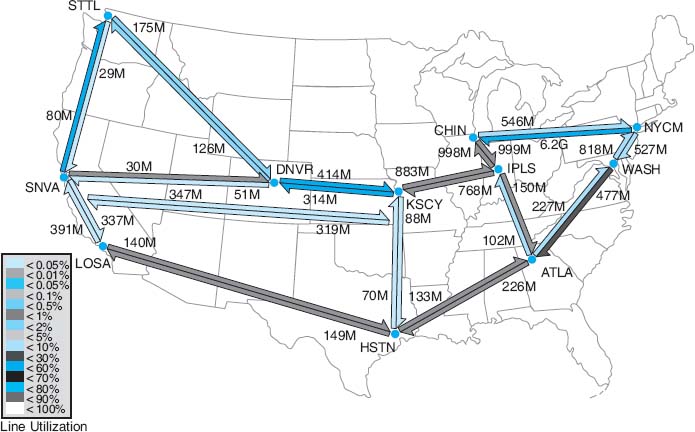
FIGURE 12.3 Internet2 Weather Map
Problem statistics are important because they are a control device for the network managers as well as for vendors. With this information, a manager can see how well the network is meeting the needs of end users. These statistics also can be used to determine whether vendors are meeting their contractual maintenance commitments. Finally, they help to determine whether problem-solving objectives are being met.
Problem prioritizing helps ensure that critical problems get priority over less important ones. For example, a network support staff member should not work on a problem on one client computer if an entire circuit with dozens of computers is waiting for help. Moreover, a manager must know whether problem-resolution objectives are being met. For example, how long is it taking to resolve critical problems?
Management reports are required to determine network availability, product and vendor reliability (mean time between failures), and vendor responsiveness. Without them, a manager has nothing more than a “best guess” estimate for the effectiveness of either the network's technicians or the vendor's technicians. Regardless of whether this information is typed immediately into an automated trouble ticket package or recorded manually in a bound notebook-style trouble log, the objectives are the same.
The purposes of the trouble log are to record problems that must be corrected and to keep track of statistics associated with these problems. For example, the log might reveal that there were 37 calls for software problems (3 for one package, 4 for another package, and 30 for a third software package), 26 calls for cable modem problems evenly distributed among two vendors, 49 calls for client computers, and 2 calls to the common carrier that provides the network circuits. These data are valuable when the design and analysis group begins redesigning the network to meet future requirements.
TECHNICAL FOCUS
Technical reports that are helpful to network managers are those that provide summary information, as well as details that enable the managers to improve the network. Technical details include:
- Circuit use
- Usage rate of critical hardware such as host computers, front-end processors, and servers
- File activity rates for database systems
- Usage by various categories of client computers
- Response time analysis per circuit or per computer
- Voice versus data usage per circuit
- Queue-length descriptions, whether in the host computer, in the front-end processor, or at remote sites
- Distribution of traffic by time of day, location, and type of application software
- Failure rates for circuits, hardware, and software
- Details of any network faults
12.4.3 Performance and Failure Statistics
There are many different types of failure and recovery statistics that can be collected. The most obvious performance statistics are those discussed above: how many packets are being moved on what circuits and what the response time is. Failure statistics also tell an important story.
One important failure statistic is availability, the percentage of time the network is available to users. It is calculated as the number of hours per month the network is available divided by the total number of hours per month (i.e., 24 hours per day × 30 days per month = 720 hours). The downtime includes times when the network is unavailable because of faults and routine maintenance and network upgrades. Most network managers strive for 99 to 99.5 percent availability, with downtime scheduled after normal working hours.
The mean time between failures (MTBF) is the number of hours or days of continuous operation before a component fails. Obviously, devices with higher MTBF are more reliable.
When faults occur, and devices or circuits go down, the mean time to repair (MTTR) is the average number of minutes or hours until the failed device or circuit is operational again. The MTTR is composed of these separate elements:
The mean time to diagnose (MTTD) is the average number of minutes until the root cause of the failure is correctly diagnosed. This is an indicator of the efficiency of problem management personnel in the NOC or help desk who receive the problem report.
12.2 ELEMENTS OF A TROUBLE REPORT
TECHNICAL FOCUS
When a problem is reported, the trouble log staff members should record the following:
- Time and date of the report
- Name and telephone number of the person who reported the problem
- The time and date of the problem (and the time and date of the call)
- Location of the problem
- The nature of the problem
- When the problem was identified
- Why and how the problem happened
The mean time to respond (MTTR) is the average number of minutes or hours until service personnel arrive at the problem location to begin work on the problem. This is a valuable statistic because it indicates how quickly vendors and internal groups respond to emergencies. Compilation of these figures over time can lead to a change of vendors or internal management policies or, at the minimum, can exert pressure on vendors who do not respond to problems promptly.
Finally, after the vendor or internal support group arrives on the premises, the last statistic is the mean time to fix (MTTF). This figure tells how quickly the staff is able to correct the problem after they arrive. A very long time to fix in comparison with the time of other vendors may indicate faulty equipment design, inadequately trained customer service technicians, or even the fact that inexperienced personnel are repeatedly sent to fix problems.
For example, suppose your Internet connection at home stops working. You call your ISP, and they fix it over the phone in 15 minutes. In this case, the MTTRepair is 15 minutes, and it is hard to separate the different parts (MTTD, MTTR, and MTTF). Suppose you call your ISP and spend 60 minutes on the phone with them, and they can't fix it over the phone; instead, the technician arrives the next day (18 hours later) and spends one hour fixing the problem. In this case MTTR = 1 hour + 18 hours + 1 hour = 20 hours.
The MTBF can be influenced by the original selection of vendor-supplied equipment. The MTTD relates directly to the ability of network personnel to isolate and diagnose failures and can often be improved by training. The MTTR (respond) can be influenced by showing vendors or internal groups how good or bad their response times have been in the past. The MTTF can be affected by the technical expertise of internal or vendor staff and the availability of spare parts onsite.
Another set of statistics that should be gathered are those collected daily by the network operations group, which uses network management software. These statistics record the normal operation of the network, such as the number of errors (retransmissions) per communication circuit. Statistics also should be collected on the daily volume of transmissions (characters per hour) for each communication circuit, each computer, or whatever is appropriate for the network. It is important to closely monitor usage rates, the percentage of the theoretical capacity that is being used. These data can identify computers/devices or communication circuits that have higher-than-average error or usage rates, and they may be used for predicting future growth patterns and failures. A device or circuit that is approaching maximum usage obviously needs to be upgraded.
TECHNICAL FOCUS
Management-oriented reports that are helpful to network managers and their supervisors provide summary information for overall evaluation and for network planning and design. Details include:
- Graphs of daily/weekly/monthly usage, number of errors, or whatever is appropriate to the network
- Network availability (uptime) for yesterday, the last 5 days, the last month, or any other specific period
- Percentage of hours per week the network is unavailable because of network maintenance and repair
- Fault diagnosis
- Whether most response times are less than or equal to 3 seconds for online real-time traffic
- Whether management reports are timely and contain the most up-to-date statistics
- Peak volume statistics as well as average volume statistics per circuit
- Comparison of activity between today and a similar previous period
Such predictions can be accomplished by establishing simple quality control charts similar to those used in manufacturing. Programs use an upper control limit and a lower control limit with regard to the number of blocks in error per day or per week. Notice how Figure 12.4 identifies when the common carrier moved a circuit from one microwave channel to another (circuit B), how a deteriorating circuit can be located and fixed before it goes through the upper control limit (circuit A) and causes problems for the users, or how a temporary high rate of errors (circuit C) can be encountered when installing new hardware and software.
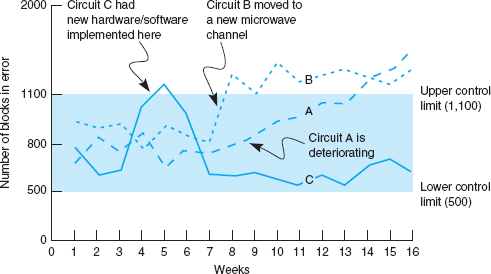
FIGURE 12.4 Quality control chart for circuits
12.4.4 Improving Performance
The chapters on LANs, BNs, and WANs discussed several specific actions that could be taken to improve network performance for each of those types of networks. There are also several general activities to improve performance that cut across the different types of networks.
Policy-Based Management A new approach to managing performance is policy-based management. With policy-based management, the network manager uses special software to set priority policies for network traffic that take effect when the network becomes busy. For example, the network manager might say that order processing and videoconferencing get the highest priority (order processing because it is the lifeblood of the company and videoconferencing because poor response time will have the greatest impact on it). The policy management software would then configure the network devices using the QoS capabilities in TCP/IP and/or ATM to give these applications the highest priority when the devices become busy.
Service-Level Agreements More organizations establish service-level agreements (SLAs) with their common carriers and Internet service providers. An SLA specifies the exact type of performance and fault conditions that the organization will accept. For example, the SLA might state that network availability must be 99 percent or higher and that the MTBF for T1 circuits must be 120 days or more. In many cases, SLA includes maximum allowable response times. The SLA also states what compensation the service provider must provide if it fails to meet the SLA. Some organizations are also starting to use an SLA internally to define relationships between the networking group and its organizational “customers.”
12.4 INSIDE A SERVICE-LEVEL AGREEMENT
TECHNICAL FOCUS
There are many elements to a solid service-level agreement (SLA) with a common carrier. Some of the important ones include
- Network availability, measured over a month as the percentage of time the network is available (e.g., [total hours—hours unavailable]/total hours) should be at least 99.5 percent
- Average round-trip permanent virtual circuit (PVC) delay, measured over a month as the number of seconds it takes a message to travel over the PVC from sender to receiver, should be less than 110 milliseconds, although some carriers will offer discounted services for SLA guarantees of 300 milliseconds or less
- PVC throughput, measured over a month as the number of outbound packets sent over a PVC divided by the inbound packets received at the
- destination (not counting packets over the committed information rate, which are discard eligible), should be above 99 percent—ideally, 99.99 percent
- Mean time to respond, measured as a monthly average of the time from inception of trouble ticket until repair personnel are on site, should be 4 hours or less
- Mean time to fix, measured as a monthly average of the time from the arrival of repair personnel on-site until the problem is repaired, should be 4 hours or less
__________
SOURCE: “Carrier Service-Level Agreements,” International Engineering Consortium Tutorial, www.iec.org, February 2001.
12.5 END USER SUPPORT
Providing end user support means solving whatever problems users encounter while using the network. There are three main functions within end user support: resolving network faults, resolving user problems, and training. We have already discussed how to resolve network faults, and now we focus on resolution of user problems and end user training.
12.5.1 Resolving Problems
Problems with user equipment (as distinct from network equipment) usually stem from three major sources. The first is a failed hardware device. These are usually the easiest to fix. A network technician simply fixes the device or installs a new part.
The second type of problem is a lack of user knowledge. These problems can usually be solved by discussing the situation with the user and taking that person through the process step by step. This is the next easiest type of problem to solve and can often be done by email or over the telephone, although not all users are easy to work with. Problematic users are sometimes called ID ten-T errors, written ID10T.
The third type of problem is one with the software, software settings, or an incompatibility between the software and network software and hardware. In this case, there may be a bug in the software or the software may not function properly on a certain combination of hardware and software. Solving these problems may be difficult because they require expertise with the specific software package in use and sometimes require software upgrades from the vendor.
Resolving either type of software problem begins with a request for assistance from the help desk. Requests for assistance are usually handled in the same manner as network faults. A trouble log is maintained to document all incoming requests and the manner in which they are resolved. The staff member receiving the request attempts to resolve the problem in the best manner possible. Staff members should be provided with a set of standard procedures or scripts for soliciting information from the user about problems. In large organizations, this process may be supported by special software.
There are often several levels to the problem-resolution process. The first level is the most basic. All staff members working at the help desk should be able to resolve most of these. Most organizations strive to resolve between 75 and 85 percent of requests at this first level in less than an hour. If the request cannot be resolved, it is escalated to the second level of problem resolution. Escalation is a normal part of the process and not something that is “bad.” Staff members who handle second-level support have specialized skills in certain problem areas or with certain types of software and hardware. In most cases, problems are resolved at this level. Some large organizations also have a third level of resolution in which specialists spend many hours developing and testing various solutions to the problem, often in conjunction with staff members from the vendors of network software and hardware.
12.5.2 Providing End User Training
End user training is an ongoing responsibility of the network manager. Training is a key part in the implementation of new networks or network components. It is also important to have an ongoing training program because employees may change job functions and new employees require training to use the organization's networks.
Training usually is conducted through in-class, one-on-one instruction, and online self-paced courses. In-class training should focus on the 20 percent of the network functions that the user will use 80 percent of the time instead of attempting to cover all network functions. By getting in-depth instruction on the fundamentals, users become confident about what they need to do. The training should also explain how to locate additional information from online support, documentation, or the help desk.
12.6 COST MANAGEMENT
One of the most challenging areas of network management over the past few years has been cost management. Data traffic has been growing much more rapidly than has the network management budget, which has forced network managers to provide greater network capacity at an ever lower cost per megabyte (Figure 12.5). In this section, we examine the major sources of costs and discuss several ways to reduce them.
12.6.1 Sources of Costs
The cost of operating a network in a large organization can be very expensive. Figure 12.6 shows a recent cost analysis to operate the network for one year at Indiana University, a large Big Ten research university serving 36,000 students and 4,000 faculty and staff. This analysis includes the costs of operating the network infrastructure and standard applications such as email and the Web, but does not include the costs of other applications such as course management software, registration, student services, accounting, and so on. Indiana University has a federal IT governance structure, which means that the different colleges and schools on campus also have budgets to hire staff and buy equipment for their faculty and staff. The budget in this figure omits these amounts, so the real costs are probably 50 percent higher than those shown. Nonetheless, this presents a snapshot of the costs of running a large network.
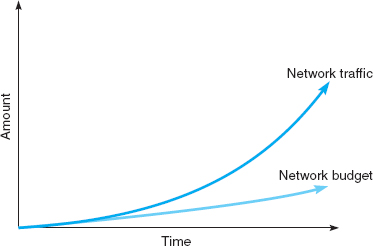
FIGURE 12.5 Network traffic versus network management budgets
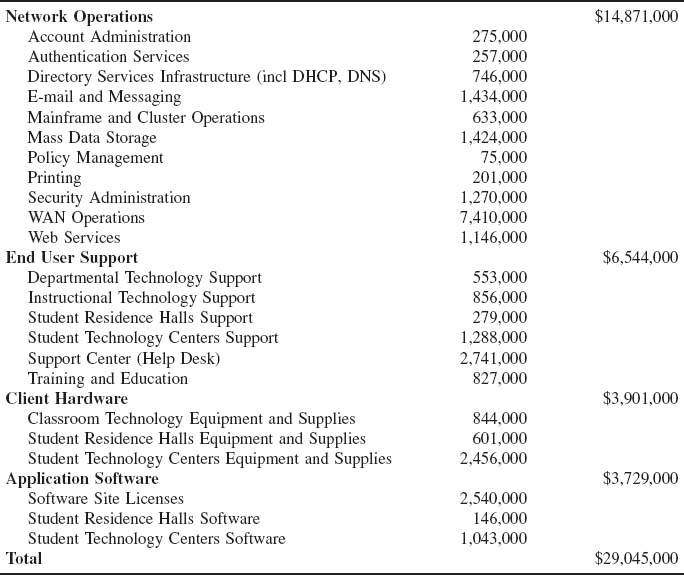
FIGURE 12.6 Annual networking costs at Indiana University
The largest area of costs in network operations is the $7.4 million spent on WAN circuits. Indiana University operates many high-speed networks (including Internet2) so these costs are higher than might be expected. This figure also shows the large costs of email, Web services, data storage, and security. The cost of end user support is the next largest cost item. This includes training as well as answering users’ questions and fixing their problems. The remaining costs are purchasing new and replacement hardware and software. But, once again, remember that this does not include the hardware and software purchased by individual colleges and schools for their faculty and staff which does not come from the central IT budget.
The total cost of ownership (TCO) is a measure of how much it costs per year to keep one computer operating. TCO includes the actual direct cost of repair parts, software upgrades, and support staff members to maintain the network, install software, administer the network (e.g., create user IDs, back up user data), provide training and technical support, and upgrade hardware and software. It also includes the indirect cost of time “wasted” by the user when problems occur, when the network is down, or when the user is attempting to learn new software.
Several studies over the past few years by Gartner Group, Inc, a leading industry research firm, suggest that the TCO of a computer is astoundingly high. Most studies suggest that the TCO for typical Windows computers on a network is about $7,000 per computer per year. In other words, it costs almost five times as much each year to operate a computer than it does to purchase it in the first place. Other studies by firms such as IBM and Information Week, an industry magazine, have produced TCO estimates of between $5,000 and $10,000 per year, suggesting that the Gartner Group's estimates are reasonable.
Although TCO has been accepted by many organizations, other firms argue against the practice of including indirect in the calculation. For example, using a technique that includes indirect, the TCO of a coffee machine is more than $50,000 per year—not counting the cost of the coffee or supplies. The assumption that getting coffee “wastes” 12 minutes per day times 5 days per week yields 1 hour per week, or about 50 hours per year, of wasted time. If you assume the coffeepot serves 20 employees who have an average cost of $50 per hour (not an unusually high number), you have a loss of $50,000 per year.
Some organizations, therefore, prefer to focus on costing methods that examine only the direct costs of operating the computers, omitting softer indirect costs such as “wasted” time. Such measures, often called network cost of ownership (NCO) or real TCO, have found that NCO ranges between $1,500 and $3,500 per computer per year. The typical network management group for a 100-user network would therefore have an annual budget of about $150,000 to $350,000. The most expensive item is personnel (network managers and technicians), which typically accounts for 50 to 70 percent of total costs. The second most expensive cost item is WAN circuits, followed by hardware upgrades and replacement parts.
Calculating TCO for univerisites can be difficult. Do we calculate TCO for the number of computers or the number of users. Figure 12.6 shows an annual cost of $29 million. If we use the number of users, the TCO is about $725 ($29 million divided by 40,000 users). If we use the number of computers, TCO is $4,800 ($29 million divided by about 6,000 computers owned by the university).
There is one very important message from this pattern of costs. Because the largest cost item is personnel time, the primary focus of cost management lies in designing networks and developing policies to reduce personnel time, not to reduce hardware cost. Over the long term, it makes more sense to buy more expensive equipment if it can reduce the cost of network management.
Figure 12.7 shows the average breakdown of personnel costs by function. The largest time cost (where staff members spend most of their time) is systems management, which includes configuration, fault, and performance management tasks that focus on the network as a whole. The second largest item is end user support.
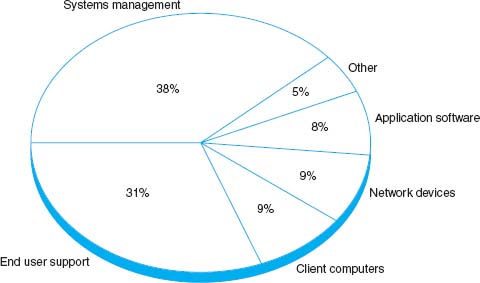
FIGURE 12.7 Network management personnel costs
Network managers usually find it difficult to manage their budgets because networks grow so rapidly. They often find themselves having to defend ever-increasing requests for more equipment and staff. To counter these escalating costs, many large organizations have adopted charge-back policies for users of WANs and mainframe-based networks. (A charge-back policy attempts to allocate the costs associated with the network to specific users.) These users must “pay” for their network usage by transferring part of their budget allocations to the network group. Such policies are seldom used in LANs, making one more potential cultural difference between network management styles.
12.6.2 Reducing Costs
Given the huge amounts in TCO or even the substantial amounts spent in NCO, there is considerable pressure on network managers to reduce costs. Figure 12.8 summarizes five steps to reduce network costs.
The first and most important step is to develop standards for client computers, servers, and network devices (i.e., switches, routers). These standards define one configuration (or a small set of configurations) that are permitted for all computers and devices. Standardizing hardware and software makes it easier to diagnose and fix problems. Also, there are fewer software packages for the network support staff members to learn. The downside, of course, is that rigid adherence to standards reduces innovation.
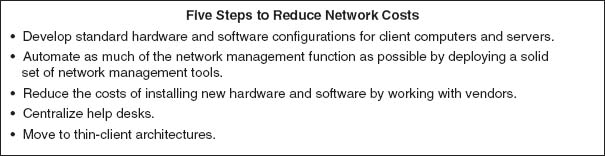
FIGURE 12.8 Reducing network costs
12.6 TOTAL COST OF OWNERSHIP IN MINNESOTA
MANAGEMENT FOCUS
Total Cost of Ownership (TCO) has come to the classroom. As part of a national TCO initiative, several school districts, including one in Minnesota, recently conducted a TCO analysis. The school district was a system of eight schools (one high school, one middle school, and six elementary schools) serving 4,100 students in kindergarten through grade 12. All schools are connected via a frame relay WAN to the district head office.
Costs were assessed in two major groups: direct costs and indirect costs. The direct costs included the costs of hardware (replacement client computers, servers, networks, and printers and supplies), software, internal network staff, and external consultants. The indirect costs included staff training and development. “Wasted time” was not included in the TCO analysis.
The district examined its most recent annual budget and allocated its spending into these categories. The district calculated that it spent about $1.2 million per year to support its 1,200 client computers, providing a TCO of about $1,004 per client computer per year. Figure 12.9 provides a summary of the costs by category.
A TCO of $1,004 is below average, indicating a well-managed network. The district had implemented several network management best practices, such as using a standardized set of software, using new standardized hardware, and providing professional development to teachers to reduce support costs. One other major contributing factor was the extremely low salaries paid to the IT technical staff (less than $25,000 per year) because of the district's rural location. Had the district been located in a more urban area, IT staff costs would double, bringing TCO closer to the lower end of the national average.
__________
SOURCE: “Minnesota District Case Study,” Taking TCO to the Classroom, k12tco.gartner.com, 2004.
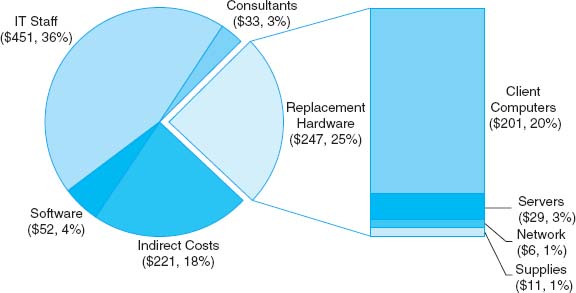
FIGURE 12.9 Total Cost of Ownership (per client computer per year) for a Minnesota school district
The second most important step is automate as much of the network management process as possible. Desktop management can significantly reduce the cost to upgrade when new software is released. It also enables faster installation of new computers and faster recovery when software needs to be reinstalled and helps enforce the standards policies. Dynamic address assignment (e.g., DHCP; see Chapter 5) can reduce time spent on managing TCP/IP addresses. The use of network management software to identify and diagnose problems can significantly reduce time spent in performance and fault management. Likewise, help desk software can cut the cost of the end support function.
A third step is to do everything possible to reduce the time spent installing new hardware and software. The cost of a network technician's spending half a day to install and configure new computers is often $300 to $500. Desktop management is an important step to reducing costs, but careful purchasing can also go a long way. The installation of standard hardware and software (e.g., Microsoft Office) by the hardware vendor can significantly reduce costs. Likewise, careful monitoring of hardware failures can quickly identify vendors of less reliable equipment who should be avoided in the next purchasing cycle.
Traditionally, help desks have been decentralized into user departments. The result is a proliferation of help desks and support staff members, many of whom tend to be generalists rather than specialists in one area. Many organizations have found that centralizing help desks enables them to reduce the number of generalists and provide more specialists in key technology areas. This results in faster resolution of difficult problems. Centralization also makes it easier to identify common problems occurring in different parts of the organization and take actions to reduce them.
Finally, many network experts argue that moving to thin-client architectures, just Web browsers on the client (see Chapter 2), can significantly reduce costs. Although this can reduce the cost to buy software, the real saving lies in the support costs. Because they are restricted to a narrow set of functions and generally do not need software installations, thin-client architectures become much easier to manage. TCO and NCO drop by 20 to 40 percent. Most organizations anticipate using thin-client architectures selectively, in areas where applications are well defined and can easily be restricted.
12.7 IMPLICATIONS FOR MANAGEMENT
Network management is one of the more challenging functions because it requires a good understanding of networking technologies, an ability to work with end users and management, and an understanding of the key elements driving networking costs. Normally no one notices it until something goes wrong.
As demand for network capacity increases, the costs associated with network management have typically increased in most organizations. Justifying these increased costs to senior management can be challenging because senior management often do not see greatly increasing amounts of network traffic—all they see are increasing costs. The ability to explain the business value of networks in terms understandable to senior management is an important skill.
As networks become larger and more complex, network management will increase in complexity. New technologies for managing networks will be developed, as vendors attempt to increase the intelligence of networks and their ability to “self-heal.” These new technologies will provide significantly more reliable networks, but will also be more expensive and will require new skills on the part of network designers, network managers, and network technicians. Keeping a trained network staff will become increasingly difficult because once staff acquire experience with the new management tools, they will be lured away by other firms offering higher salaries—which, we suppose, is not a bad thing if you're one of the network staff.
SUMMARY
Integrating LANs, WANs, and the Internet Today, the critical issue is the integration of all organizational networks. The keys to integrating LANs, WANs, and the Web into one overall organization network are for WAN managers to recognize that LAN/Web managers can make independent decisions and for LAN/Web managers to realize that they need to work within organizational standards.
Integrating Voice and Data Communications Another major challenge is combining voice communications with data and image communications. This separation of voice and data worked well for years, but changing communication technologies are generating enormous pressures to combine them. A key factor in voice/data integration might turn out to be the elimination of one key management position and the merging of two staffs into one.
Configuration Management Configuration management means managing the network's hardware and software configuration, documenting it, and ensuring the documentation is updated as the configuration changes. The most common configuration management activity is adding and deleting user accounts. The most basic documentation about network hardware is a set of network configuration diagrams, supplemented by documentation on each individual network component. A similar approach can be used for network software. Desktop management plays a key role in simplifying configuration management by automating and documenting the network configurations. User and application profiles should be automatically provided by the network and desktop management software. There are a variety of other documentation that must be routinely developed and updated, including users’ manuals and organizational policies.
Performance and Fault Management Performance management means ensuring the network is operating as efficiently as possible. Fault management means preventing, detecting, and correcting any faults in the network circuits, hardware, and software. The two are closely related because any faults in the network reduce performance and because both require network monitoring. Today, most networks use a combination of smart devices to monitor the network and issue alarms and a help desk to respond to user problems. Problem tracking allows the network manager to determine problem ownership or who is responsible for correcting any outstanding problems. Problem statistics are important because they are a control device for the network operators as well as for vendors.
Providing End User Support Providing end user support means solving whatever network problems users encounter. Support consists of resolving network faults, resolving software problems, and training. Software problems often stem from lack of user knowledge, fundamental problems with the software, or an incompatibility between the software and the network's software and hardware. There are often several levels to problem resolution. End user training is an ongoing responsibility of the network manager. Training usually has two parts: in-class instruction and the documentation and training manuals that the user keeps for reference.
Cost Management As the demand for network services grows, so does its cost. The TCO for typical networked computers is about $10,000 per year per computer, far more than the initial purchase price. The network management cost (omitting “wasted” time) is between $1,500 and $3,500 per year per computer. The largest single cost item is staff salaries. The best way to control rapidly increasing network costs is to reduce the amount of time taken to perform management functions, often by automating as many routine ones as possible.
KEY TERMS
availability
charge-back policy
configuration management
cost management
desktop management
downtime
end user support
fault management
firefighting
help desk
logical network parameters
mean time between failures (MTBF)
mean time to diagnose (MTTD)
mean time to fix (MTTF)
mean time to repair (MTTR)
mean time to respond (MTTR)
monitor
network cost of ownership (NCO)
network documentation
network management
network monitoring
network operations center (NOC)
network weather map
performance management
physical network parameters
problem statistics
problem tracking
quality control chart
service-level agreement (SLA)
total cost of ownership (TCO)
trouble ticket
uptime
QUESTIONS
- What are some differences between LAN and WAN management?
- What is firefighting?
- Why is combining voice and data a major organizational challenge?
- Describe what configuration management encompasses.
- People tend to think of software when documentation is mentioned. What is documentation in a network situation?
- What is desktop management and why is it important?
- What is performance and fault management?
- What does a help desk do?
- What do trouble tickets report?
- Several important statistics related to network uptime and downtime are discussed in this chapter. What are they and why are they important?
- What is an SLA?
- How is network availability calculated?
- What is problem escalation?
- What are the primary functions of end user support?
- What is TCO?
- Why is the TCO so high?
- How can network costs be reduced?
- What do network management software systems do and why are they important?
- How does network cost of ownership differ from total cost of ownership? Which is the most useful measure of network costs from the point of view of the network manager? Why?
- Many organizations do not have a formal trouble reporting system. Why do you think this is the case?
EXERCISES
12-1. What factors might cause peak loads in a network? How can a network manager determine if they are important and how are they taken into account when designing a data communications network?
12-2. Today's network managers face a number of demanding problems. Investigate and discuss three major issues.
12-3. Research the networking budget in your organization and discuss the major cost areas. Discuss several ways of reducing costs over the long term.
12-4. Explore the Internet2 weather map at abilene.internet2.edu.
12-5. Do the puzzle on the next page.

I. City School District, Part 1
City School District is a large, urban school district that operates 27 schools serving 22,000 students from kindergarten through grade 12. All schools are networked into a regional WAN that connects the schools to the district central office and each other. The district has a total of 5,300 client computers. The table below shows the annual costs. Calculate the real TCO (without wasted time).
| Budget Item | Annual Cost |
| IT Staff Salaries | $7,038,400 |
| Consultants | 1,340,900 |
| Software | 657,200 |
| Staff training | 545,900 |
| Client computers | 2,236,600 |
| Servers | 355,100 |
| Network | 63,600 |
| Supplies and parts | 2,114,700 |
II. City School District, Part 2
Read and complete Mini-case I above. Examine the TCO by category. Do you think that this TCO indicates a well-run network? What suggestions would you have?
III. Central Textiles
Central Textiles is a clothing manufacturer that operates 16 plants throughout the southern United States and in Latin America. The Information Systems Department, which reports to the vice president of finance, operates the central mainframe and LAN at the headquarters building in Spartanburg, South Carolina, and the WAN that connects all the plants. The LANs in each plant are managed by a separate IT group at each plant that reports to the plant manager (the plant managers report to the vice president of manufacturing). The telephone communications system and long-distance agreements are managed by a telecommunications department in the headquarters that reports to the vice president of finance. The CEO of Central Textiles has come to you asking about whether this is the best arrangement, or whether it would make more sense to integrate the three functions under one new department. Outline the pros and cons of both alternatives.
IV. Internet2
Reread Management Focus 12.5. If the weather map shown in Figure 12.3 is a typical traffic pattern for Internet2, how would you suggest that they improve performance?
HANDS-ON ACTIVITY 12A
Network Monitoring
One of the key tasks of network management is monitoring the network to make sure everything is running well. There are many effective network monitoring tools available and several have demonstrations you can view on the Web. One of my favorites is solarwinds.net. They have a live demonstration of their network management software available at npm.solarwinds.net.
Once you arrive at their page you can select which part of their network to examine. Figure 12.10 shows the U.S. portion of the network. It shows a map of the network with circuits and locations color coded to show their status (green for good, yellow for some problems, and red for major problems), although the colors are hard to see in the figure. You can click on a circuit, a city, or a link on the bottom of the page to obtain more information about that part of the network.
The Tulsa Office shows green on the map, with a small red box next to it in the more detailed listing below the map. This indicates that the network is operating well, but that there is minor trouble with some part of the network that is not having a major impact.
Figure 12.11 shows what happened when I clicked on the Tulsa Office. We now see the details of the network in Tulsa. It has a set of switches and routers, all of which are green, except the Amsterdam Lab Router (GWC198) which is shown in bright red (although it's hard to see the real colors from this figure). The table below the network map also says that the router is down, again in bright red letters, in addition to a red bullet in front of the line.
You can click on any device in the picture or in the table to obtain more information about it. Figure 12.12 shows the status of the Gateway Router which connects the Tulsa Office to the 12vBNS network at the top of the display. At first glance, you can see the four “dashboard gauges” that show that response time is good at below 150 milliseconds, that there is no noticeable packet loss, that the CPU load is good at less than 30 percent, and that memory usage is hitting the high level at almost 75 percent. Memory usage is not yet a problem, but it's probably time to plan for a memory upgrade before the device begins to have problems from running out of memory.
The two graphs in this figure show data over the past 12 hours for comparison. The first graph shows a few spikes in response time in the morning (a Monday morning) as people returning from the weekend begin reading email, but nothing that would be a problem. Likewise, between 2 a.m. and 5 a.m., something happened to cause some packet loss but it was not substantial (major thunderstorms swept through Tulsa overnight, so they may have been to blame). The second graph shows that the CPU load was fairly constant over the last 12 hours, always below 30 percent.
The rest of the display shows additional information about the device, such as what it is (a Cisco 1601 router), what version of the operating system it is running (12.0(8)), its IP address (65.113.77.57), and when it was last booted (2:33 a.m., March 2, 2006).
Deliverables
- What is the general status of the Boston location right now?
- Are there any problems in the Boston location? If so, describe them.
- Pick one of the devices in Boston. How has response changed over the past 24 hours?
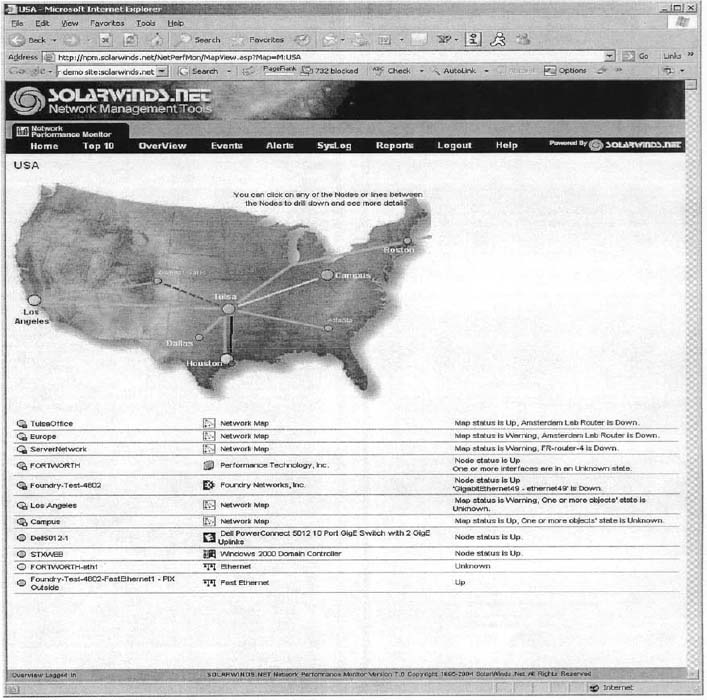
FIGURE 12.10 Solarwinds.net network monitoring software
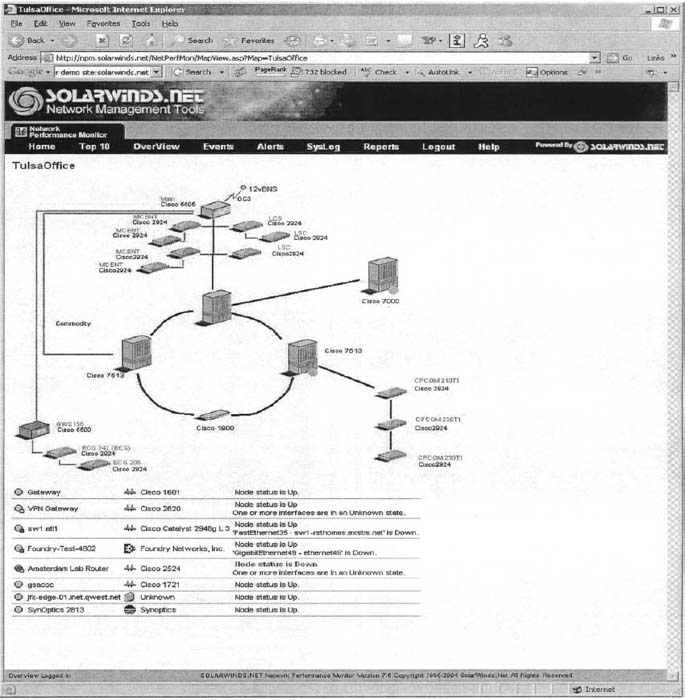
FIGURE 12.11 Status of the Tulsa office
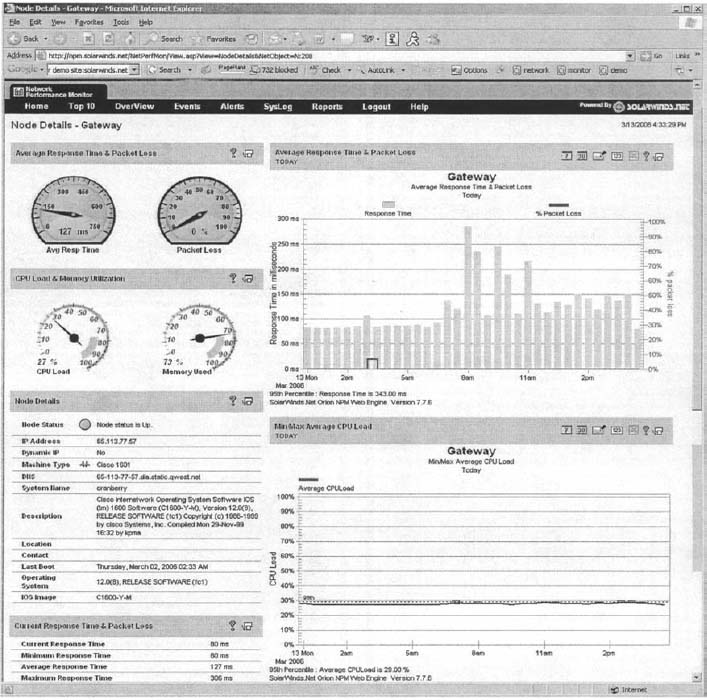
FIGURE 12.12 Information about the Gateway router
1 One example of network weather maps for the Internet that provides a simple overview is www.InternetTrafficReport.com.