![]()
One of the most powerful aspects of TFS is the fact that data from the different disciplines in the team is stored in one central database. As an ALM platform this is very valuable because we can use this data to gather knowledge of work done over the entire process, not just in an isolated practice. This is something few other tools on the market offer and can be extremely powerful for us as software makers. Unfortunately many teams are unaware of these capabilities of TFS which is something that needs to change.
In the previous chapters on Metrics and ALM Assessments we have looked at important KPIs and how the information from work in each phase in the ALM process is stored in the data warehouse in TFS.
In this chapter we will first drill into the data warehouse and reporting architecture in TFS. Having gained an understanding of the way information is stored in TFS we can then move on and look at the different ways of getting to the information and create reports over the metrics that matters to us.
TFS is built for scale and to handle large volumes of data used by many users. Hence, there must be a saleable solution for reporting to support the analysis of the data. To solve this challenge we will not do heavy reporting on the online system, but instead use a separate data warehouse for analysis.
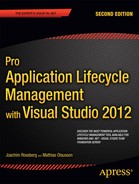
As you can see from Figure 32-1, data is replicated from the various real-time SQL Server tables in TFS to a set of reporting databases.
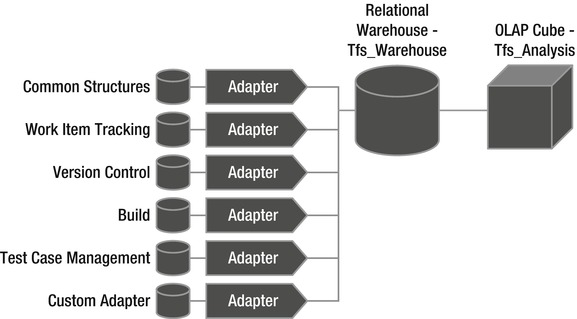
Figure 32-1. TFS reporting architecture
Warehouse adapters transform the data from the operational store into the relational warehouse database. The adapter does not translate all data into the warehouse, typically only data that makes sense to do trend analysis are transformed (for instance work item history or test case steps are not available in the data warehouse).
Finally, data is aggregated from the relational warehouse into a Microsoft SQL Server Analysis Services OLAP cube. Online Analytical Processing (OLAP) is a business intelligence solution that enables data mining in large data volumes by restructuring the data in a format more suitable for analytics.
![]() Note Work Item data is added to the warehouse based on the reportable attribute on the work item field definition. The reportable attribute can have the following values:
Note Work Item data is added to the warehouse based on the reportable attribute on the work item field definition. The reportable attribute can have the following values:
- Detail: A field tagged as Detail is moved into the relational warehouse but not into the OLAP cube.
- Dimension: Data for this field moves both to the relational warehouse and the OLAP cube as an attribute that can be used to filter data. A typical example would be State or Iteration.
- Measure: The Measure fields are available as aggregated values in the OLAP cube, for instance Remaining hours and Completed hours.
- None: Field is not available for reporting in the warehouse.
![]() Note Go back to Chapter 7 if you want to learn how to customize a work item definition and set the reporting properties.
Note Go back to Chapter 7 if you want to learn how to customize a work item definition and set the reporting properties.
As we saw in the previous section reporting data can come from primarily the following three sources:
- The Operational Store: The operational TFS database should not be used for reporting. This is just like most production databases because we do not want to impact the performance of the system with long-running reports. The exception here is reporting based on work item queries, where the data of course comes from the operational store.
- The Relational Warehouse (TFS_Warehouse): The relational warehouse is a SQL database that contains all the warehouse information. This database can be queried using SQL, which makes it more accessible for reporting.
- The SQL Server Analysis Services OLAP Cube (TFS_Analysis): The OLAP cube is a multidimensional database that aggregates data from the relational warehouse for more efficient reporting. This data store is ideal for trend analysis and well suited for use with Microsoft Excel.
Data in the warehouse is transformed from the operational store using a warehouse adapter. Because each tool in TFS typically has its own schema there is an adapter for each store that gets transformed into the relational warehouse.
![]() Note The warehouse adapter architecture is extensible. If you would like to get your custom data into the TFS warehouse (for instance code metrics or custom test results), you can create your own warehouse adapter to do so. It is outside the scope of this book to look at the details, instead have a look at http://msdn.microsoft.com/en-us/library/bb286956.aspx if you are interested in learning more.
Note The warehouse adapter architecture is extensible. If you would like to get your custom data into the TFS warehouse (for instance code metrics or custom test results), you can create your own warehouse adapter to do so. It is outside the scope of this book to look at the details, instead have a look at http://msdn.microsoft.com/en-us/library/bb286956.aspx if you are interested in learning more.
Relational Data Warehouse Data Models
The relational data warehouse contains the data transformed from the operational store and is available for us as data in different schemas. We have previously gone through the details on the relational data warehouse in each of the Metrics and ALM Assessment chapters:
- Chapter 9—Project management
- Chapter 19—Development practices
- Chapter 24—Testing practices
- Chapter 29—Release management
The OLAP cube contains aggregated data from the TFS data sources, which is great to use for trend analysis. It is easy to use Excel and the PivotTable and PivotChart to create reports that answer questions such as the number of bugs per tester per day in a sprint.
To use the cube for analysis in Excel or SQL Reporting we need to understand the structure of the data in Analysis Services. Figure 32-2 shows the fundamental structure of elements in an OLAP cube.
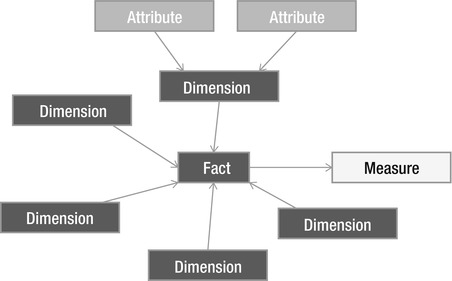
Figure 32-2. The structure of an OLAP cube
The cube consists of:
- Attributes: Attributes are connected to columns in a dimension.
- Dimensions: A dimension associates attributes to show aggregate results. You can use the dimension to show a trend or as a filter. The dimension can be shared among different fact tables (for instance Person or Date dimension are shared between fact tables).
- Fact: A fact is the data in the cube and can contain a large number of data rows. A row in a fact table contains either the value of a measure or a foreign key to a dimension.
- Measure: Measures are the values that represent columns in a fact table.
- Measure Group: A collection of measures tracked by the OLAP database.
- Perspective: A perspective is a selected part of the cube that can be used to make it easier to find the data for analysis.
The TFS OLAP cube consists of the following measure groups:
- Build: Contains metrics from the build process to help us get status reports, such as which builds failed and which succeeded, and trend reports, such as the build times over the past week.
- Code Churn: This measure group contains data from the version control system to get information, such as which files are changed most frequently or how much code has been changed in an area since the last release.
- Code Coverage: Metrics from code coverage during test runs to help us understand which code has the lowest code coverage or which test runs test the most code.
- Test: Various test metrics from test results and test runs that help us create reports, such as what is the test status for a particular PBI or how many tests are failing over time.
- Work Item: Data about work items in general that gives us answers to questions, such as what is the sprint burndown trend or how many PBIs were active in each sprint over the course of the project.
![]() Note The data warehouse is updated on a configured schedule. By default data is pulled from the operational store and written to the relational warehouse within two minutes. The SQL Server Analysis Service cube is then updated every two hours. You can change the refresh frequency by using the Warehouse Web Service as described on MSDN: http://msdn.microsoft.com/en-us/library/ms244694.aspx but do so cautiously because shortening the refresh time generates more load on the TFS server.
Note The data warehouse is updated on a configured schedule. By default data is pulled from the operational store and written to the relational warehouse within two minutes. The SQL Server Analysis Service cube is then updated every two hours. You can change the refresh frequency by using the Warehouse Web Service as described on MSDN: http://msdn.microsoft.com/en-us/library/ms244694.aspx but do so cautiously because shortening the refresh time generates more load on the TFS server.
Setting Up Access to Report Data
To create reports we need to have permission to query TFS and the TFS warehouse. This list shows what is required for the different tools.
- Work Item Queries: For this we only need regular access to TFS because we are going over the standard TFS services to get data.
- Excel OLAP reports: To use Excel to do OLAP reports we need access to the Analysis Services warehouse.
- SQL Server Report Builder and Report Designer: For these reports we need access to the relational warehouse database or the Analysis Services cube.
Setting Up Access to the Relational Warehouse
To get access to the relational warehouse to create reports we need to be added to the TfsWarehouseDataReader security role in the Tfs_Warehouse database. To setup access follow these steps:
- 1. Start SQL Server Management Studio and connect to the Tfs_Warehouse relational database.
- 2. Use the Object Explorer and drill down to the Roles and open the TfsWarehouseDataReader properties.
- 3. Add the user (Dave in this example) to the TfsWarehouseDataReader role (see Figure 32-3). The user needs to have a login account to SQL Server and be added to the users of the database or else we cannot select the user in the role members dialog.
Figure 32-3. Grant access to relational warehouse database
Setting Up Access to the Analysis Services Cube
Setting up access to the Analysis Services cube is similar to setting up access to the relational warehouse, this time we need to be in the TfsWarehouseDataReader role
- Start SQL Server Management Studio and connect to the Analysis Services.
- Use the Object Explorer and drill down to the Roles in the Tfs_Analysis database and open the TfsWarehouseDataReader properties.
- Add the user (Dave in this example) to the TfsWarehouseDataReader role (see Figure 32-4).
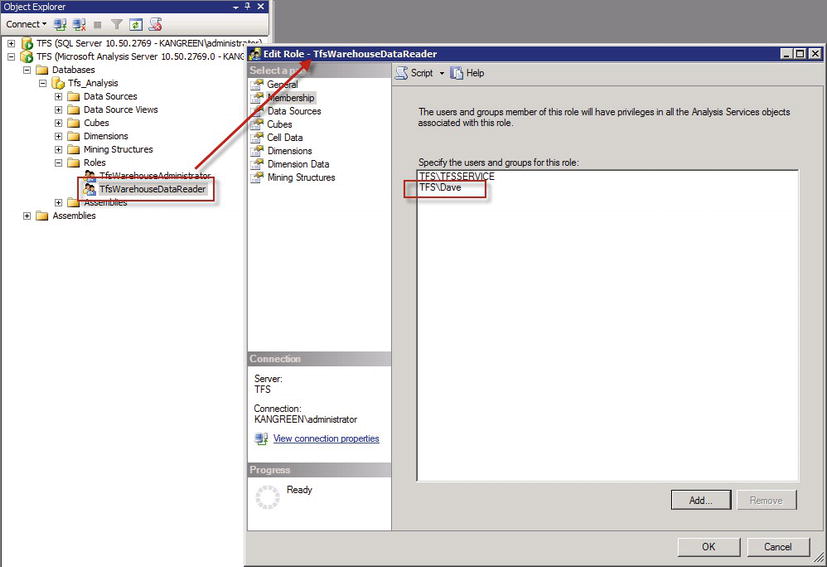
Figure 32-4. Grant access to the analysis services database
Monitoring the TFS Data Warehouse
The reporting system depends on a number of components working correctly together. The data that the warehouse adapters expect needs to be well-formed to be processed. Occasionally things will happen that make the warehouse stop updating. The most common reason to problems in the warehouse transformation is conflicts in work item fields between projects. When that happens, fields without problems will still be processed but the ones in conflict will not get updated in the warehouse until the problem has been resolved. To help troubleshoot warehouse problems we recommend the following resources:
- Resolving Schema Conflicts That Are Occurring in the Data Warehouse, http://msdn.microsoft.com/en-us/library/ee921480.
- Administrative Report Pack for Team Foundation Server 2010, http://blogs.msdn.com/b/granth/archive/2010/07/12/administrative-report-pack-for-team-foundation-server-2010.aspx.
Creating Reports
Data from the TFS can be extracted in many ways but unfortunately there is no best way to do this, instead we should try to find the best tool for what we want to achieve. The following list is the tools we have available for creating reports;
- Work Item Queries: Work item queries are simple to create but still a great way to generate real-time reports based on work item data.
- Excel Agile Workbooks: Excel workbook was introduced with TFS 2010 and is a great example on how we can use an Excel workbook as a shared source of reports, typically something that users in a specific role would use to get their follow-up be consistent. The specifics in the Agile workbooks include reports for backlog and iteration planning, something that has become partly superfluous with the new agile Web Access.
- Web Access Reports: The new Web Access features some nice reports on velocity and sprint burndown (as discussed in chapter 8 on agile reporting) on the team’s home page. We can add custom tiles to the Web Access page for other reports but we have to do that as a custom implementation.
- Excel Reports: Excel is a great tool in general for working with work item queries and the analysis capabilities and the possibility to hook up to the data warehouse cube makes it really powerful for ad-hoc as well as trend analysis.
- Create Reports in Microsoft Excel: This is a built-in feature in the Excel TFS add-in that we can use to quickly generate reports from a flat list work item query.
- SQL Server Report Builder: Excel is a great tool but of course it requires the user to have Excel installed to view the reports. If we want really accessible reports, we need to move to SQL Server Reporting Services and create custom reports. The SQL Server Report Builder is the first step to Reporting Services and gives the end-user the power to create powerful reports without knowledge of a development tool. It has its limitations but it’s a great start.
- SQL Server Report Designer: The final option is the full-fledged solution for advanced reporting. To create reports using the Report Designer, we use Visual Studio and the Business Intelligence Studio (BIDS) to design the reports. With BIDS we get precision control over the layout as well as the data sources, which allows us to merge data from all of TFS in a report.
The next question to ask about reporting is which data source should we use for creating the reports? Table 32-1 shows the combination of tools and data sources.
Table 32-1. TFS Reporting Tools with Relationship to Data Sources
| Reporting Tool | Work Item Query | Relational Warehouse | OLAP Cube |
|---|---|---|---|
| Excel | Yes | Yes | Yes |
| Report Builder | No | Yes | Yes |
| Report Designer | No | Yes | Yes |
Let’s now take a look at the different tools and see how we use them to create our custom reports.
Work item queries might be simple but they are still very powerful as a quick way of getting to live information about project activities.
Using work item queries in Excel is great for things such as
- Managing the product backlog
- Getting a list of open bugs
- Analyzing relationships between work items
Here are a couple examples. The first is an example on a basic product backlog report in Excel. Select the work item query.
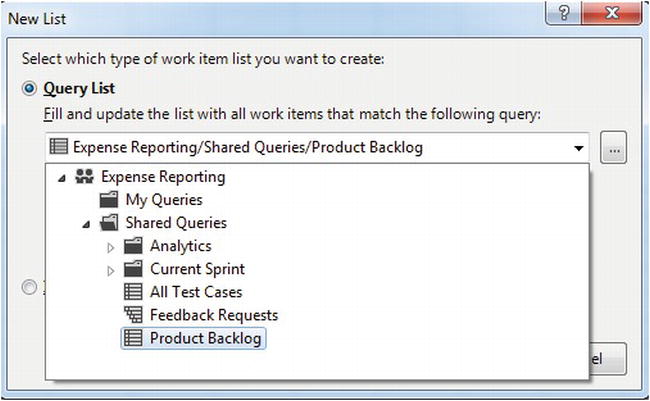
Figure 32-5. Opening a work item query in Excel
Next, add columns as needed and use Excel to filter data in the report.
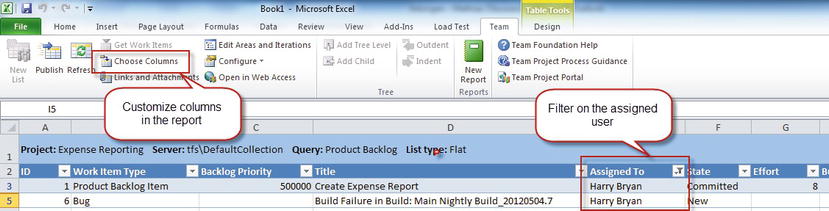
Figure 32-6. TFS reporting in Excel
Another example is a report of closed product backlog items without test cases. This report can be created using a link query such as the following:
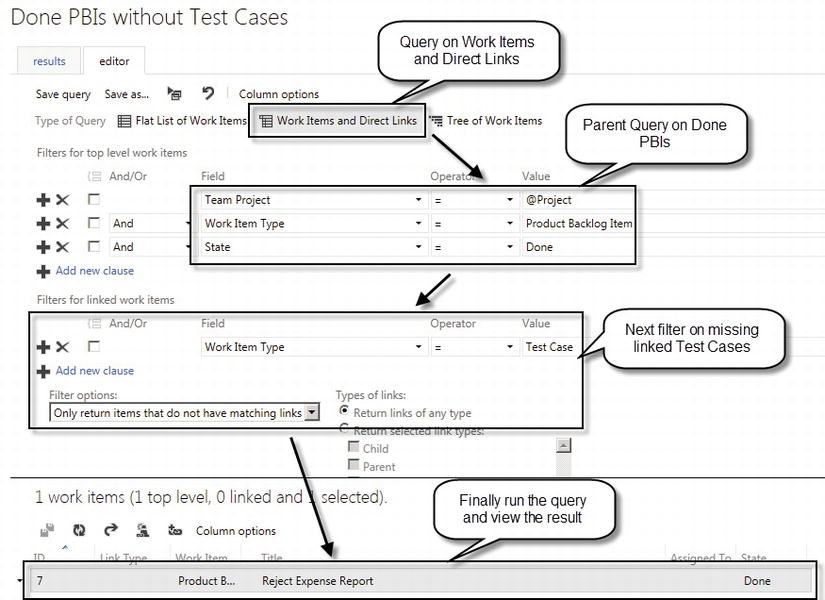
Figure 32-7. Reporting over links using a work item query in TFS Web Access
But this is about as detailed we get with work item queries. If we need more details or other TFS data, we need to move up in the tool chain.
Excel reports against the OLAP cube are easy to create once you get a grip on the data in the cube. A great thing with Excel is that it is the best tool to play with the cube to get familiar with the data. So what would be better than to show an example on how to do this then? Let’s create a build status report!
- Open Excel and use the Data tab to connect to the TFS Analysis Service database (see Figure 32-8).
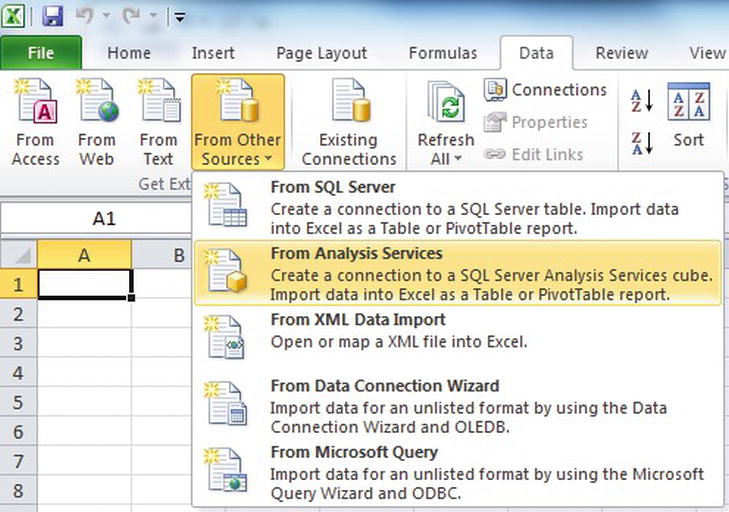
Figure 32-8. Connecting Excel to Analysis Services
- Enter the credentials as needed; we use Dave here as he was added as a TfsWarehouseDataReader previously (see Figure 32-9).
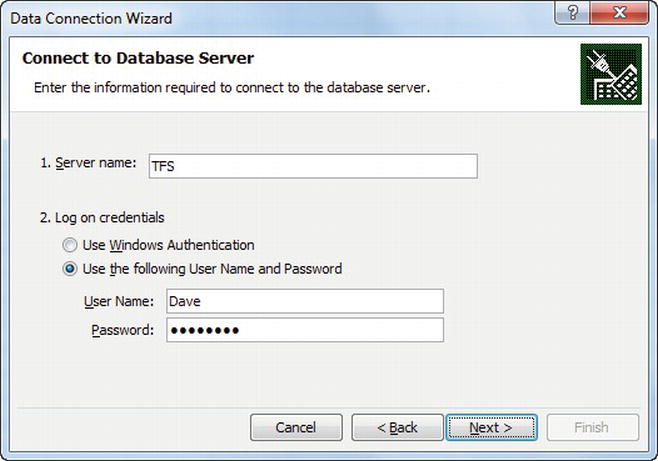
Figure 32-9. Connecting Excel to Analysis Services, authentication
- Select the Cube or Perspective to report on. We need a little of several, so let’s go for the whole Team System cube (see Figure 32-10).
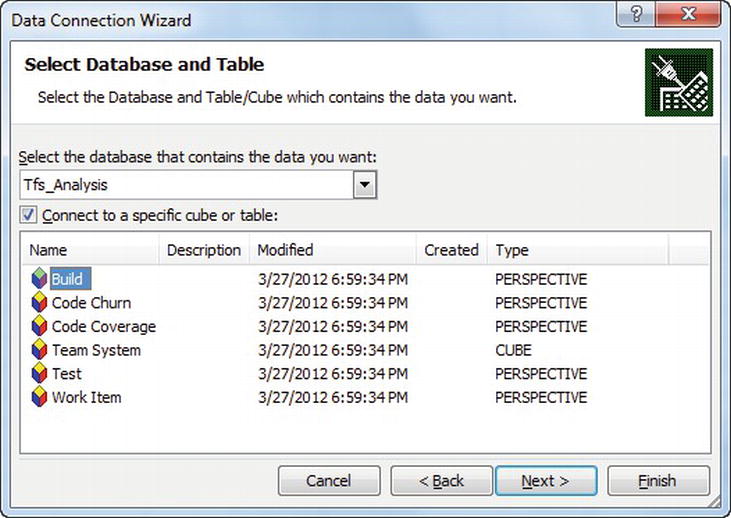
Figure 32-10. Connecting Excel to Analysis Services, selecting database and cube for analysis
- Next we can create a pivot table and a pivot chart. We want to create both in this case (see Figure 32-11).
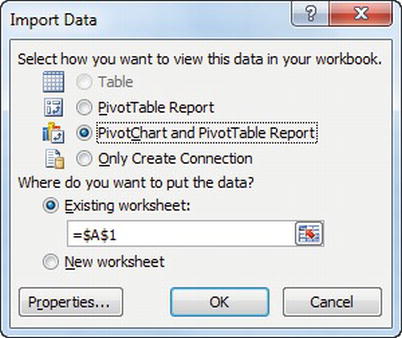
Figure 32-11. Connecting Excel to Analysis Services, selecting how to view the data
- Now we can start adding fields to the report by adding fields from the Field List to the four areas of the report (see Figure 32-12).

Figure 32-12. Working with Excel and Analysis Services, adding fields
- By adding Project Path, Year-Week-Date, and Build Flavor to the report filters, the Build Status to the Legend Fields, the Date to the Axis Fields, and the Build Details Count to the Values and we get the graph in Figure 32-13. And, yes, you can filter directly in the graph to customize the report content!
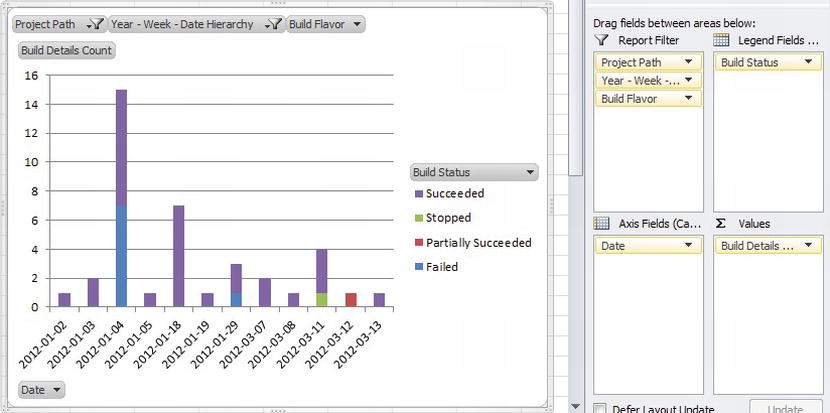
Figure 32-13. Working with Excel and Analysis Services, complete PivotChart
- If you are happy with the result (of course you should be), save the Excel spreadsheet in a central location to make it accessible by others (the teams’ SharePoint site would be a great place). The users of the report need to have access to the TFS warehouse to run the data access queries.
The SQL Server Report Builder is a report authoring tool targeted for business users. It is similar to the way we created a report in Excel against the Analysis Services OLAP cube but the end result will be a native SQL Server report that can be accessed by anyone in the team without installing Excel or having personal access to the reporting data.
To show how the Report Builder works, we will again create a Build status report.
- Download and install the SQL Server Report Builder 3.0 from http://www.microsoft.com/en-us/download/details.aspx?id=6116.
- Start the Report Builder and create a new report using the Table or Matrix Wizard.
- Choose to create a new dataset using SQL Server Analysis Services, connecting to your server hosting TFS analysis services database (see Figure 32-14).
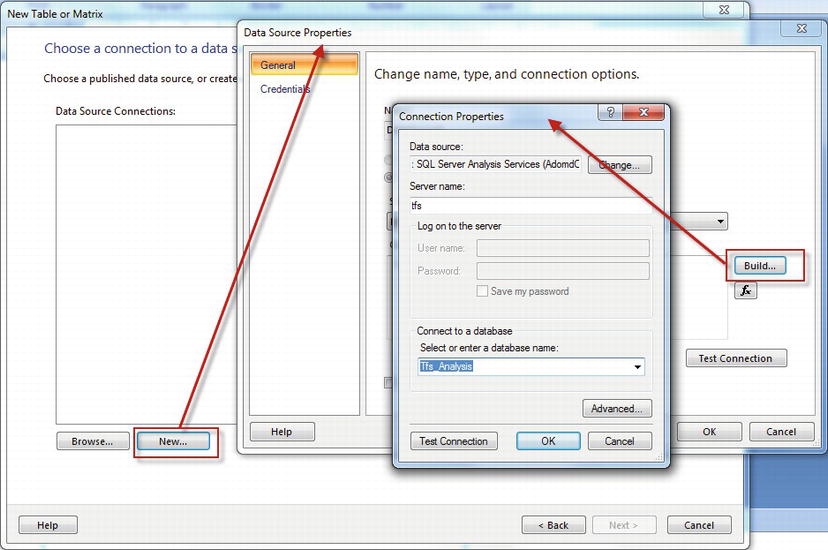
Figure 32-14. Working with Report Builds, connecting to a data source
- Design a query using the OLAP cube. Add the Build Details Count measure, the Build Status the Date dimensions to the result pane. Add the Team Project Path hierarchy to the filter pane and filter on the Expense Reporting project. Add the Date Week-Month-Date hierarchy to the filter pane and filter on the date range from January to June (see Figure 32-15).
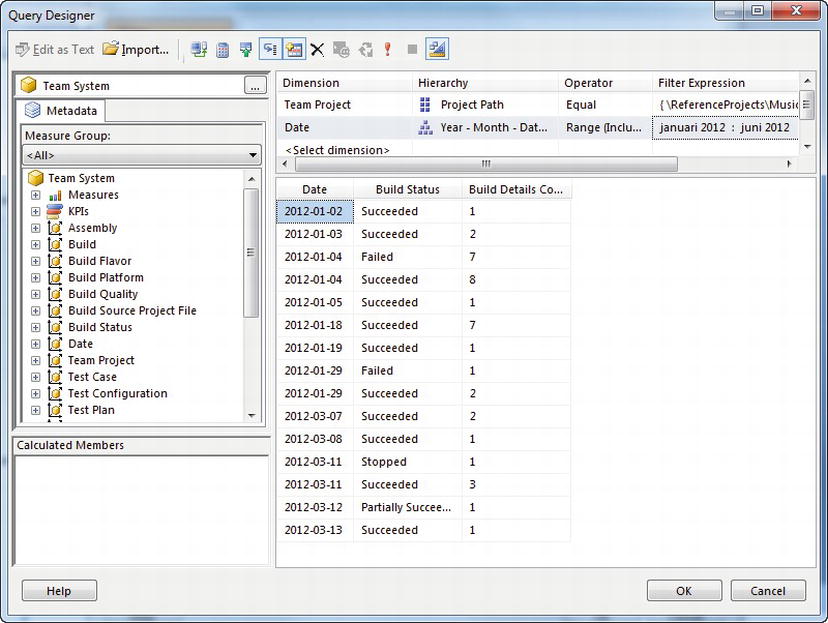
Figure 32-15. Working with Report Builds, adding data fields
- Add the count field to the detail pane in the wizard and complete the process. Remove the resulting table and insert a chart using the Chart Wizard. Select the newly created dataset, add a Column chart, add the Date field to the Categories, add the Build Details Count to the Values, and the Build Status to the Series (see Figure 32-16).
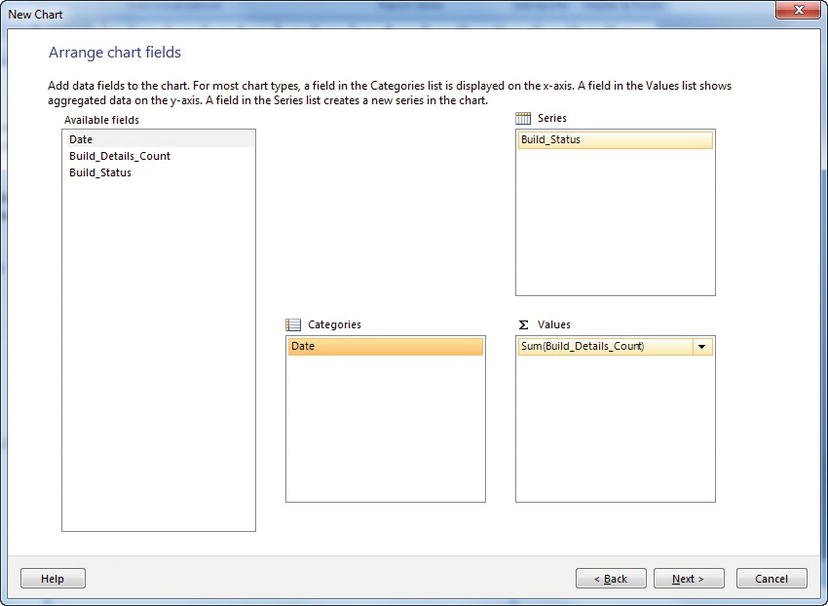
Figure 32-16. Working with Report Builds, mapping fields to areas
- Finish the wizard and cleanup the generated layout. Press the Run button to preview the report (see Figure 32-17).
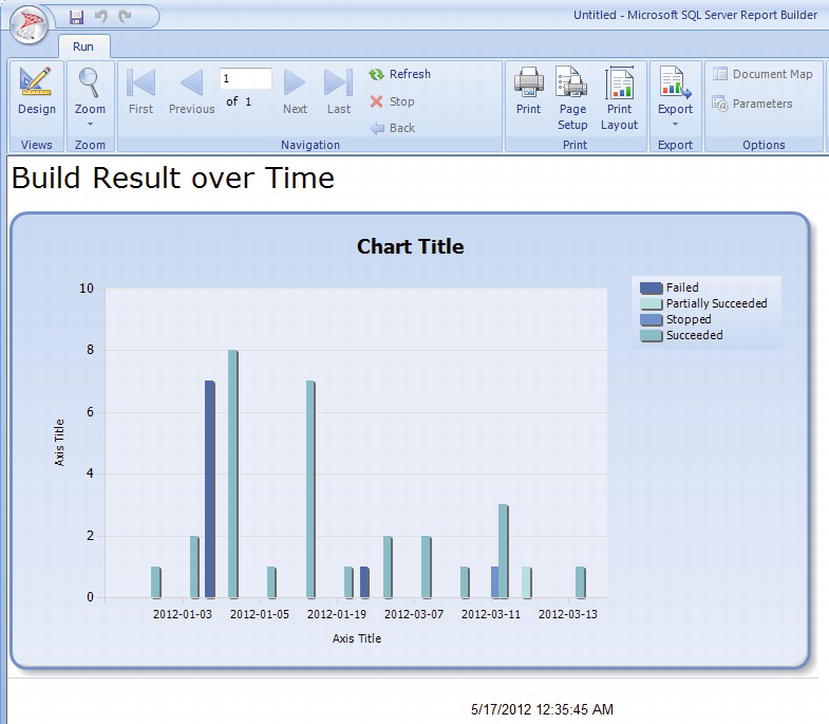
Figure 32-17. Working with Report Builds, the complete report
- Save the report. The resulting file can now be published to the Reporting Service portal.
The ultimate solution to TFS reporting is to use the SQL Server Report Designer to develop custom reports. With the SQL Server Report Designer we can create advanced logic behind the reports such as creating any number of data sets for the reports or use custom .NET code to transform the data to fit the report. The same principles as for the earlier tools apply but with the Report Designer we need to be familiar with development using Visual Studio as well.
To get you started with custom SQL Server report we will create a build status report from scratch and deploy it to the TFS SQL Server Reporting Services portal.
- To create a custom report we first need to install the SQL Server Business Intelligence Studio (part of SQL Server) and create a Report Server Project (see Figure 32-18). Name the project TFS Reports; typically you will have one project for all your custom TFS reports.
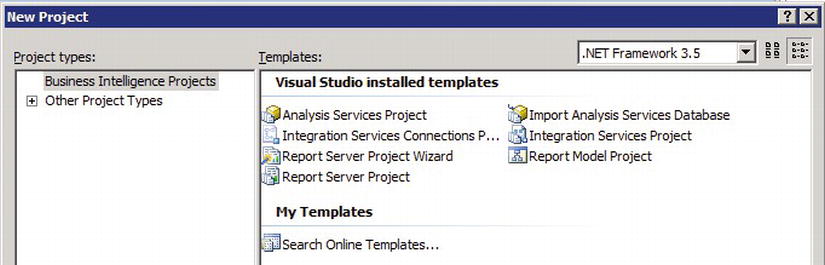
Figure 32-18. New Business Intelligence project for reporting
- Next we need to set up the data sources for the report. By using a Shared Data Source we can share the report data sources between reports in TFS. By default TFS adds the following data sources:
- a. TFS2010ReportDS. Data source connected to the relational warehouse database.
- b. TFSOlapReportDS. Data source for the Analysis Services database.
By reusing these names, our report will be easy to install later and will not need any custom database, which will make it easier to maintain the reports. Of course, if you need to get to other data you will create a data source specific for that purpose.
In the General tab, name the data source and set up the connection. We will connect to the Analysis Services cube to get the data for this report (see Figure 32-19).
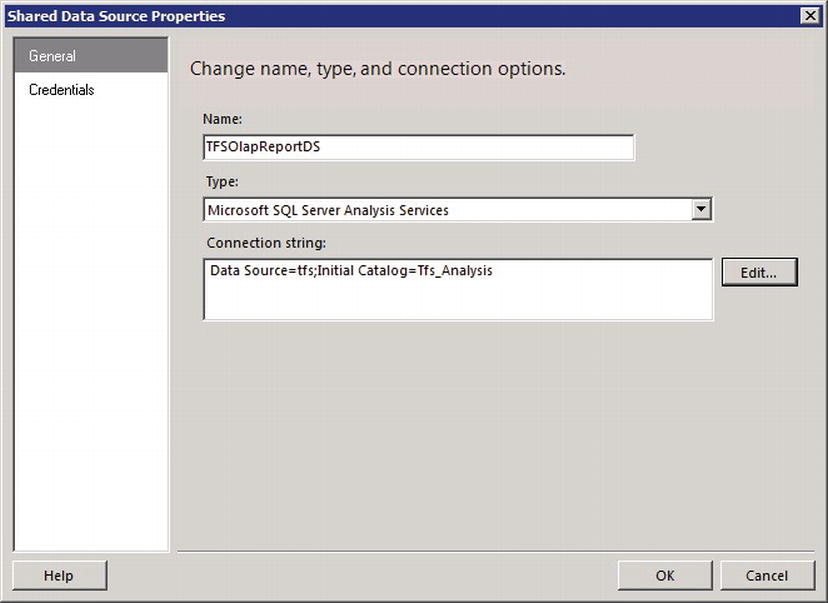
Figure 32-19. Creating a reporting services report data source
- Next we can add a new report to the project. The Report Wizard walks you through the process of setting up the initial report parameters (see Figure 32-20).
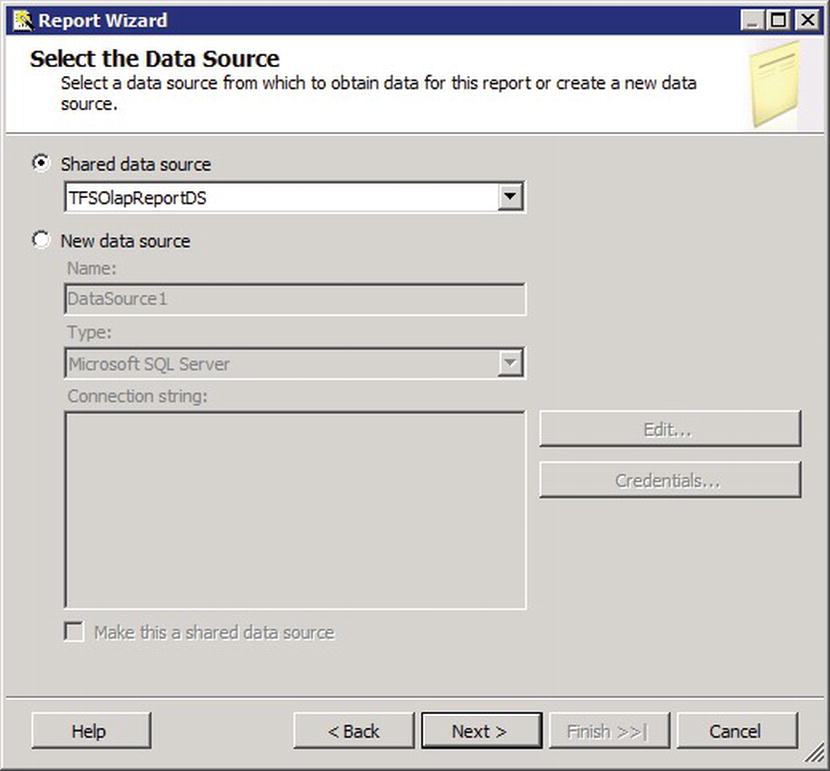
Figure 32-20. Creating a new reporting services report, select data source
- Next we use the Query Builder to select which data is fetched for the report. This is very similar to the steps we previously saw when creating a report using the Report Builder. Add the Build Details Count measure, the Build Status and the Date dimensions to the result pane. Add the Team Project Path hierarchy to the filter pane and filter on the Expense Reporting project. Add the Date Week-Month-Date hierarchy to the filter pane and filter on the date range from January to June (see Figure 32-21).
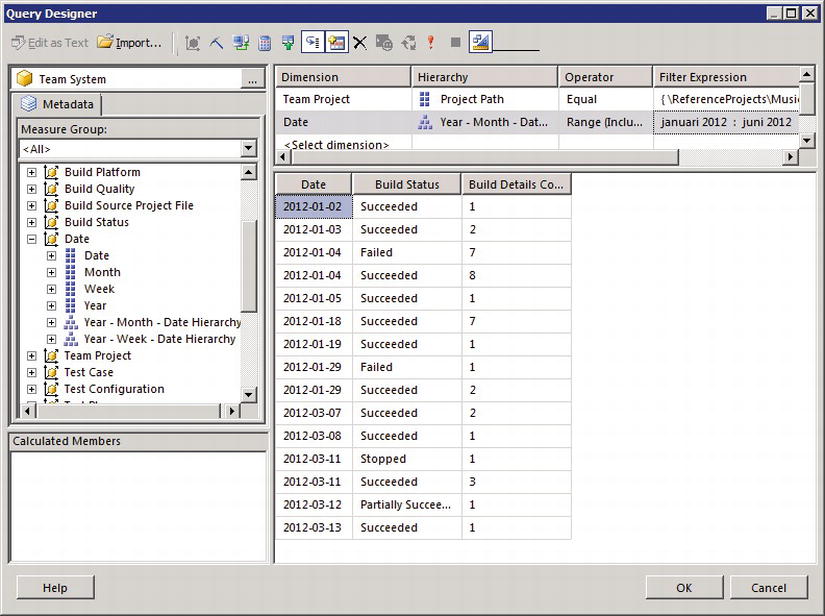
Figure 32-21. Creating a new reporting services report, query designer
- Finish the wizard. We want to create a chart for this report so the table created is not of any interest to us this time.
- Clean up the report area, remove the report table and make some room for the chart. Use the toolbox to add a stacked bar chart to the report. Map the data fields to the chart by adding the Date field to the Categories, the Build Details Count to the Values, and the Build Status to the Series (see Figure 32-22).
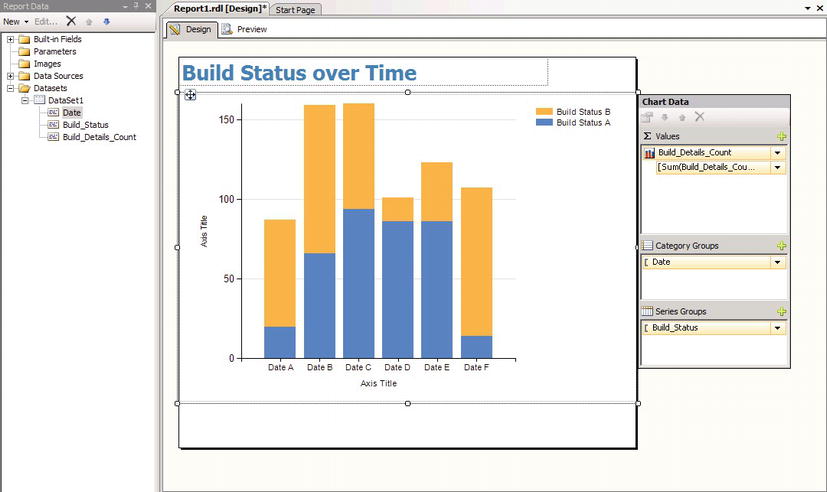
Figure 32-22. Creating a new reporting services report, adding a chart
- Use the Preview function to test the report during development. As long as the data sources are connected correctly you will get live data in the review mode.
- Save the report and you are ready to deploy it to the Reporting Services portal for use by your team!
Deploy a SQL Server Report in Reporting Services
To deploy a report in Reporting Services we simply need to upload the report.rdl to the Reporting Service portal and configure the report parameters as required by the report.
Navigate to the Reporting Services portal and to the project where you want add the report.
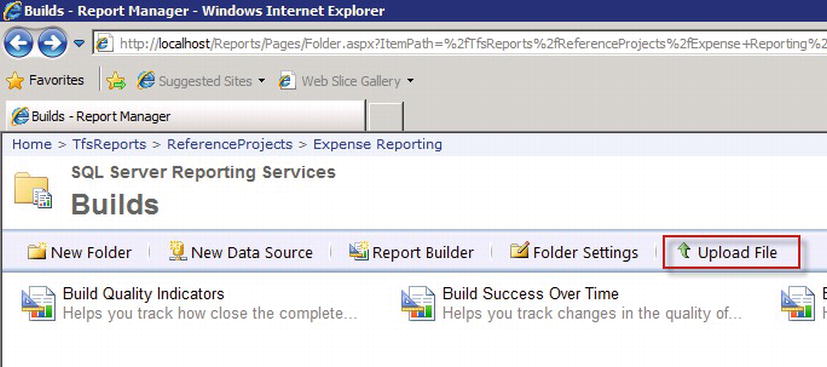
Figure 32-23. Uploading a reporting services report to the report portal
Next upload the file. The report now needs to be configured with the appropriate data source mapping and parameter. Open the report properties and finish the configuration, for instance selecting the data source as in Figure 32-24.
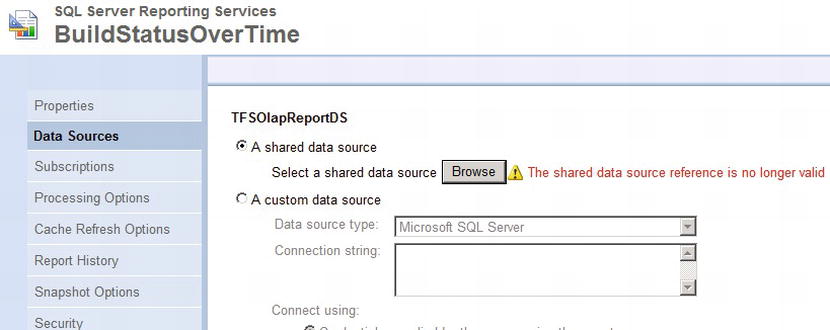
Figure 32-24. Configuring a Reporting Services report
After the report has been configured we can run the report and verify that it works as expected (see Figure 32-25).
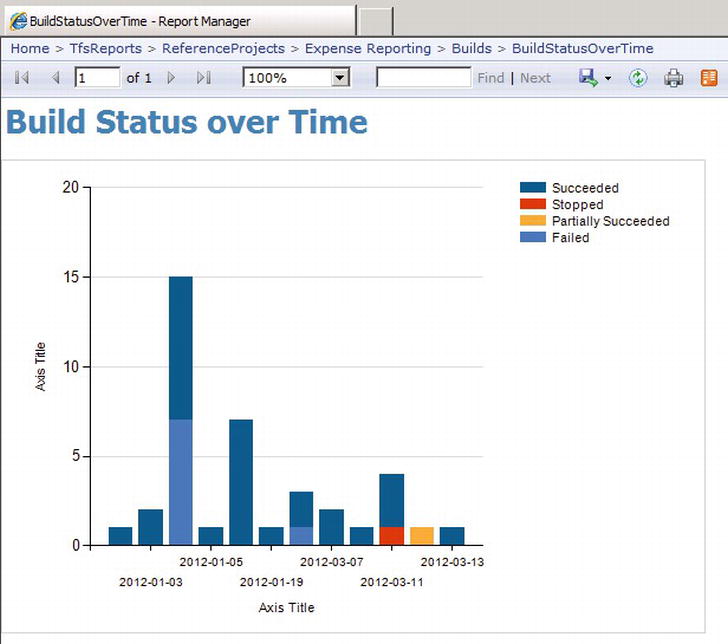
Figure 32-25. Running a Reporting Services report
Those were the fundamental steps for creating a SQL Server Reporting Service report. Of course we can do many other things with these reports, including creating nested reports, adding parameters, and so on, but from a TFS data warehouse perspective this is what you need to get started.
Summary
Getting information about the project status is critical to most projects. By defining the metrics for analysis early we can make sure in the end we can also get the reports.
In this chapter we looked at the reporting capabilities in TFS and saw that we have a range of options for generating reports. We can use work item queries to quickly extract the current state of activities. That same list can then be loaded into Excel and turned into advanced, appealing reports using the graphing and pivoting capabilities in Excel. We can also use Excel to create trend reports from the TFS data warehouse. For more advanced scenarios we can use SQL Server Reporting Services and create the reports for detailed analysis or reports that collect data from multiple sources. We have additional features in the SQL Server Reporting Services, such as permission control and automatic scheduling of reporting.