
![]()
Using Architecture Explorer
Developers often find themselves having to fix bug or perform maintenance on an application that they have never been involved with before. This situation offers many challenges. For instance, the developer must understand the code. This can be tough if there is no documentation available or if there are no good automated tests for the application.
Similar problems also face developers who join a new project and need to get up to speed with development. Or perhaps applications have grown out of control over time and the developers not longer recognize what the solution and its dependencies look like.
To ease these pains, Microsoft has introduced Architecture Explorer, which visualizes our solution and the artifacts and dependencies it contains. By artifacts, we mean the classical code artifacts such as classes, interfaces, and so on, as well as whole assemblies, files, and namespaces. Architecture Explorer lets us select those artifacts, display graphs with dependencies, and even navigate along those dependencies and in and out of detail levels.
This chapter will show you the basics of using Architecture explorer. We suggest that you explore it yourself if you really want to experience the real power of it. http://msdn.microsoft.com/en-us/library/dd409453(v=vs.110).aspx is a great start for learning Architecture Explorer in depth.
Architecture Explorer
Visual Studio can help us visualize and understand an existing application or system. Using Architecture Explorer, we can see how our code is organized, what the relationships in the code look like, and how the code behaves. These are valuable for anybody who needs to quickly understand the code base and how changes to the code will affect the application. This will help us estimate how much work a change will require and also how much risk this brings.
Using dependency graphs, which we generate using Architecture Explorer, we can see patterns and relationships in the code. Let us take a look at these graphs and see a little bit of what they can do for us.
Dependency graphs are simply files in Directed Graph Markup Language (DGML), which is an XML-based file format for directed graphs (http://en.wikipedia.org/wiki/Directed_graph). This means that they can be produced using any other DGML tool and then be displayed in VS.
Dependency Graphs
To visualize code and its relationships, you can create dependency graphs (see Figure 12-1) for source code or compiled code in Visual Studio Ultimate in several ways Architecture Explorer

Figure 12-1. A sample dependency graph
- From the Architecture menu, choose “Generate dependency graph”. This will show an overview of the solution.
- Select items in Architecture Explorer, and on the toolbar choose create a new graph document. This shows the specific code areas that you select. If you instead choose new dependency graph with ancestors, you will see the items’ parent containers.
- You can also drag items from Solution Explorer or Architecture Explorer to an existing dependency graph. If you use CTRL while dragging, you will include the items’ parent container.
You can create dependency graphs for the following types of projects and files:
- Visual C# .NET and Visual Basic .NET source code and compiled code, such as .NET assembly (.dll) files and executable (.exe) files
- Visual C and Visual C++ source code, header (.h or #include) files, and binary files (managed or native),but this requires the Visual Studio 2010 Visualization and Modeling Feature Pack (http://msdn.microsoft.com/en-us/library/dd460723.aspx).
Let us take a look at what dependency graphs can give us. In a dependency graph, items are represented as nodes and their relationships as links. Containment relationships between items are represented by groups,
which are nodes that contain other nodes. Groups can be expanded or collapsed to show or hide their contents. For example, when you generate a dependency graph from the Architecture menu, containment relationships are displayed as groups (Figure 12-2).
Figure 12-2. Groups (Containment relationship) in dependency graphs
You can also choose to display containment relationships as links (Figure 12-3). On the shortcut menu of the graph, choose group, and then turn off grouping.
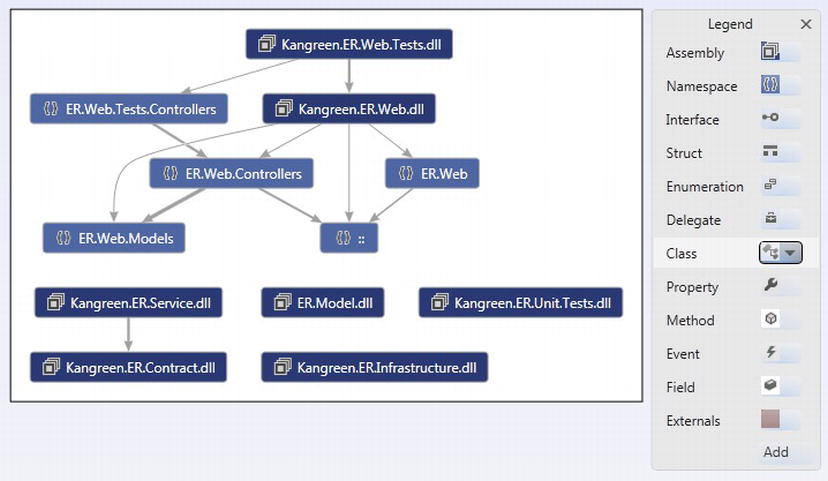
Figure 12-3. Containment relationships as links
Identifying Complex Code
You can run different analyzers on your dependency graphs in Visual Studio to help you identify code that might be too complex or that might need improvement.
To get started:
Make sure the graph layout is set to tree layout or quick clusters layout. Select a task ,and on the graph toolbar choose the tree layout, which will show the nodes in a tree structure. The graph arranges the nodes so that most of the dependencies will flow in one of the following directions:
- Left to right
- Right to left
- Top to bottom
- Bottom to top
Check that the legend box is visible. If it is not, open the shortcut menu for the diagram from where you select show legend. In the legend box, choose add, choose analyzers, and then choose one of the following:
- Circular reference, which will identify nodes that have circular dependencies on one another
- Find hubs, which will identify nodes that are in the top 25 percent of highly connected nodes
- Unreferenced nodes, which will identify nodes that have no references from any other nodes.
Using these analyzers, we can see if we have loops or circular dependencies so that we can simplify them or maybe break the cycles. We can also see if we have too many dependencies, which could be a sign that they are performing too many functions. To make the code easier to maintain, test, change ,and maybe re-use, we need consider refactoring these code areas to make them more defined. Maybe we can also find code that performs similar functionality and merge with this. If the code has no dependencies, we should consider if we need to keep it at all. If no one is using that part of the code, maybe it isn’t necessary.
![]() Note When you generate a dependency graph for the first time, Visual Studio creates a code index for all the dependencies that it finds. Though this process might take some time, especially for large solutions or graphs that have many links, this index helps improve the performance of subsequent operations. If the code changes later, only the affected code is re-indexed. See http://msdn.microsoft.com/en-us/library/dd409453(v=vs.110).aspx for more information.
Note When you generate a dependency graph for the first time, Visual Studio creates a code index for all the dependencies that it finds. Though this process might take some time, especially for large solutions or graphs that have many links, this index helps improve the performance of subsequent operations. If the code changes later, only the affected code is re-indexed. See http://msdn.microsoft.com/en-us/library/dd409453(v=vs.110).aspx for more information.
Analyze and Explore Code Using Architecture Explorer
We can use Architecture Explorer in many situations, not only when we need to understand unfamiliar applications or systems. In some projects, the development team has lost control over the code. It has grown out of control and it is hard to follow the structure and the dependencies. It might even be hard to understand what the code really does. Especially if the team does not use any XP practices—such as like test-driven development, automated unit tests, continuous integration, continuous build, and so on—it is easy to lose control.
We can use Architecture Explorer to browse and find source code in many Visual Studio projects and also in compiled code such as executables, assembly files, and binary files. In combination with dependency graphs, we can more easily get back control of our code.
To understand how we can use Architecture Explorer, let’s see what it looks like. On the Architecture menu, point to Windows, and then click Architecture Explorer. Open a solution (or compiled code), and the view we see in Figure 12-4 will appear.
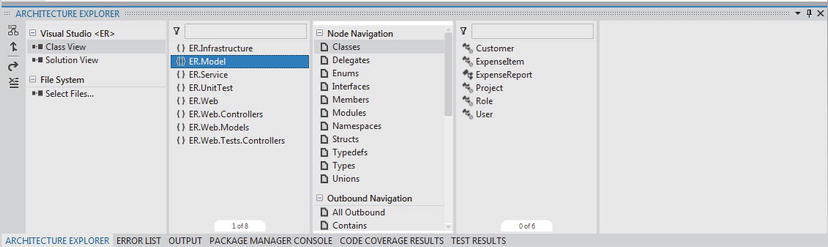
Figure 12-4. Architecture Explorer
In Architecture Explorer, structures are represented as nodes and relationships as links. Architecture Explorer displays nodes in new columns as we continue browsing. The first column shows the domains and views that we can browse among, and when we select a domain and a view, the available nodes in that view appear.
When a node is selected in a column, the next column will show the nodes that are (logically) related to that selection. An easy example is selecting namespaces. Doing this will show types in the next column (Figure 12-4). If we select a type, we will see its members in the next column.
The collapsed action column that appears along the right side of a node column identifies the default types or relationships of the nodes that the next column contains. We can filter the results of the next column by expanding the action column and selecting specific types of nodes or links.
How do we find source code in Architecture Explorer? We can use either of two views:
- Class View, which shows the logical view of a Visual Studio solution. We can browse by namespace, classes, members, and so on. (Figure 12-5)
- Solution View, which shows the physical view of a Visual Studio solution. We can browse by project, project files, and so on. (Figure 12-6)
We can use these views to browse source code down to the level of expressions.

Figure 12-5. Class view in Architecture Explorer

Figure 12-6. Solution view in Architecture Explorer
We can achieve the same result if we compile code that we want to investigate. The difference is that we do not open a Visual Studio solution; instead, we point Architecture Explorer to the compiled code by looking under file system, clicking select files, and selecting the file we want to look at.
Summary
This chapter has given an overview of Architecture Explorer and how it can help us. When we get our hands on an existing application or system (either source code/VS solution or compiled code), we can use Architecture Explorer to generate dependency graphs. These will visualize the code and its relationships so that we can understand the code more easily.
We can also use Architecture Explorer to find code by selecting different views (class view or solution view) of the code. In combination with dependency graphs, we can more easily get control of our code. Architecture explorer can be a powerful solution if we have no other way of understanding the code.
The next chapter looks at Layer diagrams, part of the architecture tools in Visual Studio Ultimate that are used to model the layers in a solution. Once the layers are defined, we can define the dependency structure between the layers and map code to the corresponding layer.