![]()
Code Quality
As developers we want to create code with as high quality as possible. But high quality often means lower development pace because we need to go through more checks on our code. But does it need to be a slow and burdensome process?
In this chapter we will examine several powerful tools we can use to get in control of our code quality. The static code analysis framework checks our code for code-level correctness, over and above the syntactical checks the compiler does. We can also use Code Metrics to get feedback on the quality of our code and help to identify areas that need attention, often this is driven from a maintainability perspective. A common problem with maintainability is code duplication. To help us mitigate that problem we can use the new clone detection tool in Visual Studio that will analyze code for similarities which we then can refactor to get a better structure. Finally, the traditional code review workflow has been given tool support in Visual Studio and TFS; with Visual Studio 2012 we can now have a tracked conversation about our code without leaving the development environment.
Code Analysis
First we will take a look at how to setup and manage static code analysis in Visual Studio. The code analysis tool is an evolution of the community tool FxCop, which in essence is a framework for automating code analysis. Static code analysis works by parsing the source code and matching it against a defined set of coding conventions or code analysis rules. A simple example is a naming rule that checks that identifiers are cased correctly. Figure 17-1 shows how a violation of this rule is shown in Visual Studio 2012.

Figure 17-1. Code analysis warning for incorrect identifier casing
The code analysis tool is intended to be used to complement manual code analysis, not replace it. The ambition should be to automate common static code analysis and use manual code review as group activities to share knowledge inside the team, to improve maintainability of the source code and so on.
The static code analysis tools in Visual Studio can be used with managed code as well as C/C++ code and is configured on a project per project basis.
It is recommended to create a baseline set of rules and share them between projects. This enforces usage of code analysis and makes sure everyone uses the same set of rules. To help us get started, Visual Studio comes with a set of predefined rule sets as listed in Table 17-1.
Table 17-1. Standard Code Analysis Rule Sets in Visual Studio 2012
| Rule Set | Purpose |
|---|---|
| All | This rule set contains all rules. Running this rule set may result in a large number of warnings being reported. Use this rule set to get a comprehensive picture of all issues in your code. This can help you decide which of the more focused rule sets are most appropriate to run for your projects. |
| Microsoft Basic Correctness | These rules focus on logic errors and common mistakes made in the usage of framework APIs. Include this rule set to expand on the list of warnings reported by the minimum recommended rules. |
| Microsoft Basic Design Guidelines | These rules focus on enforcing best practices to make your code easy to understand and use. Include this rule set if your project includes library code or if you want to enforce best practices for easily maintainable code. |
| Microsoft Extended Correctness | These rules expand on the basic correctness rules to maximize the logic and framework usage errors that are reported. Extra emphasis is placed on specific scenarios such as COM interop and mobile applications. Consider including this rule set if one of these scenarios applies to your project or to find additional problems in your project. |
| Microsoft Extended Design Guidelines | These rules expand on the basic design guideline rules to maximize the usability and maintainability issues that are reported. Extra emphasis is placed on naming guidelines. Consider including this rule set if your project includes library code or if you want to enforce the highest standards for writing maintainable code. |
| Microsoft Globalization | These rules focus on problems that prevent data in your application from displaying correctly when used in different languages, locales, and cultures. Include this rule set if your application is localized or globalized. |
| Microsoft Managed Minimum | These rules focus on the most critical problems in your code for which Code Analysis is the most accurate. These rules are small in number and they are intended only to run in limited Visual Studio editions. Use MinimumRecommendedRules.ruleset with other Visual Studio editions. |
| Microsoft Managed Recommended | These rules focus on the most critical problems in your code, including potential security holes, application crashes, and other important logic and design errors. You should include this rule set in any custom rule set you create for your projects. |
| Microsoft Mixed (C++/CLR) Minimum | These rules focus on the most critical problems in your C++ projects that support the Common Language Runtime, including potential security holes and application crashes. You should include this rule set in any custom rule set you create for your C++ projects that support the Common Language Runtime. |
| Microsoft Mixed (C++/CLR) Recommended | These rules focus on the most common and critical problems in your C++ projects that support the Common Language Runtime, including potential security holes, application crashes, and other important logic and design errors. You should include this rule set in any custom rule set you create for your C++ projects that support the Common Language Runtime. This ruleset is designed to be configured with the Visual Studio Professional edition and higher. |
| Native Minimum Rules rule set | These rules focus on the most critical problems in your native code, including potential security holes and application crashes. You should include this rule set in any custom rule set you create for your native projects. |
| Native Recommended Rules rule set | These rules focus on the most critical and common problems in your native code, including potential security holes and application crashes. You should include this rule set in any custom rule set you create for your native projects. This ruleset is designed to work with Visual Studio Professional edition and higher. |
| Microsoft Security Rules | This rule set contains all Microsoft security rules. Include this rule set to maximize the number of potential security issues that are reported. |
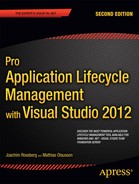
After we decide which rules apply to our code, we need to configure each project in the solution with the proper settings. We can assign the rule set on each project’s properties or on the solution level (see Figure 17-2).
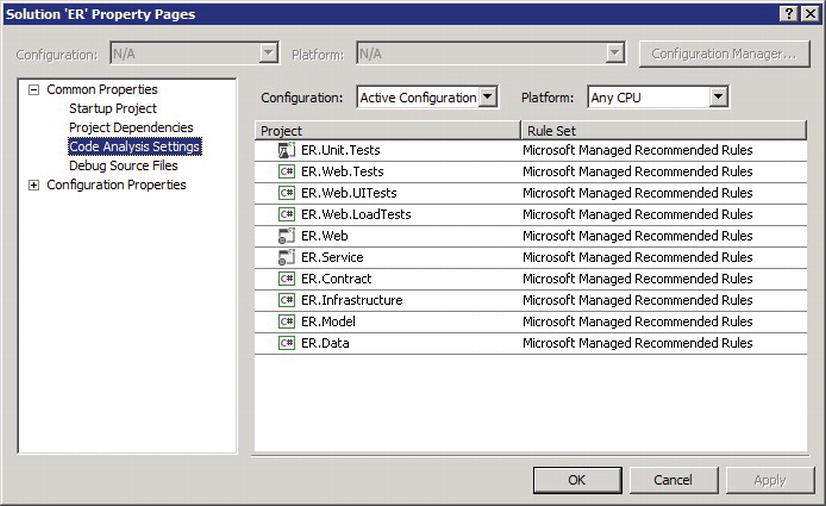
Figure 17-2. Configuring code analysis
Static code analysis is executed similar to a standard compilation of the code. When code analysis is enabled on build, the project will be analyzed after it has been compiled. To enable code analysis as part of the build process we set the Enable Code Analysis on Build flag on each project. We can always run the code analysis manually from the Analyze menu in Visual Studio (see Figure 17-3).

Figure 17-3. Enable Code Analysis on Build
![]() Note Running Code Analysis as part of the build slows down the development experience. As a compromise we recommend manually running code analysis while developing and then integrating it with the check-in and server build processes to ensure code analysis is run.
Note Running Code Analysis as part of the build slows down the development experience. As a compromise we recommend manually running code analysis while developing and then integrating it with the check-in and server build processes to ensure code analysis is run.
After the code analysis has been run any errors found are shown in the Code Analysis window (see Figure 17-4). From the list you can select the item, which shows the documentation of the analysis rule, examples of why it happens, and suggestions of what to do to resolve the issue.

Figure 17-4. Working with code analysis from the Code Analysis window
If you have rules that cannot be fulfilled, then in rare occasions you can choose to make suppression to the rules. In the Code Analysis window you will see the rule breaks as either global (no file and line reference) or local conditions. You can suppress the rule by just clicking on the Actions link on the item to suppress and select “Suppress Message.”
For global suppressions a separate file “GlobalSupressions.cs” is added to the project with the suppression to the rule added as an assembly level attribute. For local suppressions local attributes are added inline with the code as shown in Figure 17-5.
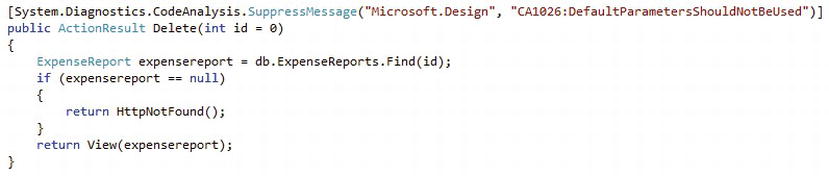
Figure 17-5. Supressing a code analysis error
Creating Custom Rule Sets
We have seen how we can use the predefined rule sets to quickly get started with code analysis. Sometimes we want to exclude certain rules or use rules from multiple standard rule sets. If this is the case then we can create a custom rule set, save it as a .ruleset file, and reference it from the projects it applies.
To create a new rule set from scratch we create a new Code Analysis Rule Set from the General file templates in Visual Studio (see Figure 17-6).

Figure 17-6. Adding a custom code analysis rule set
Next we select the rule groups that apply and can drill down and customize which rules should be applied as well as whether the rule should be treated as a warning or an error. Figure 17-7 shows an example of a custom code analysis rule set.
Figure 17-7. Configuring a custom code analysis rule set
Having defined the rule set, we can now apply it to the projects as Figure 17-8 shows.
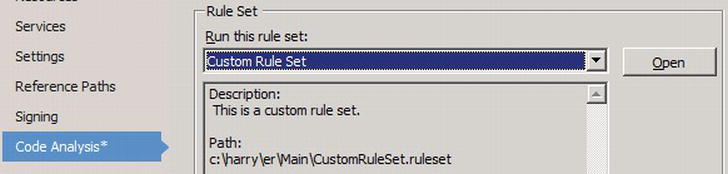
Figure 17-8. Using a custom code analysis rule set
We can also create a custom rule set from an existing set by opening the code analysis properties in a project and saving the resulting changes as a new .ruleset file.
It is also possible to customize the code analysis dictionary used to check identifiers in the code. If we have terms in our code that generate analysis errors or warnings, we can customize the dictionary instead of suppressing the validation.
Integrating Code Analysis with TFS Builds
Running code analysis as part of the local build can slow down the development experience. As a compromise we can use TFS server-side builds to validate the code. Enabling this in a default TFS build workflow is as easy as setting the Perform Code Analysis property as shown in Figure 17-9. The following are our choices:
- Never: Never run code analysis as part of the build.
- AsConfigured: Run code analysis according to each project’s setting.
- Always: Always run code analysis.
See Chapter 26 for more information on how to setup TFS builds.

Figure 17-9. Integrating code analysis with TFS build
A complement to running the code analysis as part of the build is to ensure we have run the code analysis before checking in the code (see Figure 17-10). If we want to do this, then we can just add the code analysis check-in policy to our TFS project. See Chapter 15 for more information on how to work with check-in policies.

Figure 17-10. Configuring the code analysis check-in policy
As our software evolves it is important to understand the complexity of the code. A common situation is that the older the code is, the harder it is to maintain. Often the reason for this is that it is easy to just add new features to existing code rather than refactor and redesign the solution. To avoid degraded code quality we can analyze the code and get a report on the code metrics. The code metrics we get from Visual Studio are the following:
- Lines of code is an approximate number based on IL code. A high count might indicate that a type or method is doing too much work and should be split up. This might also be a warning that code will be hard to maintain.
- Class coupling: measures the coupling to unique classes through parameters, local variables, return types, method calls, generic or template instantiations, base classes, interface implementations, fields defined on external types, and attribute decoration. Low coupling is better to strive for because high coupling indicates a design that is difficult to reuse and maintain because of its many interdependencies on other types.
- Depth of inheritance indicates the number of class definitions that extend to the root of the class hierarchy. The deeper the hierarchy the more difficult it might be to understand where particular methods and fields are defined or/and redefined.
- Cyclomatic complexity is created by calculating the number of different code paths in the flow of the program and shows the complexity of the code. A high complexity makes the maintainability suffer and it can also be hard to get good code coverage.
- Maintainability index is an index value between 0 and 100 that represents the relative ease of maintaining the code. A rating above 20 is considered good, below that maintainability suffers. It is however a very generous limit—a maintainability of 20 might seem okay, but in reality it is pretty horrible.
![]() Note An anonymous method is a method we can declare as a method without giving it a name and is typically used as delegate parameter. The metrics for the anonymous method is associated with the code declaring the method.
Note An anonymous method is a method we can declare as a method without giving it a name and is typically used as delegate parameter. The metrics for the anonymous method is associated with the code declaring the method.
Generated code is generally excluded from code metrics. You can customize this using .NET attributes to get a more realistic coverage number. The following post shows some good examples of how to do this: http://geekswithblogs.net/terje/archive/2008/11/10/hiding-generated-code-from-code-analysis-metrics-and-test-coverage.aspx.
To calculate the code metrics for our code we can do so on all or individual projects by selecting the solution or project. Next, we run the analysis from the Analyze menu in Visual Studio and then Calculate Code Metrics for Solution or project. When the analysis is complete the result is shown in the Code Metrics Results window (see Figure 17-11). We can analyze the result by filtering for behaviors we are interested in as well as do a drill-down into the code we want to understand better.

Figure 17-11. Code metrics summary
We can also export the result to Excel to do further analysis or just to save the result from the run as a way of documenting our code quality. If we find issues we want to address later, we can also create a work item from the result view.
![]() Note Currently code metrics is available in Visual Studio or as a command-line tool (http://www.microsoft.com/en-us/download/details.aspx?id=9422). If you want to include the code metrics in automated builds (which is a great idea by the way) you need to customize the build process and wrap the command-line tool. Chapter 26 covers build process customization. It also introduces the TFS Build Extensions, which is a community project for custom build activities, including one for code metrics.
Note Currently code metrics is available in Visual Studio or as a command-line tool (http://www.microsoft.com/en-us/download/details.aspx?id=9422). If you want to include the code metrics in automated builds (which is a great idea by the way) you need to customize the build process and wrap the command-line tool. Chapter 26 covers build process customization. It also introduces the TFS Build Extensions, which is a community project for custom build activities, including one for code metrics.
Have you ever worked on a piece of code and thought you’ve seen it before? Wished you had a tool that would show you where the same or similar code exists in your code base? Copy-paste is probably the most common (anti) design pattern used by programmers and though quick to use to solve a problem, it will likely degrade your product in the long run.
In Visual Studio 2012 we now have a code analysis tool for detecting code with similar structure. We can search for code clones in a couple of ways. We can choose to analyze the entire solution for clones by selecting Analyze Solution for code clones from the Analyze menu.
![]() Note Only code fragments >10 statements will be analyzed when running code clone detection on the entire solution.
Note Only code fragments >10 statements will be analyzed when running code clone detection on the entire solution.
We can also select a section of code and have the tool find matching code. Select a code snippet you want to analyze for clones and choose Find Matching Clones in Solution from the context menu (see Figure 17-12).

Figure 17-12. Detecting a cloned code section from selected code
The code clone analysis finds direct copies of code and also fragments that are similar but may differ in naming of variables or parameters.
The results are shown in the Code Clone Analysis Results window where we can analyze the detected clones. If we want to compare the differences we can select the original and the clone to compare. In the example in Figure 17-13 you can see how a Save method has been copied and the entity to save has been changed. The code structure is semantically the same, but as you can see the details are too different to find with a simple “find-in-files” match.

Figure 17-13. Analyzing code clones
It is recommended to run the code clone analysis whenever we change existing code. When we modify code we can first run the analysis to learn whether the code we are about to change exists in other areas as well. We can also use the result from the analysis to consider whether we should refactor the code to make it more maintainable.
Earlier we looked at how we can use static code analysis as a tool to help us create maintainable code that adheres to the development practices we have agreed on. But a tool is only a tool so if we want our software to be not only correct on the code level but also have a good design and structure we should perform code reviews as well.
There are many reasons why we would want to do a code review, for instance
- We are done with a feature and we want someone to review it before checking in.
- We find a changeset we do not understand and want someone to take a look at it.
- We notice a block of code we think is incorrect.
- We come across a brilliant solution in the code that we want to make others aware of.
Regardless of the reason, it should be easy to get the review done. A common reason to why code reviews get neglected is simply because we do not have good tool support for the process and therefore no common practice for how the review should be performed. In Visual Studio 2012 Code Review is built in to the platform which makes it very easy to use.
![]() Note The Code Review feature is only available in Visual Studio Premium and Visual Studio Ultimate.
Note The Code Review feature is only available in Visual Studio Premium and Visual Studio Ultimate.
A common way to initiate a code review in Visual Studio is to use the Team Explorer and request a review from the pending changes in My Work, for instance we want to run a code review before we checkin the code for a completed work item (see Figure 17-14).
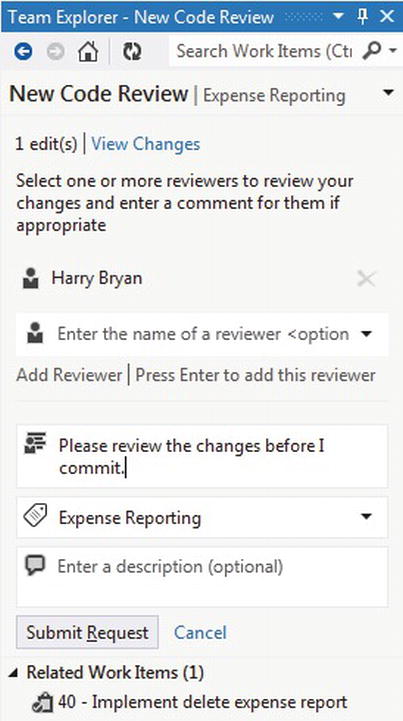
Figure 17-14. Initiating a code review session
We may also start a code review session from the source code history if we find a checkin that we want someone to take a look at as shown in Figure 17-15.
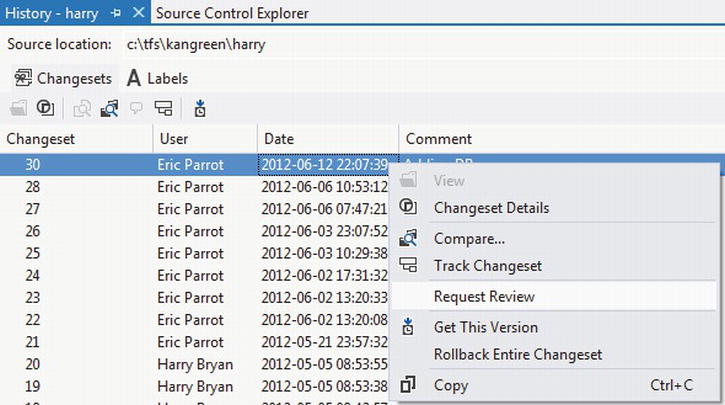
Figure 17-15. Initiating a code review from source control history
Next the reviewers receive the code review request. As a reviewer, we accept or decline the code review from the Incoming Review queue in Team Explorer (see Figure 17-16).
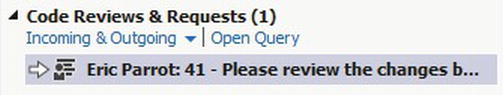
Figure 17-16. Code review incoming queue
Accepting to review takes us to the Code Review section where the details for the review session are outlined (see Figure 17-17). We can comment on the entire session as well as per file. We can even click on a file that opens up the file in the compare tool in Visual Studio. Here it is easy to review the changes made compared to the previous version. It is also possible to add review comments on code blocks by selecting a code section and add a comment.
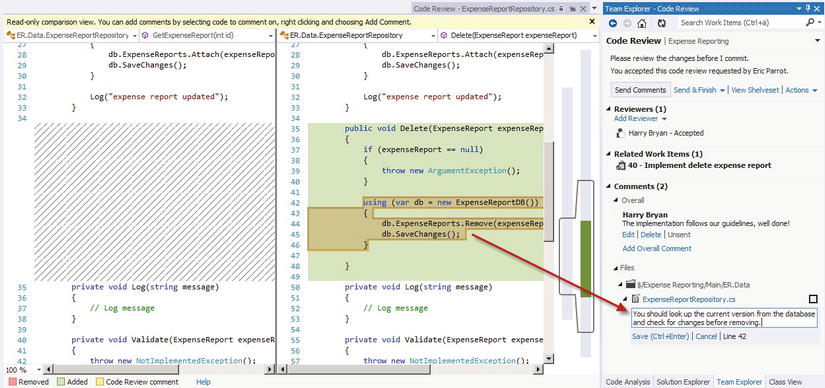
Figure 17-17. Responding to a code review
After the reviewers are done with the code review the person requesting the review can see that it has been completed (see Figure 17-18).

Figure 17-18. Code review completed
We can then open up the review request to look at the details. If there are outstanding questions we can Reply and enter a comment on either the review session as a whole or on each file and code block in the review session. We can also use the checkboxes to work through the review items and mark the comment as taken care of. Figure 17-19 shows the Team Explorer in Code Review mode.
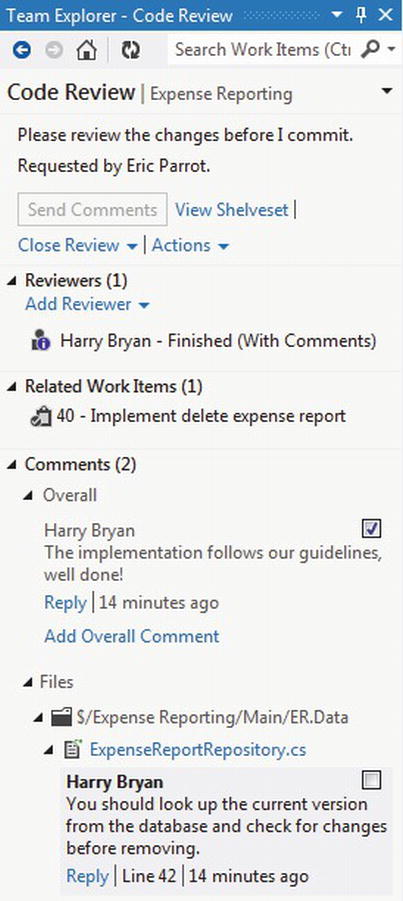
Figure 17-19. Reviewing a code review session
Summary
In this chapter we have looked at how we can use Visual Studio to improve code quality in a number of different ways. We can use code analysis and code metrics to understand how well our code is written. We can use code clone detection to find redundant code that we can refactor to make the code base more maintainable. Finally, we looked at how the new capabilities for code review workstreams can be used to automate the manual code review process.
Next we will take the code quality concept even further and look at how we can work with quality issues. First we need to know if and where we have a problem. The profiler in Visual Studio helps us understand how our system behaves when it is run and if we have any performance or memory issues we need to deal with. Finding the problems early during development is of course ideal, but often the problems are found during testing or in production. Troubleshooting in these environments are by nature more complex so we need good tools to help us work efficiently with the issues found. To help us out we can use IntelliTrace and Preemptive Analytics.