![]()
This is the final chapter in our assessment and metrics series. We will cover some metrics and reports for release management, including the build process.
Metrics
Much of the metrics we can get from TFS are presented as reports. Using these figures as KPIs we can easily compare our progress when it comes to build quality.
A quick look at Information Technology Infrastructure Library (ITIL) (http://www.itilnews.com/ITIL_v3_Suggested_Release_and_Deployment_KPIs.html) will give us some other KPIs we can use. If we want to use them we might need to create our own reports to automate the retrieval of this information. ITIL mentions among others these KPIs:
- Number of software defects in production, which is the number of bugs or software defects of applications (versions) that are in production
- Percentage of successful software upgrades (excludes full installations)
- Number of untested releases (i.e., not tested and signed-off)
- Number of urgent releases
- Average costs of release, where costs most likely are based on man-hours spent
![]() Note The Information Technology Infrastructure Library (ITIL), is a set of practices for IT service management (ITSM) that focuses on aligning IT services with the needs of business. ITIL describes procedures, tasks, and checklists that are not organization-specific, used by an organization for establishing a minimum level of competency. It allows the organization to establish a baseline from which it can plan, implement, and measure. It is used to demonstrate compliance and to measure improvement.
Note The Information Technology Infrastructure Library (ITIL), is a set of practices for IT service management (ITSM) that focuses on aligning IT services with the needs of business. ITIL describes procedures, tasks, and checklists that are not organization-specific, used by an organization for establishing a minimum level of competency. It allows the organization to establish a baseline from which it can plan, implement, and measure. It is used to demonstrate compliance and to measure improvement.
There are three reports in TFS 2012 that we can use to get information about our builds:
The Build quality indicators (see Figure 29-1) report shows a summary of some important values for our builds. Using this data we can see whether we are close to releasing the build. Some of the information this report shows:
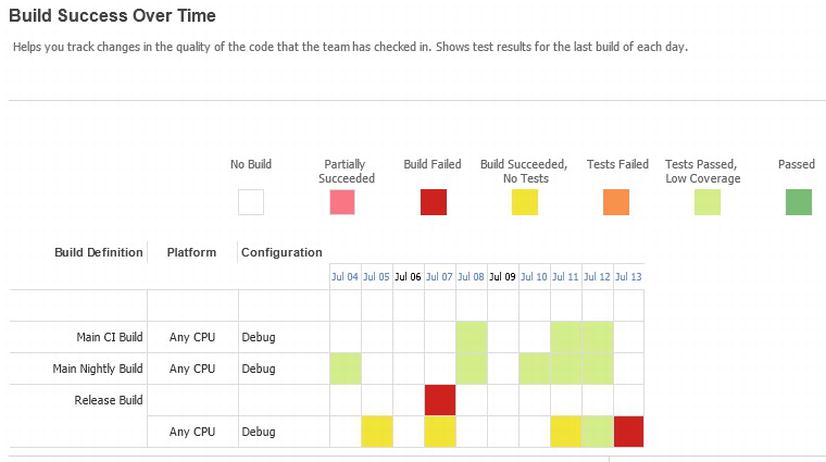
Figure 29-1. Quality Indicators report
- Active bugs. How many active bugs that existed at the time of the build.
- Code churn. The number of lines of code that has been added, removed, and changed in the check-ins before the build.
- Code coverage. How many percent of the code has been covered by tests.
- Inconclusive tests. The number of tests that did not succeed or were paused. If the build did not succeed, the tests are either not counted or counted as inconclusive.
- Failed tests. How many tests failed during the build.
- Passed tests. How many tests that were passed during the build.
The Build Success Over Time report (see Figure 29-2) shows us the status of the last build for each build category (a combination of build definition, platform, and configuration) run for each day. We can use this report to help us keep track of the quality of the code that we check in. Furthermore we can, for any day on which a build ran, view the Build Summary for that specific day.

Figure 29-2. Build Success Over Time report
The Build Summary Report (see Figure 29-3) shows us information about test results, test coverage, code churn, as well as quality notes for each build.
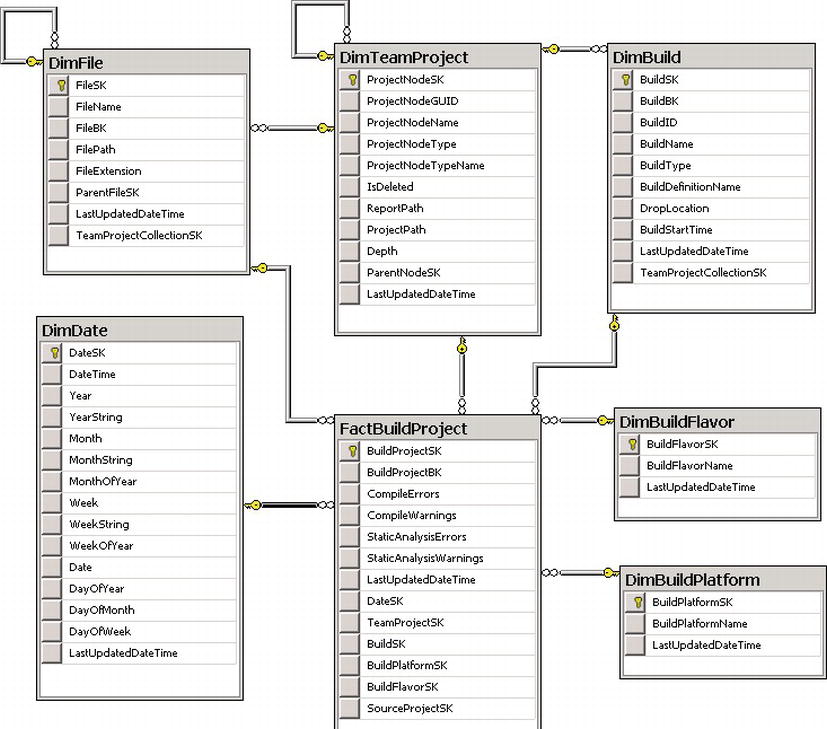
Figure 29-3. Build Summary report
![]() Note The reports in this section are mapped to the particular process templates they support. If you find a report you like, it is possible to customize it to work with another template. In Chapter 32 we describe how to customize an existing report to do this along with other things.
Note The reports in this section are mapped to the particular process templates they support. If you find a report you like, it is possible to customize it to work with another template. In Chapter 32 we describe how to customize an existing report to do this along with other things.
The reporting capabilities in TFS give us access to most of the information we manage in our ALM process. In the previous section we have seen how standard reports give us metrics for our project at a general level. By customizing, extending, and creating new reports we can find out what works well in our projects and what does not.
![]() Note In Chapter 32 we will look at the details of reporting in TFS, including how to create custom reports based on the data models described here.
Note In Chapter 32 we will look at the details of reporting in TFS, including how to create custom reports based on the data models described here.
Data Warehouse Model
The data warehouse in TFS contains several interesting views for analyzing the build information, for instance to create reports on build quality or change information for a particular build.
Build Project Tables
The tables contain build project information that can be used to query data about files and projects in a build. The fact table also contains quality metrics such as compiler errors and warnings (see Figure 29-4).

Figure 29-4. Build project data model
Build Details Tables
The build details tables give us data to query about builds, build status, and build quality (see Figure 29-5).

Figure 29-5. Build Details data model
Build Changeset Tables
The build changeset tables give us information about which changesets were associated with a particular build (see Figure 29-6).

Figure 29-6. Build Changeset data model
Build Coverage Tables
If we want to query the warehouse about test coverage from tests run as part of a build, we use the build coverage warehouse tables (see Figure 29-7).

Figure 29-7. Build Coverage data model
Assessment
The following table (Table 29-1) lists questions that can be used as a basis for an ALM Assessment in the release management area (see Table 29-1). A lot of the assessment questions cover the build process, but many others cover operations and how we deploy applications into production environments.
Table 29-1. ALM Assessment Questions
| Area | Sample Question | Discussion |
|---|---|---|
| Build Management | Is a build process well defined? | Most of these topics below are covered by TFS version control system. |
| Is an automated build verification process in place? | ||
| Is there a library of all successful builds? | We can use TFS to help us put the build outcome into specified folders. | |
| Is there a regular build schedule? | ||
| Is the build process automated? | Yes in TFS. If the customer lacks this we can set it up for them. | |
| Can developers replicate the build process locally? | ||
| Is a build easily reproducible? | Yes in TFS. If the customer lacks this we can set it up for them. | |
| Can you map source control changes to specific builds? | Yes in TFS. Source control changes are associated with each build as an associated changeset and can be viewed on the build summary page. | |
| Is there an effective build failure/success notification process? | Yes in TFS. If the customer lacks this we can set it up for them. | |
| Is there a build status/progress web page in place? | Yes in TFS. | |
| Are drop locations structured/organized effectively to support DEV/testing/Deployment efforts? | We can tailor it as we want in TFS. | |
| Designed for Operations | Is an overall architecture in place for the infrastructure environment? | |
| Do the operations team and development team communicate well at present? | Communication is key to success. Do not forget to involve the infrastructure team. | |
| Does a dedicated team own the infrastructure architecture? | ||
| Do the developers understand the implications of application deployment to the live environment? | ||
| Database Deployment | Do you deploy database changes to a staging database prior to production? | Often forgotten. Help the customer if this is not in place. |
Summary
This chapter showed how we can use TFS to retrieve information for KPI assessment and also how we can see the build status using standard reports from TFS.
We have also shown how many of the assessment questions from the Microsoft online assessment can help us plan for successful implementation of release management.
The next part of this book covers the architecture of Team Foundation Server and how we can plan for a TFS installation.