
![]()
Top Down Design Studies (UML)
No matter how skilled you are at coding, you still need some structure during the process of building a system. If you want your new solution to be a success, you need to keep the quality high, and make sure it meets the needs of the users. If the designers, developers, and users do not speak the same language, you can be certain you will have problems in the end.
One of the worst things that can happen in a big project is when people think they mean the same thing, but they really don’t. This is something that could happen to us in our everyday life as well of course, but for a project it might make the difference between success and failure, because eventually this might lead to disagreement over which features to include in the solution, and thus make a perfectly functional system a failure.
As consultants, we cannot afford to let this happen. If our customers are not happy with the result, we will have difficulties getting a project from them again. This is why it is so important to agree about the requirements of the system at the moment you write them down. Of course you need to adapt as requirements change, but that’s what we use agile practices for.
In Domain Driven Design (DDD) there is a concept to solve just this problem (http://domaindrivendesign.org/node/132) and it is called ubiquitous language. Ubiquitous language is a language structured around the domain model and used by all team members to connect all the activities of the team with the software.
Having methods to help us describe the requirements is very helpful. For example, storyboarding describes the flow and UI of a system. The Unified Modeling Language (UML) is another method to describe the requirements at a detailed level.
Probably the best comprehensive1 overview of UML is The Unified Modeling Language User Guide, 2nd Edition by Grady Booch, James Rumbaugh, and Ivar Jacobson (Addison-Wesley, 2005. ISBN: 0321267974)—unsurprisingly, as the authors collaborated on the design of UML. In this book, they state that four goals are achieved with modeling:
- Models help you visualize the system as it is or how you want it to be.
- Models permit you to specify the structure or behavior of a system.
- Models give you a template that guides you in constructing a system.
- Models document the decisions you have made.
As you can see, you have much to gain by using this technique—and large, complex systems are not the only ones that benefit from modeling either. Modeling helps even smaller systems, as many systems have a tendency to grow and become more and more complex as they go along. With a model, you can grasp this complexity, even after a long time has passed since the inception of the first version of the system.
A good set of UML diagrams can also help you find bottlenecks early in the design process. The sooner you eliminate these bottlenecks, the less they cost to get rid of.
You must also think about modeling at different levels. Sometimes you need a high-level view of the system, and sometimes you need a low-level view. You need, for example, one view when showing the solution to decision makers and another one when talking to developers.
Modeling can be difficult, however. If you aren’t careful when you choose what to model, your models might mislead you and make you focus on the wrong things. Because models are a simplification of reality, it might be easy to hide important details. To avoid this, you need to make sure you connect your models to reality. If you have a weaker connection in one place, you must at least be aware of it.
UML is a standard for writing software blueprints, and as the name implies, it is a language. UML can be used to visualize, specify, construct, and document the deliveries (or artifacts) of a software-intensive system. But remember that because UML is only a language, it is just one part of the development cycle.
One drawback of models is that they have a tendency to become obsolete at the same time as development starts. Nobody really focuses on keeping them up to date. And do we actually have use of them after we have developed the system (or application)? If we have used test-driven development, many problems such as seeing the effect of a bug fix or new version are eliminated. We have heard many developers argue that modeling is useful during sprint planning, but then they throw away the model, as it is no longer useful. Although this is very often true, the use of models and modeling during the design phase could be helpful. It really doesn’t matter whether or not we keep them; use them where you think they are appropriate.
UML Basics
If you have little experience in UML, here comes our crash course just for you. It is by no means a complete explanation, but it is important to have an understanding of these concepts because Visual Studio has tools supporting UML. At the same time, you will see some UML features in Visual Studio.
UML Support in Visual Studio 2012
Let’s take a look at which parts of UML are supported in Visual Studio 2012 Ultimate. Visual Studio (VS) provides templates for five of the most frequently used UML diagrams: Unified Modeling Language (UML)
UML modeling diagrams and layer diagrams can exist only inside a modeling project. Each modeling project contains a shared UML model and several UML diagrams. Each diagram is a partial view of the model. The UML model contains all the elements in the UML diagrams and can be viewed by using UML Model Explorer.
This means that you must create a modeling project in your VS project and then start adding the UML diagrams you want (see Figure 11-1) by going to the Project menu and selecting Add New Item.
There are some exceptions to this according to http://msdn.microsoft.com/en-us/library/dd409445.aspx:
- Sequence diagrams that are generated from source code.
- Class diagrams that are created as views of the source code. These are not related to UML class diagrams.
- Dependency graphs.
- Diagrams that are not UML diagrams or layer diagrams, such as domain specific languages.

Figure 11-1. The UML diagrams in Visual Studio
When a UML diagram is selected, a toolbox with the symbols needed for the specific diagram is presented in the left pane (see Figure 11-2).
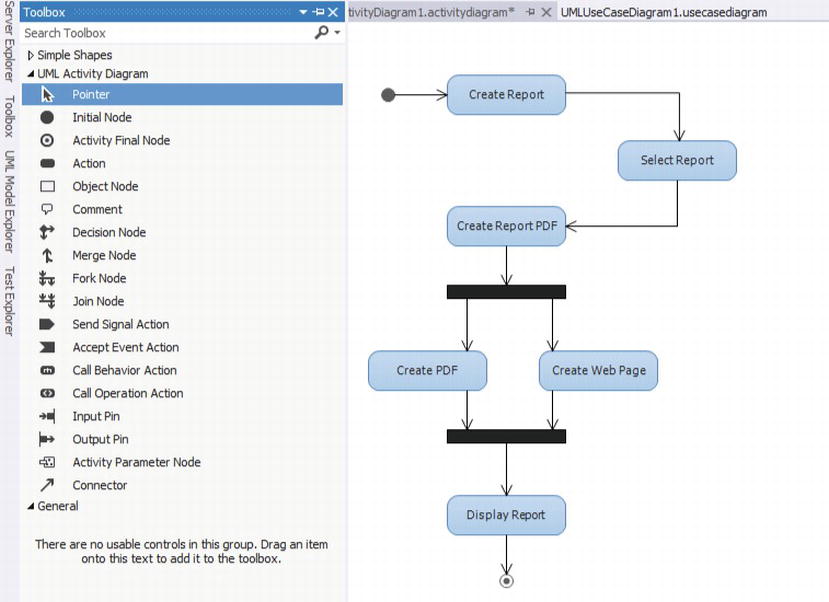
Figure 11-2. Toolboxes with symbols are available for all UML diagrams in VS
In the following sections, we’ll take a look at some of these diagrams and explain how to use them. This will be a simplified overview of how you can use them. Visual Studio, however, offers many complex UML scenarios if you want to create such.
![]() Note There is a Visual Studio feature pack that greatly enhances modeling and visualization in VS. We do not cover it here but take a look at http://msdn.microsoft.com/en-us/library/dd460723.aspx for more information.
Note There is a Visual Studio feature pack that greatly enhances modeling and visualization in VS. We do not cover it here but take a look at http://msdn.microsoft.com/en-us/library/dd460723.aspx for more information.
Activity Diagram
An activity diagram shows the flow of control. Activities are action states that move, or transition, to the next state after completion. In Figure 11-3, you can see these activities as rounded rectangles. Our example shows a simple flow of control for the display of expense reports, which are also published on a web site. An arrow represents all transitions between the activities. To show activities performed in parallel, we use synchronization bars (Fork Node and Join Node in VS).

Figure 11-3. An activity diagram showing activities as rounded rectangles
These diagrams are really flowcharts used early in the design process to show the workflow between use cases. You are not required to use them at this point in the process, however. You can use them where you feel they are appropriate, or when you think they explain a flow in a system so that a decision maker can understand what you mean.
In your activity diagrams, you can use something called swim lanes to show ownership. In Figure 11-4, we have added a swim lane to our activity diagram to show the responsibilities of employees and managers.
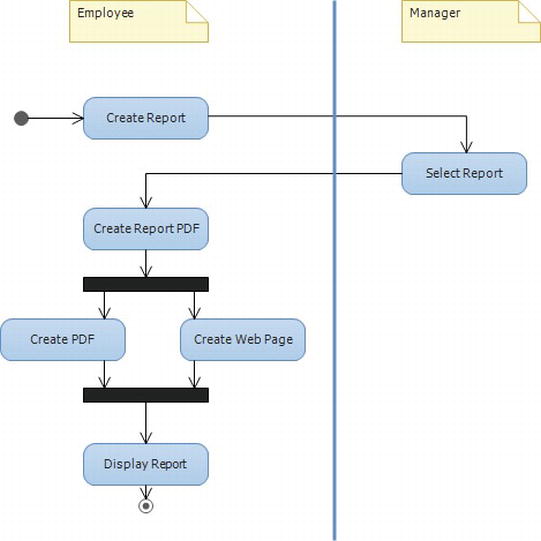
Figure 11-4. A swim lane added to our activity diagram
The employee handles everything but the approval of the report. That task is left to the manager. So now we have shown the responsibilities of all parties in this extremely simple scenario.
Use Cases and Use Case Diagrams
When you create use cases, you first have to decide which actors will participate in your solution. An actor can be a person (or group of persons), but it can also be another system—that is, something that interacts with the system, but is outside the system. We represent our actors with stick figures, almost like the ones in The Blair Witch Project, if you are familiar with that movie (see Figure 11-5).

Figure 11-5. Actors in a use case diagram represented as stick figures
Let’s continue our simple scenario from the previous section. We have already mentioned two actors: the employee and the manager. Do we have anyone else? One actor that immediately comes to mind is the administrative staff. Another one might be a PDF application that creates the PDF files of the reports
The next thing to do is find your use cases. The easiest way for you to do this is by looking at your actors and asking yourself why they want to use the system. A use case in itself is a description of actions that a system performs to give an actor the result of a value. In our example, they are portrayed as ovals, as you can see in Figure 11-6.

Figure 11-6. Actions that a system performs for the actors
In our example, the employer creates an expense report. The manager approves the expense report so that the employee can get his or her money. The admin staff can look at the reports and perform any administrative tasks that they need.
Now, after you have identified some use cases, you can start documenting them. This is done by describing the flow of events from the actors’ points of view. You must also specify what the system must provide to the actors when the use case is executed. The use case should show the normal flow of events, but it should also show the abnormal flow—that is, when something goes wrong during execution and an alternate scenario takes place. (The scenarios are on a high level, so you cannot catch all possible actions.)
Often, use cases are great for showing the people paying for the system what actually will happen in it. This way, you can be assured early in the process that what you are building is what the customer expects.
Let’s take a look at the expense report creation process. This starts when the employee logs in to the system. The system verifies the password and then shows the form for the Create Expense Report form. The employee can choose from various alternatives what he or she intends to do:
- Create new expense report: Create new expense report subflow executes.
- Modify expense report: Modify expense report subflow executes.
- Delete expense report: Delete expense report subflow executes.
- Review expense report: Review expense report subflow executes.
- Exit: Use case ends.
When you’ve created your use case diagrams, you’ll have a good overview of the system. However this does not guarantee that no surprises will occur along the line.
Sequence diagrams are used to illustrate the dynamic view of a system. They show the interaction and the messages sent between objects in chronological order (see Figure 11-7).

Figure 11-7. A sequence diagram of the addition of a new product to a campaign
First, you place the objects that participate in the interaction at the top of the diagram across the x-axis. The object that initiates the interaction is typically placed to the left, and the more subordinate objects to the right. The messages sent are placed to the left along the y-axis (time). Our example here shows a simplified version of creating an expense report.
Sequence diagrams are great for showing what is going on in a process. In collaboration with the customer, they can help in mapping out the requirements of the system. You can do a sequence diagram for every basic flow of every use case, and keep doing them until you think you have enough. Enough is basically when you cannot find any more objects and messages.
VS has different symbols for helping you create your sequence diagrams as seen in Figure 11-8.
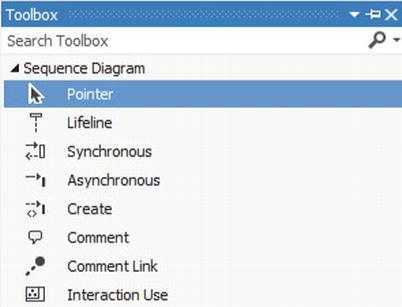
Figure 11-8. The symbols for sequence diagrams in VS
Class Diagrams
This is one of the most common diagrams used. Using class diagrams you can model the static design view of a system. A class diagram shows classes that are collections of objects with a common structure, behavior, relationships, and semantics. In UML, classes are represented by a rectangle with three compartments, as shown in Figure 11-9. The top compartment displays the name of the class, the middle one lists its attributes, and the bottom one indicates its behavior (or operations).
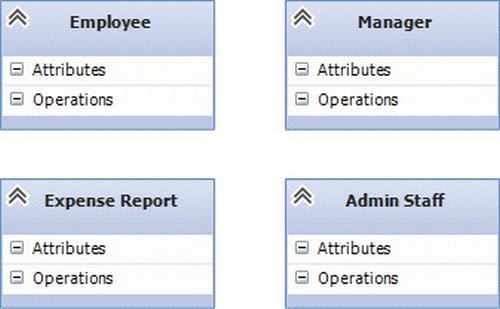
Figure 11-9. A class diagram
You can choose to show one, two, or all three of these compartments. When you choose the names for your classes, try to maintain a standard throughout your project. You can, for instance, decide to use singular nouns, like Customer, with a capital letter at the beginning. How you choose, or what you choose, is not important. What is important is that you stick to your standard, so as to avoid confusion later on.
What UML modeling elements do you find in class diagrams? You will probably have many class diagrams in your model, because they show the logical view of your system. They show which classes exist, and the relationships between them. They also show associations, aggregations, dependencies, and inheritance. From your class diagram, you can see the structure and behavior of your classes. You can also see multiplicity and navigation indicators. Figure 11-10 shows the class Expense Report and some of its attributes. In the real world, we would find out these attributes by talking to our stakeholders and looking at our requirements. For the purposes of our example, let us say that the class has five attributes: ID, Report_date, Expense, Expense_amount, and Total_amount.

Figure 11-10. The class Expense Report and its five attributes
Next, you need to find some operations for your class. Operations are the behavior of the class. In Figure 11-11, we have hidden the attributes of the Expense Report class and show only the class name and operations. Because this is a simplified view of a class, only three are specified: Add, Delete, and Modify. There could, of course, be many more, just as there could be many more attributes. It all depends on our requirements and the input from the customer.
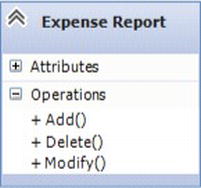
Figure 11-11. The Expense Report class and its operations, with the attributes hidden
After you have your classes, you can start looking for the relationships between them.
Relationships
Three kinds of relationships exist in UML according to the document “Introduction to the Unified Modeling Language” by Terry Quatrini (http://www.rational.com/uml/resources/whitepapers/index.jsp): association, aggregation, and dependency. They all represent a communication path between objects. One could argue that inheritance should be counted as a relationship; however, we chose not to here.
Association is represented by a line connecting classes, as you can see in Figure 11-12. This is a bidirectional connection, which means that one class can send a message to the other, because if they are associated, they both know the other one is there.
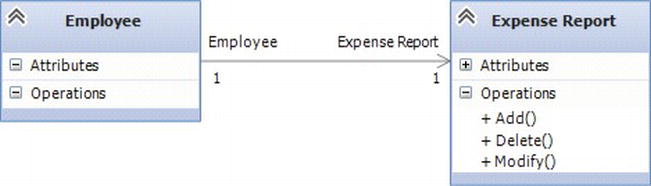
Figure 11-12. An association between two classes
A stronger form of relationship is the aggregation. In UML, you show this as a line connecting the related classes. The line has a diamond on one end. An aggregation shows the relationship between a whole (represented by a diamond) and its parts. When you, as a developer, see this kind of relationship, you know this means there is a strong coupling between those object classes.
The third kind of relationship is dependency. It shows that a change in the specification of one class may affect another class that uses it. Keep in mind that the reverse may not necessarily be true. Use dependencies when you want to show that one class uses another class.
To find your relationships, start by looking at your sequence diagrams. If you find that two objects need to talk to each other, they must have a way of doing this. This way is the relationship. The deeper you analyze your diagrams, the more you will know what type of relationship to use. A parent-child relationship will probably be an aggregation, and so on.
Multiplicity
Multiplicity simply states how many objects participate in a particular relationship. It shows how many instances of one class relate to one instance of the other class. Based on this, you need to decide for each end of an association and aggregation what level of multiplicity is needed. Because multiplicity defines the number of instances, you will represent it in your diagram with either a number or an asterisk (*). The asterisk is used to represent a multiplicity of many (see Figure 11-13). In our example, we could say that one employee can own several expense reports. This is known as a one-to-many relationship, which would be represented as 1 - *.
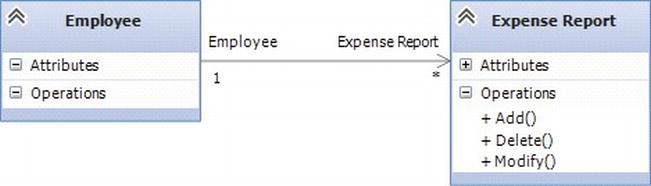
Figure 11-13. A multiplicity of one to many
You decide multiplicity by examining your business rules. For our example, we could have a business rule stating that one employee can own only three campaigns. Then we would have a one-to-three relationship.
Inheritance is the relationship between a superclass and a subclass. In our example, if we have a class called Employee, we can have other classes like Manager or AdminStaff that are separate classes but still fall under the Employee class. That is, a Manager is an Employee. This relationship is shown with a triangle (see Figure 11-14).

Figure 11-14. Inheritance between two classes
Be cautious when using inheritance. You do not want to build too many levels, because if you do, a change in one class affects many others. This could bring disaster to your products, because you might have to make changes in many places because of this. Build another level only when you are sure there is an inheritance situation, and do not include it just for the sake of having it.
With the knowledge of the topics you have gleaned in this section, you have come quite some way down the path of understanding UML. A good source of information about UML, and the topics we did not cover here, is the book mentioned earlier, The Unified Modeling Language User Guide, 2nd Edition by Booch et al.
Component diagrams (see Figure 11-15) are used to visualize how components are wired together to form larger components or software systems. The component diagram’s main purpose is to show the structural relationships between the components of a system.
Components are connected by using an assembly connector to connect the required interface of one component with the provided interface of another component. This illustrates the service consumer - service provider relationship between the two components (http://en.wikipedia.org/wiki/Component_diagram).
An assembly connector is a connector between two components that defines that one component provides the services that another component requires. An assembly connector is a connector that is defined from a required interface or port to a provided interface or port.
When using a component diagram to show the internal structure of a component, the provided and required interfaces of the encompassing component can delegate to the corresponding interfaces of the contained components.
A delegation connector is a connector that links the external contract of a component (as specified by its ports) to the internal realization of that behavior by the component’s parts.

Figure 11-15. A simple Component diagram
Integration with TFS
One cool thing in TFS 2012 is that you can link a model to a work item in TFS. For instance you can right click the model and select create work item from the menu (see Figure 11-16). This way you can bind the model to the backlog (or a backlog item).

Figure 11-16. Linking a model to a work item
Summary
Visual Studio offers great support for UML out of the box. UML models can be a great addition to the sprint planning meeting when the team starts to break down the user stories into more manageable bits and the design process starts.
However, models have a tendency to be created and then forgotten about as the development process goes on. And if we do not use them more than during a limited time period, the might not be so necessary.
If we have good automated unit tests and a good stable continuous integration process we might not need to have any models at all. We will easily find where a bug fix or new feature implementation will have its impact with the help of the features TFS offers.
In the next chapter we will take a look at the architecture explorer and see some exciting features TFS and VS offers there.
1 If you would prefer a shorter and more digestible introduction, try UML Distilled: A Brief Guide to the Standard Object Modeling Language (3rd Edition) by Martin Fowler (Addison-Wesley, 2003. ISBN: 0321193687). Whichever book you choose, it is important to get the latest edition.