![]()
Performance and Profiling
Performance analysis and tuning are often done after release—but we really do not have to wait until then. Instead we should integrate the profiling into our daily routines to make sure we always keep an eye on the performance of our applications.
In software engineering, profiling is a form of dynamic application analysis that measures, for example, the memory usage, the usage of particular instructions, or frequency and duration of function calls. The most common use of profiling information is to help developers optimize their applications.
Profiling is achieved by instrumenting either the application source code or the binary executable. TFS and Visual Studio include profiling tools that will help us with this task.
Profiling Overview
There are many ways a profiling tool can gather and output data. The profiling tools can collect different kinds of information like performance counters, hardware interrupts, code instrumentation, and operating system information just to mention a few. Let’s take a brief look at some ways the profiling tools can collect data:
- Event-based profilers: Some programming languages offer an event-based profiler. In Java we have the JVMTI (JVM Tools Interface) API, formerly JVMPI (JVM Profiling Interface), which provides hooks to profilers, for trapping events like calls, class-load, unload, thread enter leave. In .NET we can attach a profiling agent as a COM server to the CLR using Profiling API. Like Java, the runtime then provides various callbacks into the agent, for trapping events like method JIT / enter / leave, object creation, etc.
- Statistical profilers: Some profilers operate by sampling where the profiler probes the target application’s program counter at regular intervals using operating system interrupts. Sampling profiles are typically less numerically accurate and specific, but allow the target program to run at near full speed, which helps the profiler detect issues that would be hard to catch otherwise. Often a drawback with some profiling methods is that the application takes a performance hit during profiling. The resulting data from statistical profilers are not exact, but a statistical approximation.
- Instrumenting profilers: Some profilers instrument the target program with additional instructions to collect the required information. This profiling method can affect the performance of the program, which could cause inaccurate results. Instrumenting will always have some impact on the program execution, typically always slowing it. However, instrumentation can be very specific and be carefully controlled to have a minimal impact. The impact on a particular program depends on the placement of instrumentation points and the mechanism used to capture the trace.
There are two major outputs a profiler might produce:
- A statistical summary, or profile as it is also called, of the events the profiler has observed. Summary profile information is often shown annotated against the source code statements where the events occur, so the size of measurement data is linear to the code size of the program.
- A trace, which is a stream of recorded events. For sequential programs, a summary profile is usually sufficient, but performance problems in parallel programs (waiting for messages or synchronization issues) often depend on the time relationship of events, thus requiring a full trace to get an understanding of what is happening.
Let’s now take a look at what Visual Studio has to offer when it comes to profiling.
Profiling In Visual Studio 2012
Visual Studio 2012 offers some great tools when it comes to profiling. These tools let us measure, evaluate, and find performance-related issues in our code. The tools are fully integrated into the Visual Studio IDE to provide a seamless and approachable user experience; however the profiling tools are also available from the command line if we would like that approach.
The profiling tools in Visual Studio offer five ways to collect and analyze data:
- Sampling: This is the recommended way to start exploring application performance. The sampling method is nonintrusive and has little impact on the execution of the application being monitored. Sampling profiling interrupts the processor at given intervals and collects the executing call stack. Based on these statistics, call counts are calculated so we can analyze execution patterns.
- Instrumentation: When using the instrumentation the profiled code gets injected so exact call times can be recorded. In the analysis report we use the following values to understand the application performance:
- Elapsed Inclusive: Total time spent executing the method (including calls to other methods).
- Application Inclusive: Same as Elapsed Inclusive but with calls to the operating system excluded.
- Elapsed Exclusive: Time spent executing code in the method.
- Application Exclusive: Same as Elapsed Exclusive but with calls to the operating system excluded.
- Concurrency: This profiling mode collects data about multithreaded application. The analysis reports resource contention and there is also a visualization of how the application executed which we can use to trace bottlenecks in the system.
- .NET Memory: The .NET memory profiling collects information when .NET objects are allocated and returned. Memory profiling can be used together with sampling or concurrency proofing.
- Tier Interaction: This mode collects information about ADO.NET calls made to a SQL Server database. The analysis data can help us understand database performance from an application perspective. Tier Interaction can be used with any of the other profiling modes.
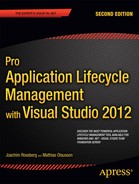
If we do not want to manually set up our profiling, we can use the Performance Wizard (see Figure 18-1) and start with the default settings. By analyzing these results we can decide whether we need to change any settings or setup some manual profiling.
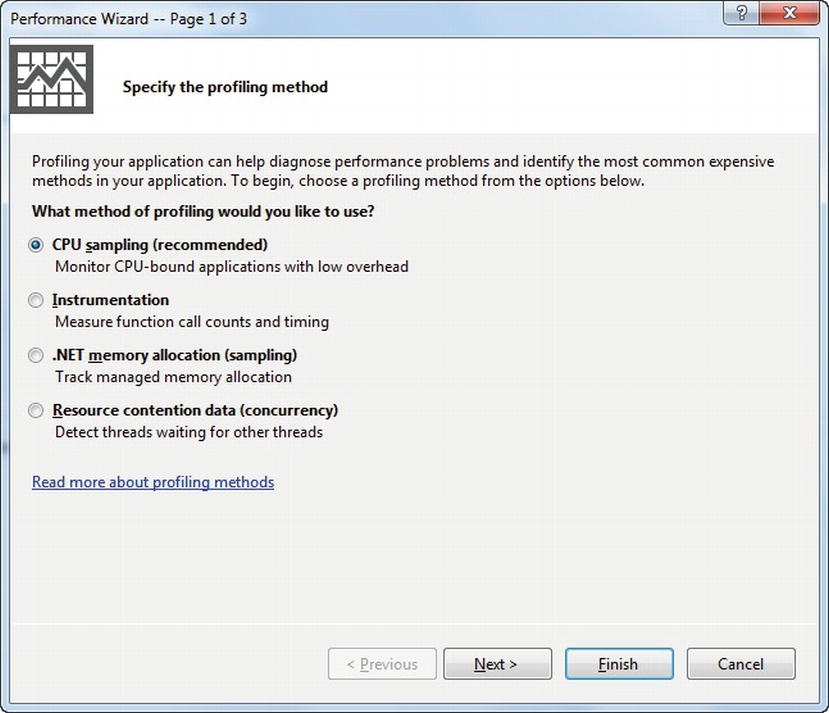
Figure 18-1. The Performance Wizard
We run the Wizard from the Analyze→Launch Performance Wizard in Visual Studio.
The output of the Performance Wizard is extensive. Performance warnings that alert us to common coding issues in the VS Errors window, for instance. From these warnings we can navigate to the source code and to help topics on how to write more efficient code.
Other reports give us views on the different levels of application structure. We get this information from source code lines to processes. We also get program execution data from the calling and called functions of a specific function to the call tree of the entire application. This is very useful information to assess our application performance data.
Let’s now take a look at how we can set up profiling in Visual Studio 2012.
Setting Up Profiling
Setting up a profiling session can be as simple as running the Wizard shown in Figure 18-1. We can also create and configure a profiling session manually by adding a new session from the Analyze→Profiler→New Performance Session (see Figure 18-2).

Figure 18-2. Performance Explorer
We can change profiling mode, add or remove profiling targets and other settings from the properties of the performance session (see Figure 18-3).
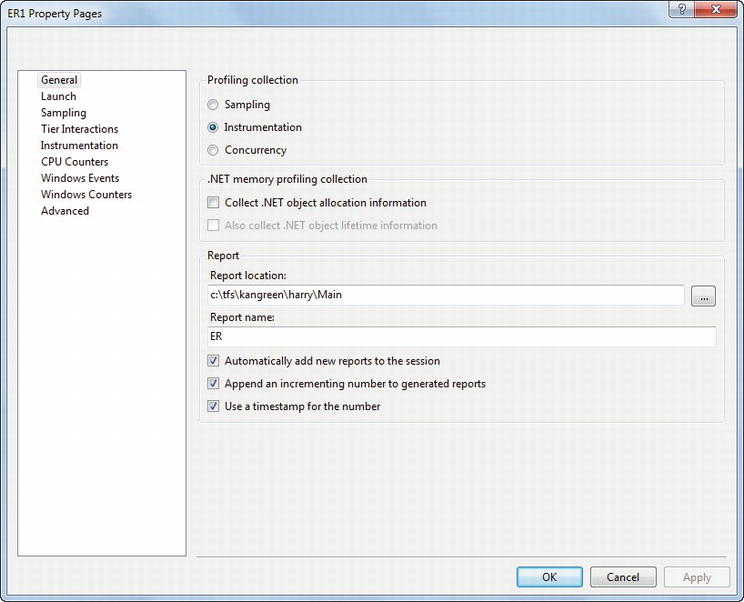
Figure 18-3. Performance session properties
Running a Profiling Session
When the requirements for the profiling have been set up we can start a profiling session. We can use the Performance Explorer as shown in Figure 18-4 to start a new session. The profiler runs until we shut down the application under test after which the profiling data is collected for analysis.
Figure 18-4. Starting a profile session from the Performance Explorer
There are also other options to start a profiling session available from the Analyze menu in Visual Studio.
Examining the Results
After a performance run has completed, the profiling report is presented (see Figure 18-5). The report has several views to help analyze the result. Typically we would start from the Summary view to get an overall picture of the session. Often the Hot-path feature highlights the most expensive path of calls in the session—this is a good way to begin the analysis.
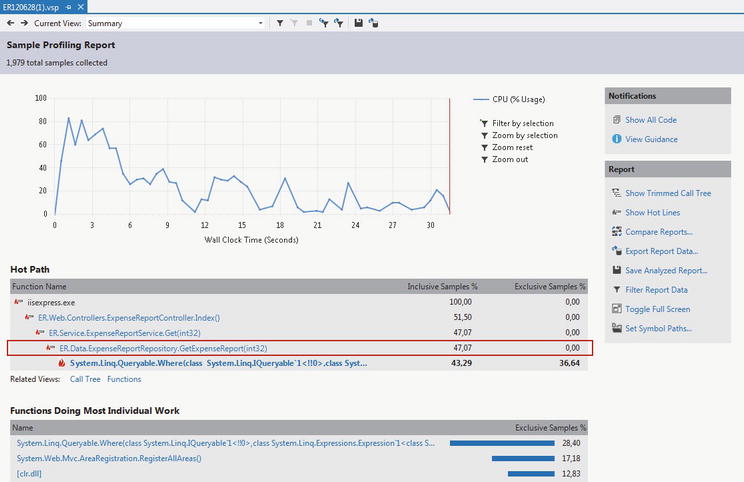
Figure 18-5. Performance analysis report
Next, use the tools to zoom in and filter on the data in the report. Clicking on a function takes us to the function details where we see details such as the call tree (annotated with time spent/method). We even get the most expensive lines of code highlighted in the code editor to help us quickly analyze the problem (see Figure 18-6).
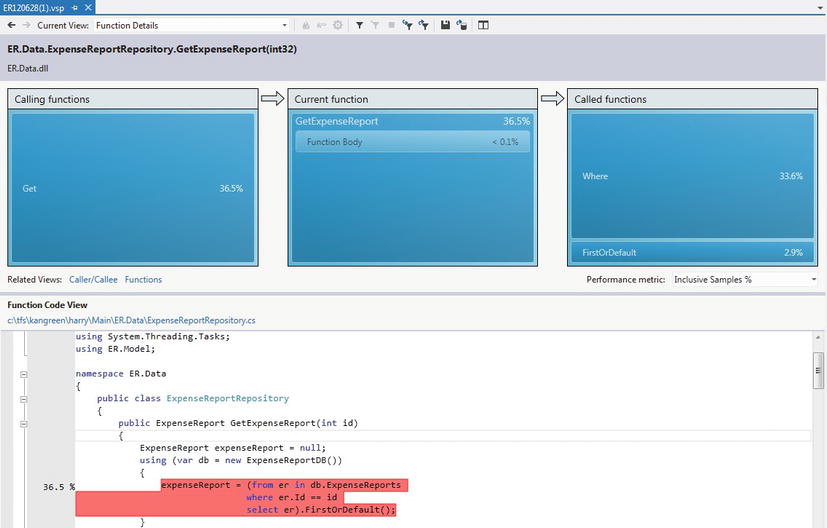
Figure 18-6. Performance session function details
Comparing Results
Part of any performance optimization effort is making adjustments and comparing the results with previous runs. The profiling results can be saved and used as a baseline for a later comparison. Or we can use the Performance Explorer and select two reports to compare as shown in Figure 18-7.
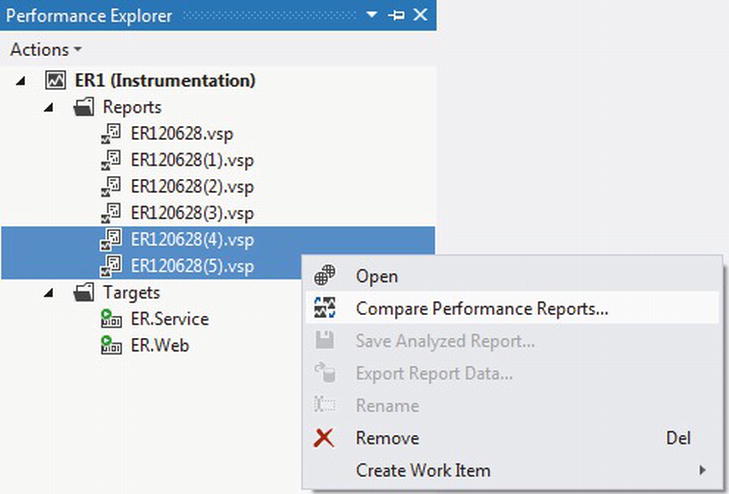
Figure 18-7. Comparing two performance reports
The comparison report in Figure 18-8 lets us filter the result using the collected values. The result is then shown with indicators if the time has gone up or down since our last run, which helps us find performance improvements or regressions quickly.

Figure 18-8. Performance comparison reports
IntelliTrace is a major enhancement made to the Visual Studio debugging environment. Usually when an exception occurs, you start debugging with breakpoints set in suspected areas and check variable/object values for correctness to see whether you can find what went wrong.
If we enable IntelliTrace, the difference will be that if an exception occurs IntelliTrace allows us to just go back in time of our application execution and find out what events got raised and what the values were of various variables, etc. This helps us inspect all the events that finally triggered the exception without the need for breakpoints.
Traditionally a debugger gives us the state of our applications at the current time, and the information about events is limited especially if they occurred in the past of the execution. Using IntelliTrace in Visual Studio 2012 enhances the picture of our application execution so that we do not have to restart the application to re-create past events. We do not have to make educated guesses of what happened prior to an application exception. We can actually see events that occurred in the past and the context in which they occurred. This eases our debugging and makes us find and fix bugs and errors more efficiently.
IntelliTrace helps by recording the following information:
- Debugger events: These events occur within the Visual Studio Debugger while you debug your application. The startup of your application is one debugger event for instance.
- Exception events: These occur for handled exceptions, at the points where the exception is thrown and caught, and for unhandled exceptions. IntelliTrace collects the type of exception and the exception message.
- Framework Events: These occur within the .NET library. The data collected by IntelliTrace varies by event. For a File Access event for instance, IntelliTrace collects the name of the file.
The point of IntelliTrace is that we should be able to debug our applications quicker than before. It also helps us find and fix problems with errors that we cannot reproduce easily. It is much easier to use IntelliTrace than to try and reproduce the error.
IntelliTrace runs in the background and records the debugging information. Once we want to look at the past state of an application execution we enter IntelliTrace and then we can navigate to the points in time we are interested in.
We can create and save our IntelliTrace output as an .iTrace file in either Microsoft Test Manager or Visual Studio. This lets us perform post-crash debugging without losing any of the features of IntelliTrace.
![]() Note IntelliTrace analysis in Visual Studio requires the Visual Studio Ultimate edition.
Note IntelliTrace analysis in Visual Studio requires the Visual Studio Ultimate edition.
Using IntelliTrace has normally very little effect on application performance and is thus turned on by default when debugging in Visual Studio. This way we have the option to use IntelliTrace even if we did not plan to from the beginning. You can turn off IntelliTrace as seen in Figure 18-9. Follow these steps to enable IntelliTrace:
- Select Tools→Options→ IntelliTrace menu in Visual Studio.
- Use the Enable IntelliTrace check box to turn on IntelliTrace.

Figure 18-9. Even though IntelliTrace has little impact on performance, we can turn it off if we want
The other tabs for configuring IntelliTrace let us setup log location, events to capture, and modules to exclude from profiling.
IntelliTrace supports debugging Visual Basic and C# applications that use any .NET version from 2.0 to 4.5 (http://msdn.microsoft.com/en-us/library/dd264915(v=vs.110)). You can debug most applications, including applications that were created by using ASP.NET, Windows Forms, WPF, Console Applications, Windows Workflow, and WCF. IntelliTrace does not support debugging C++, script or other languages. Debugging of F# applications is supported on an experimental basis. Metro style applications are supported for events only.
Working with IntelliTrace
After configuring IntelliTrace, using it is automatic inside Visual Studio. Once the application runs in debug mode, the IntelliTrace log is recorded. At any point we can open the IntelliTrace window and pause the debug session to look at the IntelliTrace events. Figure 18-10 shows the IntelliTrace Explorer which can be used in these two modes:
- IntelliTrace Events View: This is the default view that lists the events from the trace session.
- Calls View: In this view the events are listed in a hierarchical view similar to the call stack in the normal debugger.
We can also use the IntelliTrace Explorer to get to the configuration dialog for IntelliTrace or save the iTrace file for later analysis.

Figure 18-10. IntelliTrace Explorer
Selecting an event gives detailed information about the event as well as access to the Local variables collected and the Call Stack (see Figure 18-11).
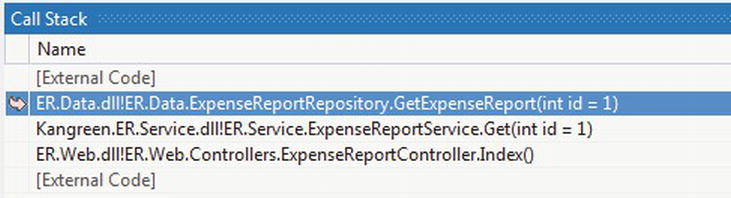
Figure 18-11. IntelliTrace Call Stack
The code behind the event is automatically shown in Visual Studio (if the debugger has access to the source code) and we can navigate in the debug history using the controls beside the code (see Figure 18-12).
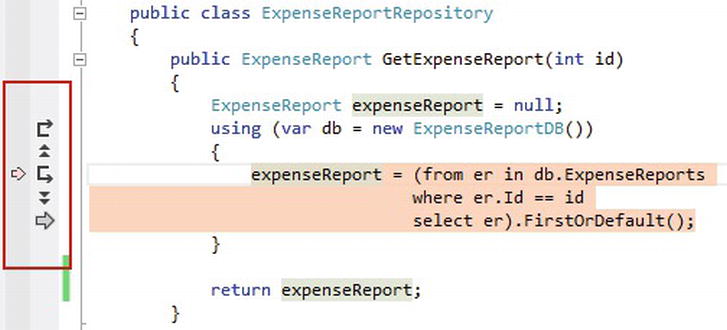
Figure 18-12. Using the call naviation in an IntelliTrace session
Chapter 21 looks at how we can use Microsoft Test Manager to collect IntelliTrace in test environments as part of manual or automated testing outside Visual Studio.
Using IntelliTrace in Production
New to IntelliTrace in Visual Studio 2012 is running the IntelliTrace data collection standalone. It is now possible to deploy IntelliTrace to an environment simply by copying the runtime files. Because the technology solves a problem that often only occurs in environment where we do not have development or testing tools installed this is a great enhancement.
To enable IntelliTrace in production see http://msdn.microsoft.com/en-us/library/hh398365(v=vs.110).
One way to further enhance and improve your performance analysis is to use the free tool PreEmptive Analytics (PA) from PreEmptive Solutions that comes on the TFS installation. PA aggregates and analyzes exceptions and creates work items from this information based on the rules and thresholds we choose. PA is a very useful tool when an application has been deployed into operations (as well as during development) as it works in the background. PA for TFS can respond in near real-time (matter of seconds).
PA for TFS collects runtime data transmitted from instrumented applications, analyses the aggregated production incidents against rules and thresholds that you can specify yourself. Your applications automatically send back exception report data to the PreEmptive Analytics endpoint service as errors occur during their execution and the PreEmptive Analytics aggregator service collects these error reports and automatically, when appropriate, creates and/or updates TFS work items.
PA allows you to instrument your application(s) and receive reports from your users on any crashes they experience. The reports are analyzed, correlated with other reports, and distilled to a set of production incidents that appear to be the same underlying cause. These show up as work items in your Team Foundation Server database.
![]() Note Feedback Driven Development is a set of techniques for measuring progress based on customer interaction. Progress could be anything from “Are we completing our user stories?” to “Are we making profit?” Learn more about Feedback Driven Development and PreEmptive Analytics at http://www.preemptive.com/images/stories/ri_documentation/preemptive_analytics_tips_dec_2011.pdf.
Note Feedback Driven Development is a set of techniques for measuring progress based on customer interaction. Progress could be anything from “Are we completing our user stories?” to “Are we making profit?” Learn more about Feedback Driven Development and PreEmptive Analytics at http://www.preemptive.com/images/stories/ri_documentation/preemptive_analytics_tips_dec_2011.pdf.
Installing PreEmptive Analytics
PreEmptive Analytics consists of a service and a client-side component. The service is setup as an endpoint that clients connect to and upload diagnostic data for analysis. The client-side component is instrumented into the application at compile time and calls the service to log exceptions. The PreEmptive Analytics Community Edition is bundled with the TFS 2012 installation and no additional downloads are needed to setup the service. We start the installation from the TFS administration console (see Figure 18-13). The setup walks you through the process of setting up an aggregator service which is the endpoint our application connects to in order to report exceptions to the system.
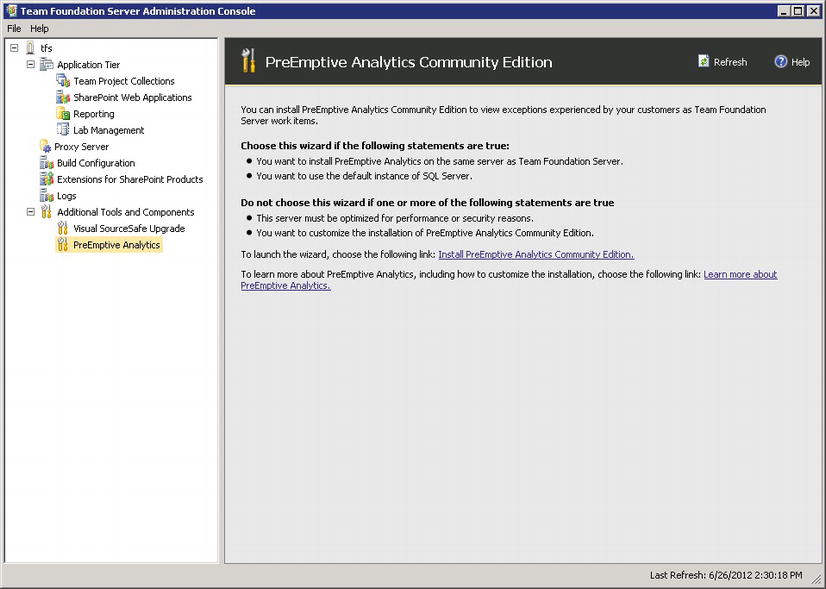
Figure 18-13. Installing PreEmptive Analytics from the TFS admin console
Configuring Your Team Projects for PreEmptive Analytics
Next we need to provision PreEmptive to each Team Project in which it should be used. We manage this configuration from the PreEmptive Analytics Aggregator Administration Console (see Figure 18-14) by selecting the Team Project and Apply. In effect this action will import the required PreEmptive work item types and SQL Server reports to the Team Project.

Figure 18-14. Configuring PreEmptive Analytics from the PreEmptive Analytics Configuration Utility
Adding Exception Reporting to a .NET Application
After the core setup, we can configure our system for analytics reporting and TFS to receive the data.
Configure an Application for Analytics Reporting
An application needs to be instrumented with logging calls to PreEmptive Analytics for data to be sent to the service. To set up this we use the Tools→PreEmptive Dotfuscator and Analytics. This opens up a configuration application where we add Inputs and Analytics attributes (see Figure 18-15). There are several attributes we can use to configure the reporting to the PreEmptive service; the most essential are
- ApplicationAttribute: Defines the application to trace.
- BusinessAttribute: Defines the company owning the application.
- SetupAttribute: Indicates tracing should start.
- TeardownAttribute: Indicates that tracing should stop.
For details on how to configure PreEmptive Analytics application attribute see the product documentation (http://www.preemptive.com/products/patfs/overview). Finally, we build the PreEmptive project to produce the instrumented assemblies we will use to get the data collected.
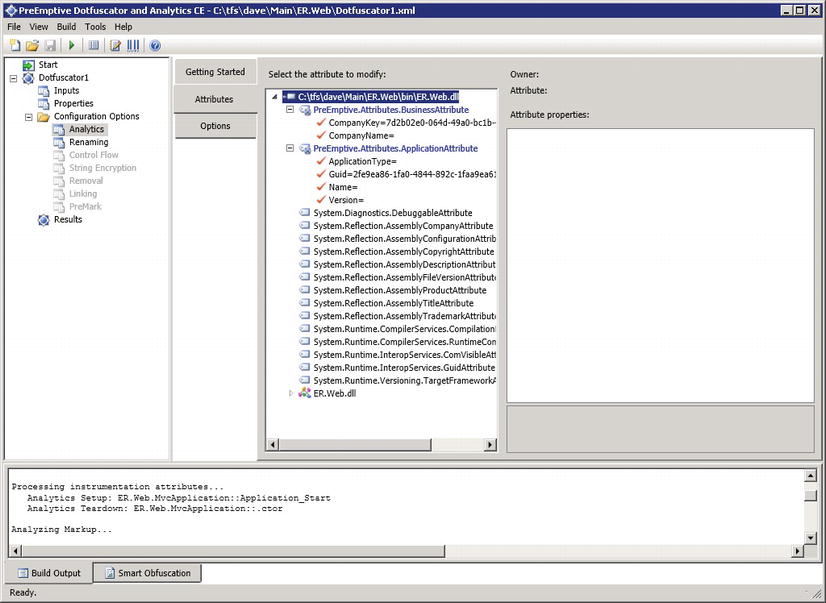
Figure 18-15. Configuring an application for PreEmptive Analytics
Configure TFS to Receive PreEmptive Analytics Data
The second part of the configuration is to set up TFS to collect the data and create work items for the result. To set up TFS we use the Team Explorer and the PreEmptive Analytics activity (see Figure 18-16).

Figure 18-16. Configuring PreEmptive Analytics for a Team Project
In the configuration dialog we specify the company and application ids (from the attributes defined in the PreEmptive application file). See Figure 18-17 for an example.

Figure 18-17. Adding a PreEmptive Analytics application
Examining Incidents in Team Foundation Server
Finally, we can analyze the incident work items in TFS. Because the PreEmptive Analytics incidents are reported as standard TFS work items we can manage them using any of the standard TFS tools. From the PreEmptive Analytics view in Team Explorer we can use the predefined queries and reports as shown in Figure 18-18.

Figure 18-18. Viewing PreEmptive Analytics incidents in TFS
Summary
Good application performance is essential to the success of most software. Unfortunately, performance analysis is something done very late in the process, often as late as in production when the issue is reported by a customer.
With the built-in application profiler in Visual Studio we can start analyzing performance while developing. It is easy to run a profiling session at any time; we can even use a unit test to drive the profiling session. So with this tool we have little excuse not to deliver well-performing applications.
In this chapter we have also looked at two related tools focusing on helping us understand problems in the environment in which they were found. It is common to spend lots of time analyzing problems that we cannot reproduce in development environments.
With IntelliTrace, we can get an execution log from any environment, including production, which we can open in Visual Studio and replay the events from the environment where the problem occurred.
The second tool, PreEmptive Analytics, lets us instrument our code with rich error logging. When a problem occurs in the application, the data is sent to a service in TFS which logs the problem as a Work Item for analysis. We can then address the issue just like any other bug report in TFS with rich execution context attached to the bug.