14 Test Bed for Evaluation of Power Grid Cyber-Infrastructure
David C. Bergman and David M. Nicol
CONTENTS
14.2.2.2 Psuedo-Transport Layer
14.3.2 Virtual Data Aggregators
14.4 Development and Validation
14.5.1 Create the Basic Network
Definitions
DETER–Cyber Defense Technology Experimental Research: A computer network, used for network security experiments, at the University of Utah, which contains physical compute nodes and a highly configurable network topology.
DNP3.0–A protocol used to gather data and issue control commands between master and slave devices. Also goes by DNP v3.0, DNP3, or just DNP.
Power Grid–The collection of buses, generators, lines, transformers, and so on that comprises the system of power delivery from power stations to power consumers.
Substation–Also known as an outstation, the substation is an unmanned location in charge of controlling and collecting data from intelligent electronic devices (IEDs) in the immediate area.
Data Aggregator–A SCADA device at the substation level, which exists to compile data from the RTUs and report the data to the control station.
RINSE–Real-Time Immersive Network Simulation Environment.
Modbus–A legacy protocol that operates point-to-point, generally over a serial connection such as RS-232.
RTU–Remote terminal units are devices in the substation that are responsible for responding to requests from the control station.
SCADA–Supervisory control and data acquisition: A generic term for industrial control systems.
Control Station–Central locations used to coordinate control decisions for regions of the power grid.
TCP/IP–The Transmission Control Protocol and the Internet Protocol: Commonly used protocol combination in the Internet to address packets to processes and route segments to hosts.
CRC–Cyclic redundancy check: The CRC is used to detect bit errors that occur during communication.
Relay–A digital device that measures circuit status and can open/close a physical breaker.
PowerWorld–A steady-state power simulator.
14.1 Introduction*
The power grid is an important part of the infrastructure that helps us communicate, enjoy most modern comforts, and complete our day-to-day work. Essentially, without the power delivered in a reliable and safe manner, nothing would work. The United States is currently going through a power grid upgrade, termed the “smart grid.” While the existing architecture is by no means “dumb,” it is a heterogeneous mixture of old machines, new machines, old protocols, new protocols, and vastly different networks across various domains.
* Large portions of this work have been previously published as part of David Bergman’s M.S. thesis [1].
The power grid is an incredibly large, incredibly complicated network that combines both physical and cyber devices. The power grid consists of three main parts: generation, transmission, and distribution. The generation occurs at power plants and can derive from various sources such as nuclear, coal, or wind. The transmission lines are the high-voltage lines that run across the country, transporting energy from the generation facilities to the areas of consumption. Distribution occurs at a local level, serving as a step-down from the high-voltage transmission lines to the lower-voltage energy that is fit for the consumers. All three of these domains have their own issues, security, and so on. For instance, security at the generation sites involves armed guards, hardened firewalls, and so on. However, the larger concern is safety because a plant operating outside normal operating parameters poses a risk to personnel and machinery. In the distribution regime, a concern regarding the new smart grid is that of securing private data against disclosure. The transmission section of the grid is smaller in scale than the distribution side, but it has its own unique concerns. Much of the control systems that regulate the transmission lines are now highly connected, both to the control systems’ subsystems and to the Internet. This is an issue that must be addressed, and the research documented in this chapter has been a step forward in evaluating potential solutions to potential problems.
Traditionally, the grid has used Modbus over serial connections to communicate between devices. More recently, protocols such as DNP3 in the United States and IEC 60870-5 in Europe have been used to communicate over the long distances between substations and control stations. These protocols are also used to communicate between the substations and the remote terminal units (RTUs) in the field. Both in the United States and in Europe, the current trend in the substation itself is to use IEC 61850 to communicate. These current and future trends are discussed in the work by Mohagheghi, Stoupis, and Wang [2].
Changes to these protocols are part of an emerging awareness of the need for security in supervisory control and data acquisition (SCADA) systems, and the Department of Energy (DOE) is giving considerable attention to modernizing one of our country’s critical infrastructures (CI), the power grid. We have seen the effects of a power outage in many areas [3, 4 and 5], and the disastrous effects are exponentially worse at even larger scales. Blackouts have occurred for various reasons, be they mechanical failures, control failures, network failure, operator failure, or a combination. There are also realistic attack vectors—both cyber [6, 7 and 8] and physical [9]—that must be better understood before a potential attempt at exploiting them. Investigation of all of these failure modes will result in remediation techniques that can provide protection. Both independent researchers and government officials have formed workgroups and task forces [10,11] to investigate and offer their advice [12], but their suggestions must be tested and refined before they are implemented.
However, working directly with the power grid to conduct these investigations is a poor decision for multiple reasons. For the very same reason that the power grid must be made secure—that it is critical to the operation of the United States—modifications to the grid must not be done until adequate testing has taken place. As such, an important approach to studying cyber-security of the power grid is through test systems, so as not to interfere with operational systems. These test systems may use actual equipment to properly understand how the equipment will react in various situations. However, the scope of the power grid makes it infeasible to create a physical test system anywhere near its full scale.
Parts of this problem can be solved piece by piece, but to obtain a good understanding of how technologies interact in the grid, test beds play a crucial role. The Virtual Power System TestBed (VPST) aims to provide a national resource, whereby new technologies can be tested in a realistic environment, and clear feedback can be given about their efficacies. VPST is part of the Trustworthy Cyber Infrastructure for the Power Grid (TCIP) [13] project and supported by the National Science Foundation (NSF), the DOE, and the Department of Homeland Security (DHS).
Certain technologies, such as cryptography, would stand to gain a lot from detailed simulation. Cryptography research can take different forms in the SCADA environment. It can be used to investigate the practicality of retrofitting bump-in-the-wire devices between legacy devices [14], research various forms of key management [15], test the efficacy of using puzzles to confirm identity in a large-scale network [16], or examine protocols such as DNP3 with Secure Authentication [17] or DNPSec [18].
Unique requirements of the power grid motivate the work documented in this chapter. The massive scale of the power grid necessitates the use of a virtual environment that can match its scope. Other test beds such as Defense Technology Experimental Research (DETER) [19] will not scale well enough because of the dependence on physical SCADA hardware (as opposed to simulated SCADA hardware). OPNET-based simulators will not scale, because, unlike Real-Time Immersive Network Simulation Environment (RINSE), they do not support multiresolution simulation—a technique that allows highly scalable frameworks. Certainly, these test beds provide essential services and are not to be discounted. However, they do present a gap that we intend to fill with VPST.
The beginning of this chapter focuses on describing the SCADA simulation portion of VPST. First, we provide a brief background on the network communications simulator, RINSE, which provides the basis for our SCADA models discussed in Section 14.2 as well as the unique characteristics of the power grid. In Section 14.2, we also describe DNP3, one of the primary protocols used in SCADA, as well as attacks against DNP3 and the approach used to model it. Then, Section 14.3 discusses virtual hosts and the control flows for each of the SCADA-specific virtual hosts. Section 14.4 details the local lab enivronment and what each portion is capable of providing. Section 14.4.1 describes the steps we have taken to develop and validate our efforts to create the virtual test bed. Next, Section 14.5 describes a potential workflow for testing a new technology in the local test bed. Finally, we conclude in Section 14.6 while detailing some of our ongoing work.
14.2 Simulating DNP3
14.2.1 RINSE
The Scalable Simulation Framework (SSF) [20] is a framework that can be extended to support complex systems such as fluid dynamics, raytracing, and computer networks. Based on SSF, RINSE is a network simulator that serves as the basis for this research and has been through several iterations. RINSE is currently maintained by a team of developers working on the TCIP project at the University of Illinois. Developers are working on various topics including wireless communications, switch modeling, and intrusion prevention through game theory. RINSE has traditionally been used as a wireline network communications simulator to explore malicious behavior in the Internet—namely, worms, botnets, and denial-of-service attacks. The scalability that RINSE allows and the similarity of the Internet to the SCADA infrastructure make it a good candidate for simulating SCADA traffic.
RINSE has a number of properties that make it amenable to large-scale simulation. SSF enables highly parallelizable models by partitioning graphs into sub-models. These submodels, which compose the main model, are divided such that communication between them is kept to a minimum, which allows the maximal advantage of multicore systems. Also, RINSE supports multiple resolutions. That is, RINSE can calibrate the fidelity of a simulation to ensure that it runs in real time. It does this by providing a fluid model [21] for traffic and allowing both full-fidelity traffic and fluid models to exist within the same simulation. These fluid models exist for various components of RINSE such as transport protocols, routers, and links. These models also exist for modeling network topologies, and by utilizing these models, RINSE achieves a significant speedup over using a full-resolution model.
RINSE also supports simulation speeds that are faster than real time such that the simulator is not dependent on wall-clock time to advance the simulator time. This is important when interfacing with real devices through emulation. Instead of synchronizing with the wall clock, the simulator keeps track of its own timeline and, where possible, computes traffic ahead of when it will be needed. Combined with prioritizing emulated packets, RINSE can provide a large-scale simulation environment that is not slowed down by interacting with physical devices.
Additionally, RINSE is modular in such a way that new protocols and new models can be developed. By implementing new protocols through extending the base ProtocolMessage, RINSE can support the integration of existing or nascent protocols. Likewise, the ProtocolSession class allows us to develop new layers in the protocol stack. In the case of DNP3, for instance, the relays are derived from the ProtocolSession class and communicate with the data aggregators through messages derived from the ProtocolMessage class. The ProtocolSessions that comprise a host are indicated in a file by using the Domain Modeling Language (DML). DML describes a model as a tree of key-value pairs, and a file containing a DML model is passed to the simulation engine at runtime. These key-value pairs are then interpreted and used to derive the network topology, hosts, protocols, and traffic patterns. This allows RINSE to simulate any number of models without having to recompile, thus increasing the turnaround time between testing iterations of the same model.
To use RINSE to model the power grid, we must first define the protocol that virtual SCADA devices will use to communicate with one another. When simulating a new protocol or device, there always exists the question of how accurately we must model the proposed design. The option of tweaking parameters of a different model to estimate the new model rarely works because often there are fundamental features that do not lend themselves to be portrayed by a different model. For instance, we could hypothetically model the power grid as a purely Transmission Control Protocol/Internet Protocol (TCP/IP)-oriented network, with parameters such as poll interval, packet size, latency, and bandwidth set to portray the parameters present in the power grid. However, this would completely ignore the idiosyncrasies of the grid itself. For instance, if there is a vulnerability in the protocol specification or implementation, it would be agnostic to the network layout and configuration. In this manner, we can say that to capture the quirks and security assumptions of a protocol, we must model that protocol as accurately as the scale of the network permits. Here, we provide a brief overview of the three DNP3 layers.
14.2.2 DNP3 Overview
Designed to provide interoperability and an open standard to device manufacturers, DNP v3.0[22] has gained prominence in the U.S. electrical grid as the communication protocol among power grid equipment. Versions 1.0 and 2.0 were never released to the public. So as to not confuse this protocol with previous implementations, this chapter will refer to DNP v3.0 as DNP3. DNP3 is designed to operate in environments with a high electronics density. These environments can be fairly noisy, and therefore, DNP3 is designed to be as robust as possible with respect to detecting and recovering from error. Cyclic redundancy check (CRC) bytes are extensively used to detect when bits have been flipped and a small frame size (292 bytes) is used to localize errors and reduce the overhead imposed by resending frames.
The protocol was designed as a stack of three layers: the Data Link Layer, the Pseudo Transport Layer, and the Application Layer. The physical medium is generally either Ethernet or RS-485. Since these standards are common, DNP3 can be run over existing networks or networks can be built from the ground up to support DNP3 SCADA networks. The Data Link Layer can either be run directly on the physical medium or it can be encapsulated by other protocols as seen in Figure 14.1. This layer provides framing information and reliability. On top of the Data Link Layer is the Pseudo-Transport Layer. This simple layer is used to support fragmentation. Finally, the top layer is the Application Layer that acts on behalf of the user for requesting/confirming/sending/receiving requests and data.
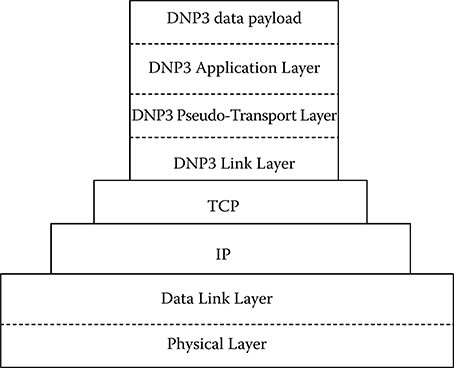
FIGURE 14.1 DNP3 Protocol stack encapsulated by Transmission Control Protocol/Internet Protocol (TCP/IP).
14.2.2.1 Data Link Layer
The DNP3 Data Link Layer is responsible for point-to-point communication. Essentially, what is contained in this layer is addressing. More specifically, the individual fields for this layer can be seen in the top portion of Figure 14.2. From this layer, we obtain information about the direction of travel, which party initiated the communication, whether the stream is on an odd- or even-numbered frame, and for what function the frame is going to be used. Finally, there is one byte for the length of the packet. This length is the number of bytes in the message disregarding the CRC bytes, which are computed against the first eight bytes.
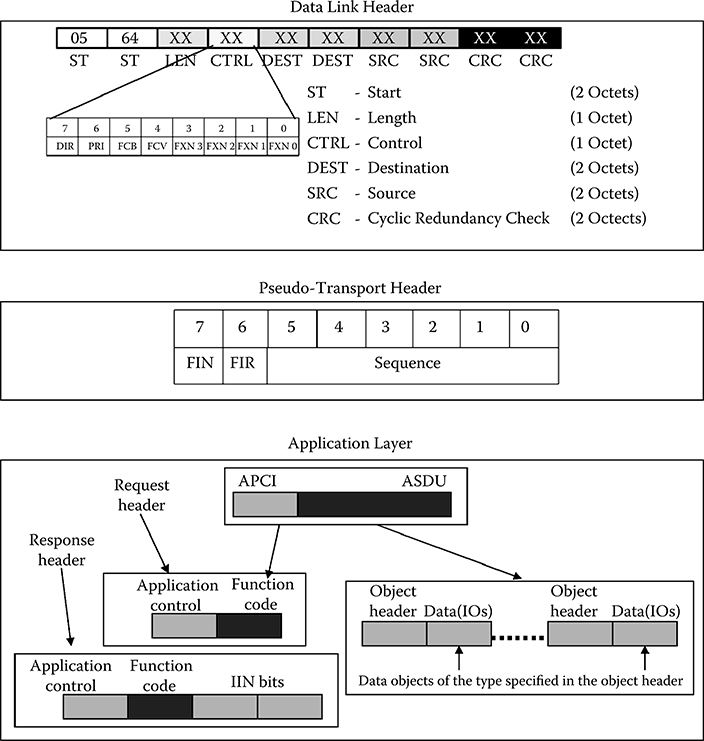
FIGURE 14.2 Three layers of DNP3. (Form DNP Users Group, DNP v3.0 Guide: A Protocol Primer, 2008. With permission.)
14.2.2.2 Psuedo-Transport Layer
This layer is responsible for the segmentation of the Application Layer into lower-level frames. It is a rather simple layer that consists of only one byte. As seen in the middle box in Figure 14.2, this byte is divided into three fields. The most significant bit, FIN, indicates whether this frame is the last in a sequence of frames that correspond to one Application Layer fragment. The second bit, FIR, indicates whether this frame is the first in a sequence of frames that correspond to one Application Layer fragment. For a message that can fit into one frame, both of these bits would be set.
The lower six bits act as the sequence number, which serves to detect dropped frames, out-of-order frames, and other such errors. Once the counter reaches 0×3F, it simply resets to 0. Further information can be found in the DNP3 specification for the transport function, volume 3 [24].
14.2.2.3 Application Layer
The bottom box of Figure 14.2 shows the Application Layer. The Application Layer is composed of two sections—the Application Protocol Control Information (APCI) and the Application Service Data Unit (ASDU). The APCI can either be a response header or a request header depending on the purpose of the packet. The fields in the APCI contain fragmentation information as well as a function code describing the purpose of the message. A response header also contains Internal Indications that are spread across 2 bytes as 16 separate bit fields. Their values are described here, but their general purpose is to indicate device status or provide an error message. Following this identification code in a response is any data that the master may have requested. Information can be found in the DNP3 specification, volume 2 [25].
14.2.3 Attacking DNP3
As one of the primary protocols used to transmit information in the power grid, it is important that we model DNP3 as accurately as possible. One reason for this is that there exist deficiencies in the protocol that allow it to be compromised. For instance, related work has developed a taxonomy to describe attacks against DNP3 that comprises 28 generic attacks (of which there are 91 specific instances) [26], thus showing how vulnerable the protocol is. Countermeasures for these holes could be tested in a simulation environment before becoming part of the standard. Other work has compiled a survey of SCADA-related attacks and discusses techniques such as attack trees, fault trees, and risk analysis as they pertain to CIs [27]. Indeed, much research has been done on both SCADA security gaps [12,28,29,30] and their countermeasures, including data set security [31], SCADA-specific intrusion prevention systems [32], and encapsulating DNP3 in another protocol such as SSL/ TLS (commonly used for secure internet communications, operating at layer 6 of the network stack) or IPSec (a less common protocol used for securing internet connections at network layer 3) [33]. In general, the power grid is susceptible to attack, and while the exact nature of these vulnerabilities is out of the scope of this chapter, this knowledge provides the impetus to model DNP3 accurately enough to reproduce the vulnerabilities in our virtual test bed.
14.2.4 Modeling DNP3
No matter the actual implementation of the protocol in the simulator, the protocol must be able to handle all three layers of the stack (Data Link, Transport, and Application). Inside the simulator, we treat the three layers as a combined payload to be transported by TCP/IP, and packets are routed using the IP header as opposed to the Data Link Layer header. However, when dealing with emulated packets, the Data Link source and destination fields are used to direct packets to and from the proper hosts. More information about this can be found in Section 14.2.3, which discusses how translation is done between the IDs of the virtual hosts and their emulated DNP3 addresses.
Dealing with emulated packets is an important concern for our use of this virtual DNP3 model. Being compliant with physical devices enables many potential use cases. Without external communications, the RINSE model would provide limited usefulness. It would provide background traffic, metrics regarding correctness and scaling of technologies, and insight into large-scale SCADA networks. However, by being interoperable with physical equipment, more use cases are available that involve a control station. This provides benefit by potentiating training with human-in-the-loop event analysis, incremental deployment analysis, and attack robustness analysis [34].
14.2.4.1 Approach
Instead of using a full-fledged implementation of the DNP3 stack, we model our own slightly abstract view because of a number of different reasons. The main reason is scalability. With the potential of modeling hundreds of thousands of relays, it would be intractable to model the full functionality of DNP3. Instead, by focusing on supporting two classes of reads, with only a few object types, and one type of command, we can simplify the control flow to enable quick computation and low-latency replies. However, if requested by a collaborator, the structure to extend the models to support extra function codes does exist.
Since the IP layer of our simulator provides routing, it would seem that we do not necessarily have to rely on the DNP3 Data Link Layer to route information from one device to another. We justify this by noting that industry is making a move toward encapsulating DNP3 to take advantage of its routing strengths. Some reasons that we choose to still include the Data Link Layer are that there may be unknown interactions between layers. For instance, if an adversary tampers with a field in this layer, the Application Layer may not function properly. Since some of the attacks mentioned in Section 14.2.3 directly attack the Data Link Layer, without modeling this layer, we would not know whether defenses properly address the vulnerabilities. Also, since our simulator has the capability to emulate nodes (i.e., representing a real host as a stub in the simulation), we must support communication with real hosts. All the pieces of physical equipment in our lab require a well-formed packet to function properly. If we fail to deliver that, then our simulation will not work.
14.2.4.2 Trade-offs
We have also made some decisions about the implementation of the protocol. One such decision that is left up to the vendor is how to implement the CRC function. We chose to implement it as a shift/accumulator, since this method has a constant calculation time. The table lookup method, on the contrary, is faster in the best case scenario but endures a penalty if the table is ever evicted from the cache. The RINSE implementation for this function was based on an algorithm released by the DNP3 User’s Group [35], with some modifications to fit within the RINSE framework. In general, when we had to make a decision like this, we decided to follow the industry norms.
While modeling the three layers as one layer can accelerate simulation time, it also means that DNP3 cannot be used on its own to provide any of its functionality. Currently, this is not a problem, but if there is a need to model DNP3 directly on top of the physical link, it would require a reworking of the DNP3 implementation. Additionally, it would require a rewrite to the way RINSE handles routing as it currently routes based on IP address. In illuminating these drawbacks, it is our hope that we have further illustrated the trade-offs of our design decisions. Where possible, speed and scalability have been optimized over other characteristics.
14.3 Virtualizing Hosts
To utilize the virtual DNP3 protocol, we now discuss the virtual hosts that use DNP3 to communicate with one another. A host is the term we give to nodes in the simulator that have some sort of computational power. That is, a host models some physical device. Namely, we have chosen to simulate data aggregators and relays. On the contrary, we have chosen not to simulate control stations because of a number of factors including their complex structure, their proprietary nature, and heavy customizability. Instead, we rely on our physical control station, which provides the added benefit of allowing a human to view the simulated network as part of an operational network. These virtual hosts represent a portion of the network that is purely cyber. The underlying electrical properties of this portion of the grid is simulated by PowerWorld—a commercially available power flow simulator, which we use due to its prevalent use in industry. To bridge the gap between PowerWorld and these hosts, we have implemented the State Server, which is discussed in Section 14.3.3.
14.3.1 Virtual Relays
Relays are responsible for control of physical lines as well as gathering data pertaining to their operation. Relays must determine various characteristics of these lines, such as phase angle, voltage, real and reactive power, and other such values. Additionally, relays must provide information about their own operation such as status values, counters, and synchronization efforts. It is unrealistic to support all of these features in a virtual relay, as that would severely hamper scalability. As such, it is important to determine which subset of features must be supported to provide the largest functional coverage at the lowest computational cost. The functionality that covers a large majority of typical requests is as follows:
Read Class X data—X can be 0, 1, 2, or 3. Different values of X represent different priorities, where 1 refers to data that changes the most often, and 3 the least. Class 0 data includes all data points. Since PowerWorld provides some of these values either directly or indirectly (through simple mathematical operations), this sort of data can be provided to the data aggregators at the substation level.
Turn breaker on/off—A request sent to the relay to turn on or off can then be passed on to the State Server.
When not processing a request, the relays are sitting idle. During this time, they are waiting for a data aggregator to issue a request. Currently, the relays support a limited subset of what their physical analogues support. The relay will thus determine if it can answer the request, and if it is either a data read request or a command, it will perform the required actions. If the request is a read, then the relay will retrieve data from the State Server through its own designated shared memory. If the data aggregator request is a command, the relay takes a corresponding action by writing to shared memory. The State Server is then responsible for forwarding this command to PowerWorld. Once the appropriate action is taken, the relay prepares a response. The response contains either the data or a confirmation, depending on whether the request was a data request or a command, respectively. Once sent, the relay reenters the idle mode and waits for the next request. Some of the difficulties of detecting events and issuing unsolicited responses are discussed in Section 14.6.2.
14.3.2 Virtual Data Aggregators
The virtual data aggregators have a control flow similar to that of the virtual relays. However, since they require data from the relays instead of PowerWorld, their polling patterns are somewhat different. Instead of sending out one data request per window, an aggregator will send out n requests per window, where n is the number of relays reporting to it.
The control flow for the master thread, seen in Figure 14.3, describes how the virtual data aggregator polls the relays for which it is responsible. First, the data aggregator waits t seconds before beginning the round of requests. Starting with relay 0, the data aggregator prepares a request and waits the appropriate amount of time that its physical analogue would take to produce the request. Then it sends the request and waits for the reply. Once it receives the response, the data aggregator then begins processing the command. Processing the command depends on which data were requested and how the response is formatted. In the basic scenario, the data supplied by the response is simply entered as a corresponding entry into a table, which can be queried by the control station. Once the response is processed, the data aggregator moves on to the next relay and starts the request flow again. Once the data aggregator has polled all of the relays in its list, it waits until the next polling period and resets the current relay to 0.
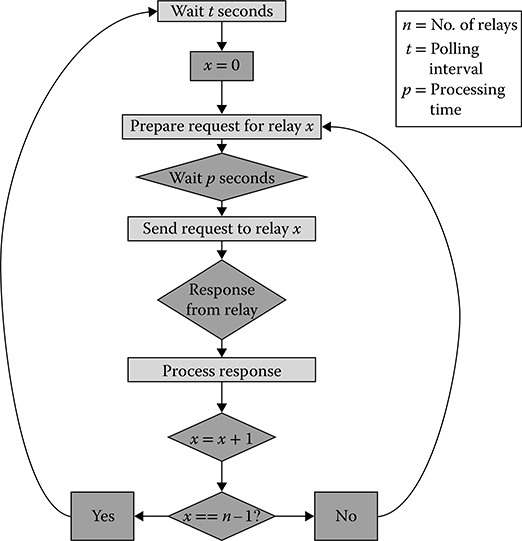
FIGURE 14.3 Data aggregator control flow (master thread).
The data aggregator also acts as a source of data for the control station. This responsibility is handled by the virtual data aggregator’s slave thread. The slave thread essentially acts as a server, remaining idle until it receives an incoming request from the control station. When it receives a request, it begins to process it. The data aggregator then makes a decision based on the function code in the request. If the function corresponds to a read, then the data aggregator will provide the requested data out of its table. If the function is a command, then the data aggregator passes the command to the correct relay and waits for a response. Once either the relay responds or the data is ready (depending on which function code was sent to the data aggregator), the data aggregator prepares a response to the control station. After this, the data aggregator waits for an appropriate delay, corresponding to the delay its physical analogue would take for preparing the packet. Finally, the data aggregator sends the response and goes idle.
14.3.3 State Server
The State Server acts as a single point of contact between the RINSE and the PowerWorld simulation environments. The same procedure that generates the DML file also generates a mapping between PowerWorld entities and the virtual relays that are assigned to monitoring them. Using this mapping, the State Server generates requests according to the PowerWorld Application Programming Interface (API). The requests are split into four different groups—lines, generators, loads, and shunts—which correspond to power grid components. After PowerWorld processes these commands, it sends back a response with the appropriate values.
PowerWorld was designed with a server thread, which can serve data to external applications, for which no DNP3 converter had been developed. Hence, we have created this State Server, which consists of four similar tasks being carried out in succession. Polling periods start by preparing a request for shunt values from PowerWorld. After waiting for a response, it processes the response and moves on to requesting generator values. The State Server then repeats the process for load and line values. Finally, the State Server waits t seconds before starting the process over again.
Once the data is transferred from PowerWorld to RINSE, it is the responsibility of the State Server to partition the data. Depending on which values were requested, the amount of data a relay will receive can vary from five to nine bytes total. Then, the State Server splits up the response into appropriately sized portions and shares them with the relays through shared memory.
This choice of using shared memory as opposed to explicitly passing a message with the data was made to better represent the practical circumstances. Its sole role is to deliver data from PowerWorld to the virtual relays, and since the State Server has no physical analogue, its latency should be no greater than the time it takes for a relay to measure the line it is connected to—essentially zero. Transmitting this information over the routing network would introduce latency into the system that has no real world analogue.
14.4 Development and Validation
14.4.1 Lab Setup
To connect our complete virtual SCADA system to physical devices, we rely on the generosity of several donors, who have donated a number of SCADA devices, software, and technical support. VPST currently utilizes two SEL-421 relays, an SEL-3351 data aggregator, and a workstation running the OSI Monarch OpenView Energy Management System (EMS) software suite [36]. The relays are each attached to an Adaptive Multichannel Source (AMS) that supports lab testing of Schweitzer Engineering Laboratories (SEL) devices by providing sinusoidal waveforms that feed into the relays.
Our communications simulator, RINSE, provides the SCADA simulation for our local lab environment. Its components have been described in Sections 14.2.1 and 14.3. Using these components, we can generate any desired topology. Shown in Figure 14.4 is a simple topology that includes a virtual control station proxy, multiple substations with one data aggregator each and multiple relays per substation, and a State Server that communicates with a virtual PowerWorld proxy. The PowerWorld proxy is directed through emulation to a computer running PowerWorld, which runs a steady-state power simulation. PowerWorld has an API that can interface with external devices using its proprietary protocol. In this figure, we do not show PowerWorld interfacing with anything besides RINSE, although the capability is there, and may be beneficial to certain use cases.
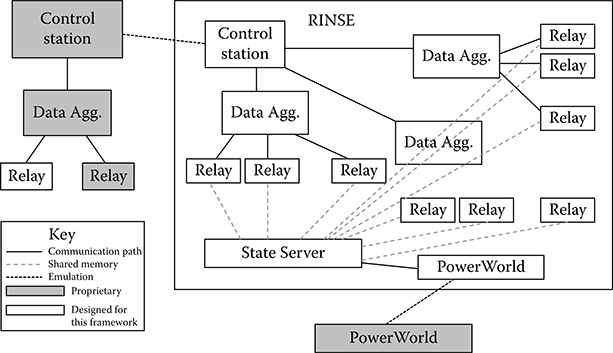
FIGURE 14.4 Simulation framework.
To provide emulation support, we also utilize proxies hosted on physical machines. Although they are not shown in Figure 14.4, our setup would not function without them. Since RINSE operates on its own virtual private network, to direct traffic toward one of the virtual nodes, the traffic must originate from within that virtual private network. To allow external traffic passing, RINSE comes equipped with a gateway that supports OpenVPN connections. >From a workstation, we connect using an OpenVPN client to the OpenVPN server on RINSE’s host machine. This allows a physical machine to be in the same private address space as the virtual machines. Once this connection is complete, we can redirect this proxy machine’s incoming traffic to any destination inside RINSE. We also can redirect any traffic that arrives on the private network address to physical computers. In this manner, the State Server can communicate with PowerWorld in both directions. Also, by redirecting different ports to different addresses, we can allow the Control Station to poll any device in RINSE.
The lab is on a switched network, which provides two useful capabilities. The first is that we can use WireShark to examine traffic between all of these hosts. This allows us to troubleshoot communications between the devices, which is important since the relays only support maintenance through telnet. For instance, if we notice that the control station is no long updating, we can pinpoint the break in communication. In addition, it also allows us to inspect the packets themselves. This has proved helpful for meeting timing requirements as well as modeling both the DNP3 and the virtual hosts.
When building a system such as this test bed, fidelity is an important concern. That is, the system must perform in the same manner as the operational analogue. There are varying degrees of fidelity, and development of this system has gone through phases addressing different levels of fidelity. First, the system must interact with physical equipment in such a way that the physical equipment does not realize that it is operating inside a partially virtualized environment. This is termed interoperability. Second, the virtual hosts must accurately reflect characteristics such as response times and accuracy of data. This can be achieved by tuning the corresponding parameters. Third, verification must be run on the virtual system itself to ensure that no race conditions exist in the modeling code. Finally, since SCADA network information is closely guarded, an expert must be brought in to verify that the virtual network reflects a practical network. The following process should serve as a guideline for incorporating new virtual hosts into our framework.
14.4.2 Interoperability
The first goal in creating a virtual host is allowing it to communicate with an external device. Reaching this goal requires several steps. First, we create a new virtual host that receives a transmission and responds with a hard-coded message. This hard-coded message can be devised by examining traffic between physical devices. For instance, when devising responses for virtual data aggregators, we look at requests from the actual control station to the actual data aggregator and copy the response. With this model, it allows us to test the communication channel. The communication channel, which is made up of the virtual networking stack, a virtual proxy, a physical proxy, a physical routing network, and a physical end-host, can have some robustness issues that must be resolved before experimenting with a more dynamic response. Once the physical end-host receives and successfully decodes the hard-coded message, we consider this stage a success.
The next step is to generate responses dynamically. To do this, there are two steps. The first step is to create a virtual analogue of the physical protocol. In this case, the protocol is DNP3.0 encapsulated by TCP/IP. Within RINSE, this is represented as a ProtocolMessage with a corresponding ProtocolSession. The ProtocolMessage class contains member data to correspond to each of the fields specified in Section 14.2.2. When communicating with a physical host, the class structure must be converted to a byte stream and there are functions that perform this for both directions. Additionally, there is a helper function to compute and interpose the CRCs when converting to a byte stream.
After the protocol is implemented, the next step is to produce the dynamically generated message with static data. To do this, we extract the DNP3.0 request, convert it to a DNP3.0 ProtocolMessage, and process it. The control flow has been discussed in Section 14.3.2.
Once we ensure that the virtual data aggregator is able to correctly generate a response with static data, it is time to generate a response with dynamic data. For the control station to observe a changing environment, responses from the data aggregators must reflect a changing environment. Therefore, each of the relays must also derive its state from a changing environment. Each could poll PowerWorld independently, but this would not scale well. Instead, we chose to implement a single point of contact—namely, the state server. In this manner, we eliminate costly overhead by compressing multiple requests and responses into one.
14.4.3 Tuning Parameters
Once we have a generalized virtual model, it can be tuned to represent any number of physical analogues. By tuning parameters such as polling interval, polling pattern, and response time, we can model various types of data aggregator computers. New features could also be added by specifying them in the DML without designing brand new virtual data aggregators. Virtual relays do not have any polling interval (the data is already available upon receiving a request); however, they can be matched to their physical analogues by changing their response time. Were a virtual Modbus protocol created, another parameter in DML could be specified for protocol support. If a new physical device cannot be modeled by changing some of these parameters, then either altering the model or creating a new device class would provide the necessary functionality.
14.4.4 Expert Analysis
Because of the critical nature of the power grid operations, it is difficult to acquire network topologies. It is also difficult to acquire the designs for SCADA devices from their vendors. In addition to creating models based on observation of the lab devices, some power experts in TCIP have offered their expertise. According to them, aspects such as polling patterns and the parameterization of virtual models appear to be sufficient. Network topologies can be managed through DML files and do not require RINSE development access. The topology described in Figure 14.4 is simplified, but accurate enough to start security analysis. The two suggested topics to be tackled next are expanded functionality of the meters and extra virtual models for other devices. However, this ought to be done on a case-by-case basis as model development consumes time and resources. For current models, there exist enough parameters to allow an experimenter to model a device without delving into the RINSE source code, but future models may require extensive familiarity with the simulation engine.
14.5 Sample Workflow
Now that we have demonstrated a fully functional test bed, when a third party wishes to collaborate with us, we will use a workflow similar to the following.
14.5.1 Create the Basic Network
The first step in the process is to design a power network that exhibits traits that may be of interest. Someone who is knowledgeable of a typical power grid network will design this, as their knowledge should translate into a realistic representation. One such power network can be seen in Figure 14.5, which shows a power transmission network system for a large city, as displayed by PowerWorld. The long lines are transmissions lines that transmit power between buses, which are the short lines with dots in the figure. Connected to the buses are generators and loads, represented by the circled arrows and ground symbols, respectively. PowerWorld itself offers many tools for designing, interacting, and assessing power flow models. For the purpose of VPST, the important features that it offers are the abilities to manually create and export a design as well as support a real-time simulation.
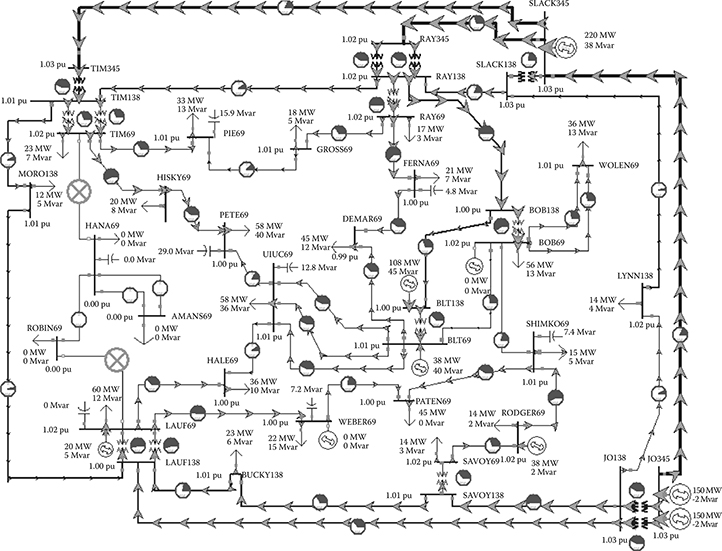
FIGURE 14.5 PowerWorld sample design.
From the PowerWorld simulation, key information will be extracted. Typically, these are the IDs of lines, buses, generators, shunts, and loads. From here, we generate the DML and EMS configuration as well as set up the proxies. The corresponding RINSE model is shown in Figure 14.6. From the PowerWorld view, 36 buses and 196 distinct connections were found. These distinct connections have been categorized into lines, loads, generators, and shunts and are then represented by relays in the DML. As can be seen in the zoomed-in box in Figure 14.6, the relays are then annotated to provide a reference point in the PowerWorld model. Likewise, the corresponding EMS configuration in Figure 14.7 shows a list of RTUs (i.e., data aggregators) that the EMS is aware of and is able to poll for data. Currently, configuring the EMS is done by hand, but efforts are under way to automate this process as well.
This portion of the workflow is set up to be as automatic as possible. There are scripts to extract the information from PowerWorld, to create the DML model and its corresponding routing information, to log in the proxy machines and set up the redirects, and to produce the control station configuration file. Future efforts are ongoing to reproduce the entire lab setup in another location, provided similar resources exist there as well.
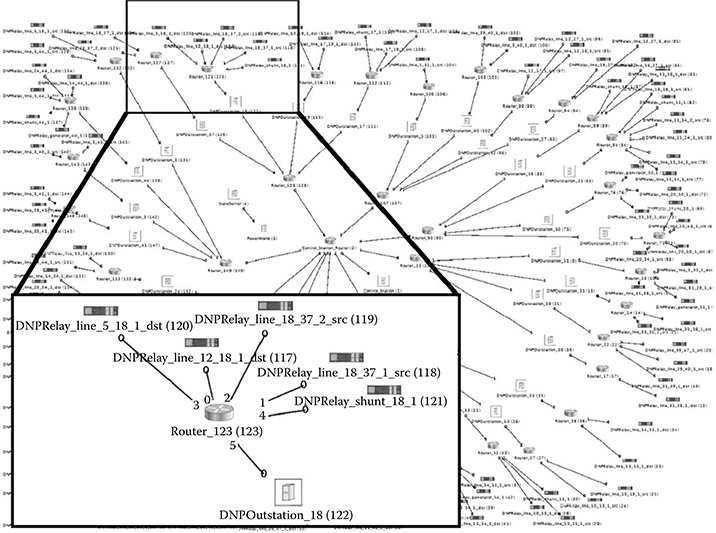
FIGURE 14.6 Corresponding Real-Time Immersive Network Simulation Environment view.
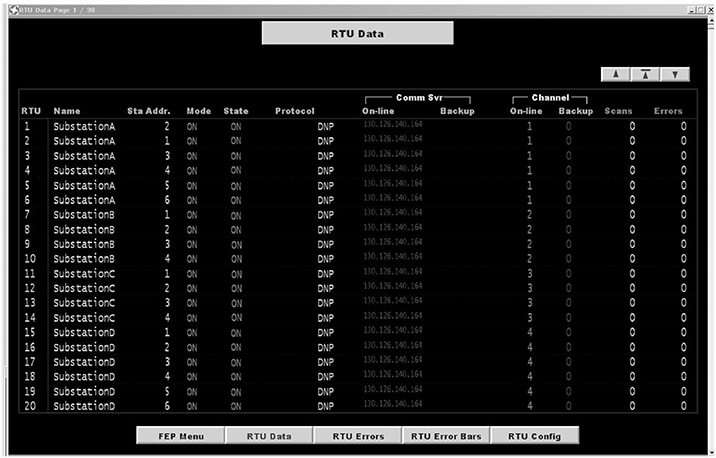
FIGURE 14.7 Corresponding Energy Management System (EMS) view.
14.5.2 Integrate New Technology
To integrate a new technology into the framework, there exist two options. The first option is to provide a stand-alone device or model that can be accessed through a network device. By doing this, the actual technology is tested, as opposed to a recreation. The way in which this is done is similar to how the State Server receives its values from PowerWorld (see Section 14.3.3).
The other option is to incorporate a model of the technology directly into RINSE. When using this option, the two parties will develop an accurate model of the new technology, whether that is a protocol or a bump-in-the-wire device or anything else. RINSE is written in C++ and as such can accept a C++ implementation of the new technology. The original implementation must be ported to C++, allowing some modifications to provide networking support inside RINSE. Further efforts are planned to make RINSE as modular as possible, to ease extensibility for cases such as this.
There are trade-offs to consider here, which must be evaluated on a case-by-case basis. For instance, in the C++ implementation case, there are issues of fidelity and time of development. It takes time to develop a model and ensure that it corresponds to the actual technology. There are also issues of ensuring that the C++ model is in lockstep with the current iteration of the product. In the emulation case, there may be issues of scalability, latency, and availability of measurement data. If time allows, implementing the technology directly inside of RINSE will usually allow for better results, as the full benefit of scalable simulation can be realized.
14.5.3 Evaluate Experiment
Once all of the connections are set up and the entire communication flow is shown to be working, it is time to test the technology in silico. During the course of the experiment, it is possible to interact with the model and test how it reacts to certain commands. For instance, the EMS software can provide a place for an operator to monitor the grid. Depending on the new technology, it may become easier or more difficult for the operator to understand what is happening in the system. For instance, new technology implemented in RINSE may simplify the job of the operator so that fewer errors occur. On the contrary, it may accidentally drop communication under certain conditions. PowerWorld can offer information about the performance of a new technology. For instance, if a command sent from the EMS never produces a change in PowerWorld, this can be seen quickly in PowerWorld and traced to its root cause in RINSE by looking at metrics such as bandwidth usage, dropped packets, and average latency, or by using tcpdump for postmortem evaluation. From there, RINSE supports quick turnaround time through network creation at runtime, easily configurable network topologies, and immediate feedback.
14.6 Concluding Remarks
14.6.1 Conclusion
In this chapter, we have discussed the development of virtual models for DNP3.0, data aggregators, and relays within the RINSE framework. These models are important as they provide a realistic environment in which experimentation on emerging power technologies can take place. The smart grid and its related technology are being integrated into the existing grid at a rapid pace and with little validation. We must understand how this new technology affects existing technologies and infrastructure. By utilizing the models discussed above, we provide such an environment to test these technologies. To provide a realistic simulation, the virtual relays acquire data from PowerWorld, a power flow simulator, through a virtual host termed the State Server. This State Server captures snapshots of the electrical simulation and provides them to the virtual relays through shared memory. By enabling real-time information to be passed through our SCADA simulation, RINSE provides a platform for testing new technologies in a scalable, high-fidelity manner. A sample workflow that shows the steps that are required to verify the functionality of a new technology was presented.
14.6.2 Future Work
One area that must be modeled is report-by-exception polling. This can come in two flavors. The first is a polled report-by-exception, which is a poll that only asks for data that has changed. Another form is unsolicited report-by-exception. This allows a relay to send a message if something has changed state, without being asked to do so. This type of reporting is also currently unimplemented, but would require greater effort because of the nature in which the State Server is implemented. Without having access to the actual grid, but through the advice of experts, it seems as though relays support report-by-exception, but often do not use it as resources may be better spent on real-time monitoring. In any case, this seems like a natural feature to implement.
The DNP Users Group has published test procedures for Levels 1 and 2, the simplest implementations. Future work should ensure that the virtual models developed in RINSE pass these tests, or at least that subportions of these tests are deemed relevant to the demands of the experiment. Models may be introduced that conform to varying levels of these tests, so as to provide certain guarantees regarding both fidelity and performance.
One area of concern is that of clock skew among the relays. As implemented, the State Server receives values in chunks. All data within a given chunk has occurred during the same time slice. However, in the physical grid, data from separate relays are never guaranteed to occur during the same time slice. This is the type of problem that synchrophasor technology [37] is attempting to solve. However, the question of how, or even whether, to simulate this effect will require some examination. Again, this raises the question regarding fidelity versus performance. To simulate this clock skew, the state server must query each data point separately and provide randomization in the timing as well. This overhead may impact the performance of the simulation as well as the freshness of the data.
References
1. Bergman, D. C. 2010. “Power Grid Simulation, Evaluation, and Test Framework.” Master’s thesis, University of Illinois at Urbana-Champaign, Champaign, IL.
2. Mohagheghi, S., J. Stoupis, and Z. Wang. 2009. “Communication Protocols and Networks for Power Systems—Current Status and Future Trends.” In Power Systems Conference and Exposition, 2009. PSCE ’09. IEEE/PES, IEEE, pp. 1–9, March 2009.
3. Pacific Northwest National Laboratory (PNNL). Looking Back at the August 2003 Blackout. Available at http://eioc.pnnl.gov/research/2003blackout.stm. Accessed February 2010
4. Andersson, G. et al. 2005. “Causes of the 2003 Major Grid Blackouts in North America and Europe, and Recommended Means to Improve System Dynamic Performance.” IEEE Transactions on Power Systems 20 (4): 1922–28.
5. Corsi, S., and C. Sabelli. 2004. “General Blackout in Italy Sunday September 28, 2003, h. 03: 28: 00.” In IEEE Power Engineering Society General Meeting, 2004, IEEE, pp. 1691–702.
6. Bompard, E., C. Gao, R. Napoli, A. Russo, M. Masera, and A. Stefanini. 2009. “Risk Assessment of Malicious Attacks against Power Systems.” Transactions on Systems Man and Cybernetics. Part A 39 (5): 1074–85.
7. Fernandez, J. D., and A. E. Fernandez. 2005. “SCADA Systems: Vulnerabilities and Remediation.” Journal of Computing Sciences in Colleges 20 (4): 160–68.
8. Igure, V. M., S. A. Laughter, and R. D. Williams. 2006. “Security Issues in SCADA Networks.” Computers & Security 25 (7): 498–506.
9. Salmeron, J. et al. 2004. “Analysis of Electric Grid Security Under Terrorist Threat.” IEEE Transactions on Power Systems 19 (2): 905–12.
10. Department of Energy Smart Grid Task Force. 2007. Available at http://energy.gov/oe/technology-development/smart-grid/federal-smart-grid-task-force.
11. U.S. National Institute of Standards and Technology (NIST). 2010. Smart Grid Interoperability Standards Project. Available at http://www.nist.gov/smartgrid/
12. U.S. National Institute of Standards and Technology (NIST). 2009. Smart http://www.nist.gov/smartgrid/ Grid Cybersecurity Strategy and Requirements. Available at http://www.naseo.org/eaguidelines/documents/cybersecurity/NistIr-7628%20smart%20grid.pdf
13. UIUC. 2010. Trustworthy Cyber Infrastructure for the Power Grid. Available at http://tcipg.org/
14. Tsang, P., and S. Smith. 2008. “YASIR: A Low-Latency, High-Integrity Security Retrofit http://tcipg.org/ for Legacy SCADA Systems.” In Proceedings of The IFIP TC 11 23rd International Information Security Conference, Milano, Italy pp. 445–59.
15. Piètre-Cambacédès, L., and P. Sitbon. 2008. “Cryptographic Key Management for SCADA Systems—Issues and Perspectives.” In ISA ’08: Proceedings of the 2008 International Conference on Information Security and Assurance (isa 2008). Washington, DC pp. 156–61.
16. Bowen III, C. L.,T. K. Buennemeyer, and R. W. Thomas. 2005. A Plan for SCADA Security Employing Best Practices and Client Puzzles to Deter DoS Attacks. Presented at Working Together: R&D Partnerships in Homeland Security, Boston, Massachusetts.
17. DNP Users Group. 2010. DNP3 Specification, Secure Authentication, Supplement to www.dnp.org, Volume 2. Available at www.dnp.org
18. Majdalawieh, M., F. Parisi-Presicce, and D. Wijesekera. 2006. “DNPSec: Distributed Network Protocol Version 3 (DNP3) Security Framework.” In Advances in Computer, Information, and Systems Sciences, and Engineering: Proceedings of IETA 2005, TeNe 2005, and EIAE 2005. Springer, Netherlands, pp. 227–34.
19. Benzel, T., R. Braden, D. Kim, C. Neuman, A. Joseph, K. Sklower, R. Ostrenga, and S. Schwab. 2006. “Experience with DETER: A Testbed for Security Research.” In 2nd International Conference on Testbeds and Research Infrastructures for the Development of Networks and Communities, 2006. TRIDENTCOM 2006, IEEE, pp. 10.
20. SSF. Scalable Simulation Framework. 2004. Available at http://www.ssfnet.org/home-Page.html. Accessed January 2010.
21. Nicol, D., M. Goldsby, and M. Johnson. 1999. “Fluid-Based Simulation of Communication Networks Using SSF.” In Proceedings of the 1999 European Simulation Symposium, vol. 2, Erlanger, Germany.
22. DNP Users Group. 2010. DNP: Distributed Network Protocol. Available at www.dnp.org
23. DNP Users Group. 2008. DNP v3.0 Guide: A Protocol Primer. Available at www.dnp.org
24. DNP Users Group. 2002. DNP3 Specification Volume 3: Transport Function. Available at www.dnp.org
25. DNP Users Group. 2005. DNP3 Specification Volume 2: Application Layer. Available at www.dnp.org
26. East, S., J. Butts, M. Papa, and S. Shenoi. 2009. “A Taxonomy of Attacks on the DNP3 Protocol.” In Critical Infrastructure Protection III, IFIP Advances in Information and Communication Technology, vol. 311, Springer pp. 67–81.
27. Ralston, P. A. S., J. H Graham, and J. L Hieb. 2007. “Cyber Security Risk Assessment for SCADA and DCS Networks.” ISA Transactions 46 (4): 583–94.
28. Patel, S. C., and Y. Yu. 2007. “Analysis of SCADA Security Models.” International Management Review 3 (2): 68–76.
29. Faruk, A. B. M. O. 2008. “Testing & Exploring Vulnerabilities of the Applications Implementing DNP3 Protocol.” Master’s thesis, Kungliga Tekniska högskolan Stockholm, Sweden.
30. Hong, S., and S. J. Lee. 2008. “Challenges and Pespectives in Security Measures for the SCADA System.” In Proceedings of 5th Myongji-Tsinghua University Joint Seminar on Prototection & Automation. IEEE
31. Mander, T. et al. 2009.“Power System DNP3 Data Object Security Using Data Sets.” Computers Security 29 (4): 487–500.
32. Rrushi, D. J. L., and U.S. di Milano. 2006. “SCADA Intrusion Prevention System.” In Proceedings of 1st CI2RCO Critical Information Infrastructure Protection Conference. Springer-Verlag Berlin, Heidelberg.
33. Graham, J. H., and S. C. Patel. 2004. “Security Considerations in SCADA Communication Protocols.” Technical Report TR-ISRL-04-01, Intelligent Systems Research Laboratory, Department of Computer Engineering and Computer Science, University of Louisville, Louisville, Kentucky, September 2004.
34. Bergman, D. C., D. Jin, D. M. Nicol, and T. Yardley. 2009. The Virtual Power System Testbed and Inter-Testbed Integration. In Proceedings of the Conference on Cyber Security Experimentation and Test (CSET), pp. 1–6. Berkeley, CA: USENIX Association.
35. DNP Users Group. 2002. Guide to Calculate DNP CRC. Available at www.dnp.org
36. OpenView: Graphical User Interface. 2009. Available at http://www.osii.com/pdf/scada-ui/OpenView_PS.pdf
37. Schweitzer, E. O., and D. E. Whitehead. 2007. Real-Time Power System Control Using Synchrophasors. Presented at 34th Annual Western Protective Relay Conference, IEEE, October 2007.