
10 Primary Distribution Planning and Engineering Interactions
10.1 INTRODUCTION
This chapter is in essence a continuation of Chapter 9’s discussion about engineering paradigms and methods. Here, the focus is on the distribution system. The power distribution system (primary feeder system) accomplishes more of the power delivery function in most electric utility systems than any other level of the system. Power is routed into a few locations in fairly large amounts, and the distribution system then routes and sub-divides that power into smaller allotments delivered to many different locations. No other layer of the power system accomplishes so much dispersion over area or so much sub-division of power from large to small.
The primary distribution level also has more impact on customer power quality than any other layer. It is both immediately downstream of the lowest-level voltage regulation equipment in the system (substation voltage regulators or load-tap changers), and by the nature of its topography, the source of the majority of voltage drop that the customer sees. That topography also means that the majority of outages that the customer sees are caused by the distribution system – there are simply more miles of exposed line at jeopardy to weather, accident, and random failure. Thus, in most systems, the distribution system is the source of the majority of both the voltage-related and availability-related power quality problems seen by energy consumers.
This alone would guarantee that distribution should receive a good deal of attention anytime a utility needs to improve reliability, as for example when hard pressed by aging infrastructure issues.
However, the distribution system is also a resource that can be used to bolster reliability of the entire system: if combined artfully with the sub-transmission – substation level designs, can result in improved performance in terms of “bang for the buck.” Such planning requires, as was the case in Chapter 9, engineering methods different from traditional approaches, but methods that are proven, and widely available.
This chapter will begin with a look at distribution, the approach to its planning and operation that is typically taken in the industry, and what can be accomplished by making a shift to a different way of looking at and engineering the distribution system, all in Section 10.2. This will introduce two key concepts. First, the use of the distribution system to bolster reliability at the substation area through a built-in ability to transfer large loads between substations. Second, the use of marginal benefit-cost ratio balancing as an optimization tool in power system planning. Together these lead to a much improved cost effectiveness of the entire system. Section 10.3 will then summarize the engineering of distribution layout – how the spatial or geographic configuration of trunks, branches, and switching can be used to build a distribution system that has the characteristics needed. Many distribution engineers are unaware of the extent to which this aspect of distribution systems can be engineered. Section 10.4 concludes with a summary of key points.
10.2 DISTRIBUTION PLANNING AND THE PERCEIVED ROLE OF DISTRIBUTION
At its most basic, a power distribution system must be designed to deliver power over wide areas while maintaining reasonable voltage drop, and with some means of providing redundancy (contingency switching) should any one flow pathway fail. Naturally, it is desirable to perform this function at the lowest cost compatible with providing satisfactory power quality within standards. This defines the traditional goal of power distribution planning, and reflects the traditional viewpoint on the role of power distribution system.
During the early to the mid-20th century, every utility developed its own distribution planning method to satisfy these needs. At each utility these evolved during subsequent decades into very tight institutionalized standards for “the way we do things.” In many cases, these were nearly inflexible “template” or “cookie-cutter” approaches to layout style, conductor size set, and switching zone and conductor sizing. In all cases, they resulted in a distribution system that adequately fulfilled the traditional needs of distribution well enough to get by. The system routes power from substations to customers without violation of voltage, loading or power factor standards. It does not cost too much. It is serviceable and expandable as needed in the future.
Remarkably, these approaches to distribution differ substantially among utilities, although all those distribution systems used the same components and equipment and all fulfill much the same role. At many utilities, power distribution planning is very parochial, built upon principles developed in-house decades ago, lacking any external influence, and never comprehensively re-examined and revised with respect to modern needs. The reasons have a lot to do with the distribution aspect of the utility business. Compared to utility’s transmission planners, distribution planners seldom have to interact with neighboring utilities through intertie meetings or power pool planning groups. They are seldom exposed to the different ideas and their particular design habits and guidelines can be challenged as that could be improved. “We do it differently.”
As a result, nothing is quite as tightly institutionalized, nor varies quite as much, throughout the power industry, as the quality of distribution planning. As an example, one large IOU in Florida has standards for conductor policy and feeder layout that are the exact opposite in several regards of the practices at a large IOU in the western United States. What is required at one utility is not permitted at the other. In fact, neither utility is correct – both paradigms are appropriate in some cases, but not all. A more effective and lower cost system results when flexibility is introduced into the design: when layout, switching, and conductor sizing are engineered, rather than designed by guideline. Section 10.3, later in this chapter, will summarize several concepts related to such engineering.
Frankly, engineering of a distribution system so that it performs the basic electrical functions that were traditionally required of it (i.e., electrical flow within standards, feasible manual switching capability for contingencies) is rather straightforward. At many utilities, this was done for decades with a standardized layout rule, a set of tailored nomographs and tables and some rough calculations (slide rules at best), all guided by a series of rote-memorized rules of thumb. When digital computers became available, load flow computations and spreadsheet-level tools were adapted by each utility to its particular distribution paradigm. The basic concepts underlying each utility’s method -- how things are done and the fact that the engineering is largely based on a set of inflexible rules – remained in place.
Both because adequate distribution planning is so straightforward to do, and because it is done at many utilities with the fairly straightforward template-guideline-type of approach, one often hears the terms “it isn’t rocket science” applied to distribution planning. This belief that distribution is easy to plan, and that significant and high-expertise effort is wasted in its engineering, is exacerbated by the facts that distribution is of relatively low voltage compared to other parts of the power system, that the equipment involved is small and inexpensive (compared to other levels) and, that the system is normally laid out in radial form (which makes power flow easy to calculate). All of this tends to make distribution seem simplistic, and in fact it is, if viewed only from the traditional perspective, that the task is just to “get it so it works.”
Distribution Can Be Asked To Do A Lot More
However, that traditional interpretation of the distribution system’s job is obsolete and incomplete with respect to modern societal needs and technical capabilities. When reliability of supply is a major performance metric, and when cost must be minimized, not just kept within traditional bounds, distribution planning becomes very challenging. The important point to realize, however, is that the effort required meeting this challenge more than pays for itself: the gap between the performance of really good distribution systems, and merely “adequate” ones, is immense. This gap manifests itself in two ways:
• Economics: Advanced engineering and flexibility of approach can yield considerable reduction in cost.
• Reliability: The potential of the primary system to maximally contribute to improved reliability is partially untapped in the vast majority of cases.
A key factor in both is that the distribution system is both engineered well (optimized) and its design is coordinated carefully with that of the sub-transmission and substation levels in ways not traditionally done.
Table 10.1 (same as Table 1.3) shows the results generated by this approach at nine utilities with which the authors have worked As a group these utilities are reasonable representatives of the power industry throughout North America. Together they demonstrate both the margin of improvement that can be expected by updating and modernizing primary distribution planning and design paradigms, and the substantial variation in improvement and type of improvement that can be seen from one system to another.
Table 10.1 lists four statistics for each system. The first, “Electrical - $,” is the reduction in overall (lifetime) cost of distribution that could be wrought with respect to the traditional primary distribution paradigm of moving power. This is the saving in new capital additions that results from improving how the distribution system is designed to do its job – moving power with good reliability of service.
The second statistic, “Existing - $” shows how much the utilization of an existing distribution system can be economically improved with respect to that traditional paradigm. Existing systems encompass both the good and bad points of their past engineering and design, and those systems cannot be thrown away and re-designed based on new, improved guidelines. However, improvement can be made in the MW/$ capability of these systems. But such improvement is only valuable where useful (if one improves a 5.0 MVA feeder so it can carry 5.4 MVA, the increase is useless unless it is in an area where one needs a .4 MVA increase in capability). The values shown in Table 10.1 reflect both what is possible and what was found useful in each system.
Table 10.1 Improvements in Distribution System Cost and Performance Derived from Revision of Traditional Design Guidelines and Engineering Methods
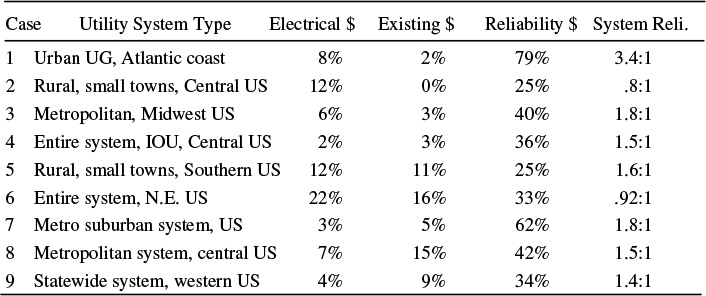
The third statistic, “Reliability - $,” represents the reduction in the cost of improving reliability that was attained by revising design guidelines and applying the most effective reliability-based planning and engineering methods to these systems. These improvements while rather dramatic, are typical. As stated earlier, distribution systems are simply not designed from a reliability standpoint. When this is done and the engineering is optimized, the results are a very considerable improvement.
The final statistic “System Rel .(Reliability)” represents the margin in “bang for the buck” that the revised distribution reliability improvement made over the existing cost of improving reliability that was in effect before the revision. This statistic goes to the heart of the use of distribution as a resource in aging infrastructure areas, and of the authors’ overall theme of using all of the power system chain optimally to obtain the greatest “bang for the buck.” In four of the six cases listed, reliability improvement was between 20% and 40% less expensive to buy at the primary level than at other levels of the system. In these cases, spending on the distribution system could deliver reliability improvement for less cost than spending on other levels of the system.
In two other cases, this was not the case, and the value shown is negative. Of note here is that the utilities were unaware of this entire issue, because the traditional tools they were using for the design of all three levels were not capable of directly engineering reliability or of even measuring such things as reliability improvement per dollar. Thus, in all cases, improvements between 9% (1/.92 – see final column) and 70% were possible by adopting reliability-based engineering methods and using them well at the distribution system and for coordination of design among the distribution and sub-transmission-substation levels.
A Quantum Difference in “Bang for the Buck”
Table 10.1 made it clear than revision of distribution system guidelines and adoption of reliability-based engineering methods often (actually in all cases the authors know of) provides a good improvement. The increases in cost effectiveness of 10% and 6% versus the traditional distribution function are noticeable and quite valuable. However, it is the improvement from the “modern perspective” – that which views distribution’s role as one of both performing the electrical duties and fitting into the optimum reliability versus cost structure of the entire system – where the improvement represents a quantum leap. By looking at the distribution system as a reliability resource, and optimizing its use for that purpose, an average 40% increase in cost effectiveness of reliability improvement is obtained at the distribution level. By coordination with the planning and design of other levels of the system, a 70% increase in overall effectiveness of money spent on reliability improvement is achieved.
The authors are aware than many readers, particularly some with long experience as distribution planners at power delivery utilities, will dispute that the improvements shown are real (they were), or will argue that that their system is different (not likely,) and that “it won’t work here” (it will). The six cases shown are all real utilities implemented long enough in the past that time has proven the expected savings and performance increases to be valid.
The 6% and 10% savings against normal needs come about because modern techniques can find better ways to reduce costs than the formalistic methods of the past. But the quantum gains in reliability and reliability improvement per dollar come from the fact that because of its dispersed nature, the feeder system can often be reinforced at reasonable cost to cover weaknesses in reliability (contingencies) at the substation level.
The concept is easy to understand, if not to engineer (at least with traditional tools). Suppose that for whatever reason, reliability at one substation is a particularly degraded level of expected reliability. Perhaps the utility has no choice but to accept very high equipment utilization at the substation and there is a less than ideal configuration of buswork and switchgear there to provide contingency flexibility. The feeder system in this substation area could be reinforced to provide “more than the normal amount of primary feeder level reliability strength” to make up for this deficiency. Specifically, since this substation will be out of service more than usual, the feeder system can be designed to transfer its loads to other neighboring substations, maintaining service during those contingencies. This is really what is necessary to provide good service in high-utilization systems, particular in the aging areas where substations are congested and highly flexible switching and buswork is not an option.
Good Distribution Planning Is Rocket Science
Despite the fact that what might be called “commodity” design can create a power distribution system that will work “well enough,” the power distribution system is by far the most difficult of all layers in the power system to plan and engineer to a truly high standard. Meeting this challenge is difficult, because distribution systems are like piranha. A single piranha is small, and not of great concern, but in aggregate, a group of piranha becomes something entirely different.
Like the piranha, almost every unit in a distribution system is small, of low voltage, commodity design, and low price. But in aggregate a distribution system becomes large, expensive, and most importantly, very complicated. This is due to both the sheer number of components (perhaps millions) and their interconnectedness or interaction with one another (particularly if viewed from the reliability perspective). A distribution system presents a tremendous challenge in combinatorial decision-making – how to select equipment, route lines, site key equipment and switches, taper conductor, arrange normal and contingency flow patterns, and makes a myriad of other decisions needed. The combinatorial aspect is tremendous, resulting from the fact that not only are there dozens or even hundreds of individual decisions to make in even a small distribution layout problem, but also because these individual decisions all interact with one another. No decision can be made in isolation: they all influence one another.
It is possible to sidestep this combinatorial challenge by using a set of standardized layout rules, templates on sizing and design, and inflexible guidelines on equipment and engineering. This was how utilities approached distribution in the 1930s, by sacrificing the gains in cost and performance that might be obtainable, in exchange for a tremendous simplification in the process of finding a workable plan for every situation. This template approach does assure that minimum electric requirements are met, and that cost, while perhaps not optimum, is not unduly high (perhaps no more than 10% above the minimum possible).
However, maximizing benefit, and particularly, tailoring distribution in each area of the system to fit the specific needs and the characteristics of other levels of the system there, means facing up to that combinatorial challenge. The possibilities within all that flexibility have to be exploited. That means dealing with all those interrelated decisions and obtaining plans that are close to optimality. Distribution planning, done to the most effective manner possible, is rocket science. Section 10.3 will summarize design and planning methods that accomplish these goals in a practical sense - they deliver results in the real world. However, they require new ideas and slightly more work than traditional methods, which brings up a final point about modern distribution planning.
Feeder System Strength
The “strength” of a feeder system will be defined here as the percent of the substation load that can be transferred to neighboring substations during contingencies. This is a characteristic of a distribution system that can be designed to have a value of anywhere from zero to one hundred percent. The authors have worked with systems at both ends of the scale and everywhere in between.
There is no single, recommended target for the feeder system strength. It depends on the voltages, capacities, demands, configurations and constraints on the sub-transmission – substation level, the capabilities of the type of distribution system being built, and the need for reliable service as interpreted by the consumers and the utility alike. Figure 10.1 shows the customer reliability plotted against feeder transfer strength for the central (metropolitan) division of the electric utilities that serve three North American cities. As can be seen, in all three systems the transfer capability of the system is a key variable in determining the overall capability of the system. Further, feeder system strength required to achieve a specific overall level of service reliability for the entire system (e.g., a SAIDI of 100 minutes) is far different in each of these systems.
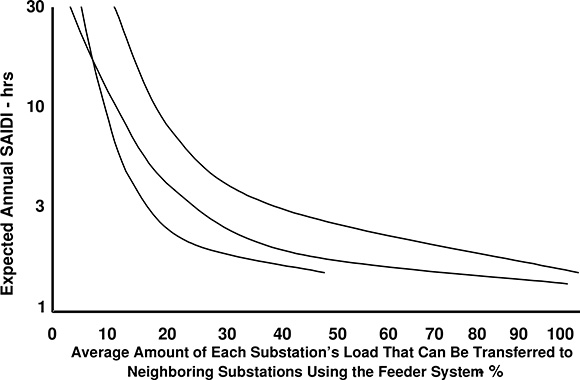
Figure 10.1 Feeder strength (% of the average substation’s load that can be transferred to three large metropolitan central systems in the United States). The “strength” of the feeder system, in terms of its ability to transfer a portion of each substation’s load to neighboring substations, is a key factor in reliability of most power systems.
In fact, usually there is a need for different levels of feeder strength in different areas of the same utility system. Very often in older (aging infrastructure) areas of the system, a stronger feeder system is the optimal (lowest cost, most “bang for the buck”) solution to problems of reliability due to combinations of aged equipment and limited or congested substation sites.
So, while there is no recommended value for feeder system strength, what is always recommended is that the characteristics of the feeder system be tailored to, and its planning both on an electrical and reliability basis be coordinated with, that of the rest of the system.
The Systems Approach
It is possible through the use of an appropriate type of reliability analysis (Brown, 2009) to determine the impact of various levels of feeder strength on the overall customer-reliability delivered by the power system. For example, determining curves like those shown in Figure 10.1, and engineering the system’s reliability to achieve the desired reliability target at the total lowest cost is the goal. This means balancing how much is spent on reliability and exactly how it is designed into the sub-transmission, substation, and feeder levels, realizing that through appropriate arrangement of configuration, each layer can to some extent provide contingency capability for reliability problems encountered in the other layers.
A key aspect of applying the systems approach to reliability engineering is the use of marginal benefit cost analysis – computing for each level of the system how much a small increment of reliability increases costs, based on the present configuration and the options available. Comparison of the values among levels and areas of the system leads to optimization.
Figure 10.2 illustrates a simple example. In this diagram, one sees the reliability versus cost curves for each level of a candidate system design – how much it costs to build the system that will provide various levels of reliability (so many minutes of outage annually due to events or failures on that level). In every case there is an exponentially increasing cost to buy increasing levels of reliability (decreasing levels of outage time).
The top diagram has large dots indicating the cost versus reliability point of each level of the system for one particular candidate design, a plan which is expected to provide a total of 119 minutes SAIDI, at an annualized cost of $172/kW peak demand (119 and $172 being the sums, respectively, of the SAIDI improvements and costs of all the dots representing a potential system design). The important items for improving reliability are not the actual values (i.e. positions of the dots) for any of these points. Rather, the optimum plan depends upon the slope of the cost versus reliability curve at those points. For example, the primary feeder level design is at 57 minutes and $24/kW annualized cost. However, the slope at that point indicates that spending an additional five dollars will improve reliability by ten minutes (moving the dot along the curve to the left by ten minutes raises cost by five dollars). By contrast, buying ten minutes at the substation level (see curve and dot for that level) would cost $32.00. Clearly, the way to improve reliability at a bargain price is to buy improvements in the feeder system.
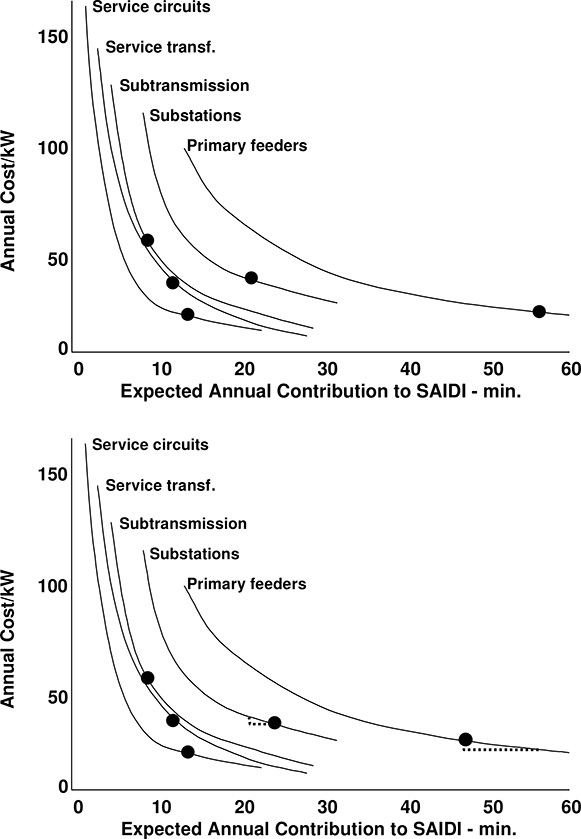
Figure 10.2 Top, cost versus SAIDI curves for the different layers of a power system. Dots show the status of each layer in a candidate design, which in aggregate provide 119 minutes of SAIDI annually at an annualized cost of $172. Bottom, by adjusting the feeder system design to “buy” ten minutes of SAIDI improvement for $5.00, and saving $5.00 by cutting at the substation level, a net improvement of five minutes SAIDI is obtained at no cost: SAIDI is now 114 minutes and cost is still $172.
But beyond this, in this candidate design, one can begin improving reliability without spending any additional budget by “trading” reliability and cost between the feeder and substation levels. This can be done by “buying” ten minutes of reliability at the feeder level for five dollars, and “selling off” five dollars worth of reliability at the substation level, which because of the slope of that curve, means giving up only five minutes of SAIDI. Overall performance is improved by five minutes at no change in overall cost.
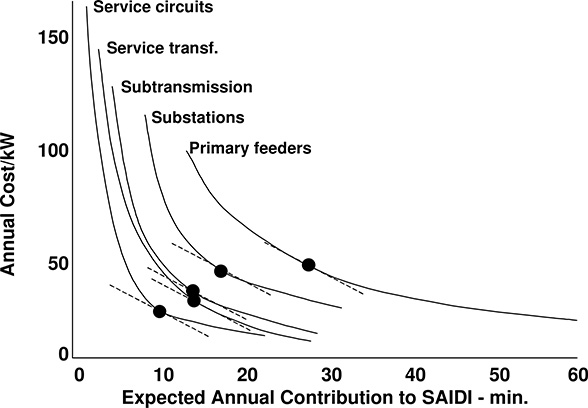
Figure 10.3 The candidate design is adjusted until all the levels have the same marginal cost (slope) of reliability (dotted lines). SAIDI for this design is 91 minutes at the same overall cost of $172/kW.
Thus modified (bottom plot), the slopes of the feeder and substation levels are still not equal, so this “trick” can be applied again, buying 13 minutes at the feeder level in exchange for eight minutes at the substation. This brings SAIDI down to 110 minutes at no increase in cost – annualized cost is still $172. Far beyond this, the points in all the curves can be adjusted in this way, with the result shown in Figure 10.3. The final result is a SAIDI of 91 minutes at the same $172/kW annualized cost.
The example shown is a slightly simplified example based on Case 5 in Table 10.1. In the real world, the curves for each level have discontinuities and small but frequent discrete jumps, and there is some interaction and interdependence among the curves. But the concept shown is a valid and workable approach, and it leads to viable, noticeable improvements in reliability, at no net increase in cost. In this case, to accomplish these improvements, more was spent on the distribution system and less on substation configuration and redundancy: distribution was both designed to a different style (see large trunk versus multi-branch in Section 10.3) and its strength was augmented in selected areas.
Changing the Distribution Paradigm
Chapter 1 (pages 28–30) discussed a number of “cultural barriers” that often stand in the way of improving power delivery system performance using “non traditional ways.” In the authors’ experience, the technical methodology required to successfully implement the distribution system performance improvements discussed above are far less challenging to most utilities than the cultural changes required to fit it into their organization. Considerable commitment from executive management, and steady effort to accomplish the change, are required.
10.3 FLEXIBILITY AND EFFECTIVENESS IN FEEDER LEVEL PLANNING
Generally, N–1 criteria and planning methods were traditionally applied to only to the sub-transmission – substation portion of the power delivery system, everything from the low side (feeder) breakers upward toward the wholesale grid (Figure 10.4). It was and still is uncommon to see that method applied to the distribution feeder system, although concepts allied with N–1 criteria often are. The primary reasons for this difference in methods on each side of the substation feeder breaker are:
Tradition – in vertically integrated electric utilities of the 1930s through 1990s, the Transmission Engineering Department most typically engineered all of the system above the feeder breaker, the Distribution Engineering Department engineered the feeder system and everything downstream of it. At most utilities they evolved different methods.
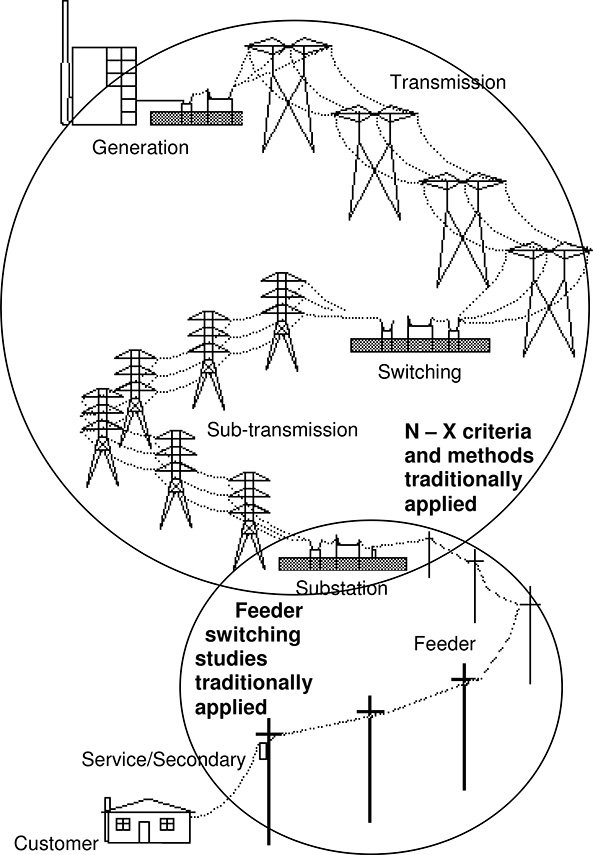
Figure 10.4 N-1 criterion (Chapter 9) is applied to the power system at the transmission, sub-transmission, and substation level analysis. Generally, feeder switching studies are done to assure “reliability” at the feeder level.
Applicability – The N–X study method (Figure 9.1) can not be applied to distribution feeder systems without significant modification of the traditional “modified load flow” approach. Distribution level application would involve representation of manual and/or automated switching operations, in precedence, which requires a much more involved algorithm, both in terms of internal complexity and user effort.
Different paradigm – Generally, at the distribution feeder level, reliability is addressed through switching redundancy design, as will be discussed below.
Feeder Contingency Switching
Traditionally, reliability-assurance methods for feeder level engineering varied greatly throughout the power industry, there being no standard or norm to which most utilities adhered. However, reliability engineering of feeders recognized certain characteristics at the feeder level:
• Feeder circuits are radial, and as such, an equipment failure leads to an interruption of flow of power to customers.
• Switching can restore service in advance of repair. Switches to isolate failed sections and to switch feed of power to alternate routes are provided at points throughout the feeder system, so that line crews can restore service prior to making repairs. Figure 10.5 illustrates this basic concept.
Multiple Switches Divide Each Feeder into “Switch Zones”
Although practice varied greatly among electric utilities both within the United States. and internationally, the traditional concept for “building reliability” into a feeder system design was to place several switches at points on each feeder to segment it, with portions transferred to neighboring feeders. Figure 10.6 illustrates this point. The tie switch near the feeder permits the feeder to be fed from an adjacent feeder leaving the same substation. (If the design of the substation-feeder system is sound, the adjacent feeder will emanate from a low-side bus different than this feeder’s, permitting service to be restored with this type of switching, even if the outaged feeder’s low-side bus is out of service.)
Alternatively, a second feed option is usually available on most feeders. The tie switch at the end of the feeder permits it to be supported from a feeder from another substation, as was shown in Figure 10.5.
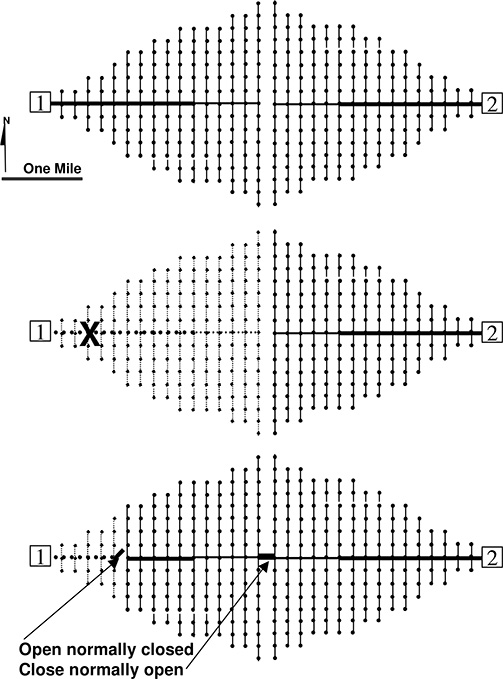
Figure 10.5 Example of feeder switching. Top, feeder from substation 1 and feeder from substation 2 are both in service. In the middle, a line failure at the location shown interrupts service to all customers on line now shown as dotted (the entire feeder). Bottom, a normally closed feeder switch is opened to isolate the failed section, and a normally open feeder tie switch between the two feeder end points is closed, restoring service to a majority of the customers on the outaged feeder. Only those portions shown as dotted lines are now without service (they must await repair of the damaged line). After repairs are made, the switching sequence is reserved to go back to normal configuration.
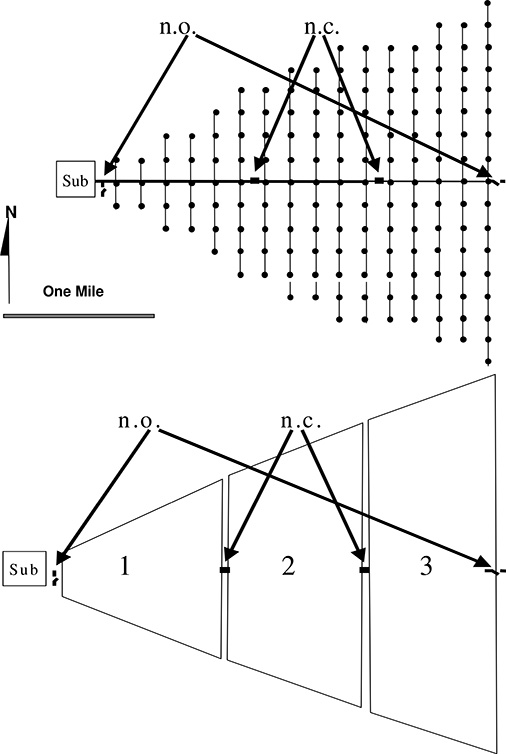
Figure 10.6 Top, a single feeder in a feeder system, in this case one of four identical (symmetrical) feeders from a substation. It has normally closed (n.c.) and normally open, (n.o.) switches which tie it to other feeders. Bottom, these four switches segment it into “switch zones” in which each is isolated (if a failed line section is in that zone) or transferred to adjacent feeders during a contingency, so service is maintained despite the failure in one zone.
Voltage, Loading Criteria, and Line Upgrades for Feeder Contingencies
During a contingency, when loads have been transferred, the feeder picking up additional load will experience higher than normal loading levels and voltage drops on the re-switched portion of its system. Referring to Figure 10.5, bottom, in that switched contingency configuration, the feeder from substation 2 is supporting roughly about 180% of its normal load (all of its customer demands and about 80% of feeder 1’s). Current flow on its trunk is thus 80% higher than under normal conditions, and voltage drop correspondingly 80% higher. In addition, the power flow to the portion of feeder 1 that has been picked up during the contingency is over a far longer route than under normal conditions – voltage drop will be even more than 180% of normal: it might reach over two times the normal voltage drop. Figure 10.7 illustrates this.
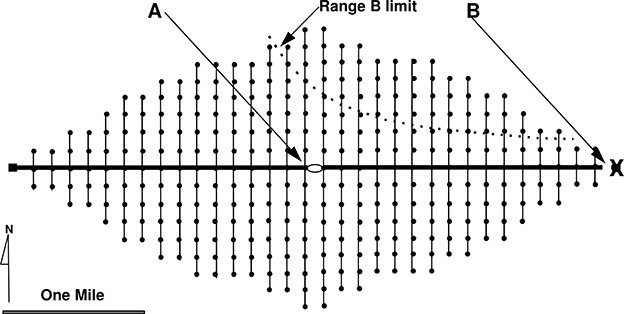
Figure 10.7 Two large-trunk feeders tied together for contingency support. The feeder on the right has experienced a failure of equipment at the substation (shown by an X). Switch B has been opened, switch at A has been closed, so that the feeder on the left supports both sets of feeder loads. The feeder on the left is now serving twice its normal load. Even though its conductor has some margin over peak load, the 200% load pushes it far beyond acceptable loading limits. Dotted lines show the points where voltage drop reaches range B limit using normally sized conductor. Voltages are symmetrical about the trunk, but the profiles are shown only for the northern side. This means voltages beyond the dotted line are unacceptably low, even when compared to the already relaxed standards applied during contingencies. Thus, to avoid unacceptable loading levels and voltage drops during contingencies, the conductor size on both feeders must be increased to a larger wire size, far beyond that needed for normal service.
Again, although standards and practices vary greatly throughout the power industry, often utilities will reinforce the trunk of each feeder (use larger conductor or cable than needed to serve the peak demand), so that capacity and voltage drop capability are available for contingencies. This reinforced capacity is not needed during normal operations; it exists purely to augment contingency capability. Its cost is justified on the basis of reliability improvement
Generally, utilities also apply different standards for what is acceptable loading and voltage drop during contingencies, than they do for what is acceptable under normal circumstances. While practices vary, many utilities use ANSI C84.1-1989 range A-voltages as design criteria for normal conditions on their system, and range B for contingencies scenarios. Range A specifies a 7.5% maximum voltage drop on the primary feeder system (9 volts on a 120 volt scale, maximum) during normal conditions (no failures). Range B, which applies during contingencies, permits voltage drops of up to 13 volts on a 120 volt scale (10.8% voltage drop).1
Similarly, loading criteria during emergencies typically permit excursions past the limitations set on expected loading during normal service. A particular conductor might be rated at a maximum of 500 amps, a substation transformer at 24 MVA for normal service - whenever everything is operating as planned. Under emergency or contingency operation, however, the conductor might be permitted a loading of 666 amps (133%) for six hours, and the transformer up to 30 MVA (125%) for four hours. While not all utilities follow these specific standards, most follow something similar. The establishment and application of emergency loading and voltage standards is a recommended practice, so that while the same rigid requirements of normal service need not be met during contingencies, some minimally-acceptable standards do have to be met, to provide a uniform target for contingency planning and operations.
Traditional Engineering and Planning Feeder Systems for Reliability
Reasonable levels of feeder system reliability can be assured engineering each feeder into an appropriate number and location of switchable zones, and arranging the line pathway of neighboring feeders so that they have the capacity to support these switchable zone loads [Willis, 1998].
During the latter fourth of the 20th century, practices at the feeder system level among traditional regulated, vertically-integrated electric utilities were quite diverse. The quality of engineering and planning, and the amount of scrutiny and detail paid to reliability design at the feeder level, varied greatly over the industry. Some utilities had tough standards and rigorous engineering methods. Most, however, applied simple formula methods based on topology and standardized layouts.2
1 See the IEEE Red Book (1994). Recommended Practice for Electric Power Distribution for Industrial Plants.
Weaknesses in Traditional Systems
As was the case at the sub-transmission - substation level discussed in Section 9.2, as budget pressures increased throughout the 1980s and 1990s, utilities responding by cutting back on reinforcement of their feeder system as their loads grew, and accepted higher utilization ratios (peak load/capability ratio) as a consequence. This had an impact at the feeder level that is qualitatively similar to that at the sub-transmission – substation level discussed earlier. Higher utilization ratios eroded contingency margin. Situations where contingency currents were too high, and contingency voltage drops too low, became not uncommon in many utilities, limiting their ability to restore service quickly during storms and when equipment failed, and generally leading to degraded customer availability.
Furthermore, at many utilities where budgets were cut back significantly, planners were forced to use the contingency switching capability of the existing system to accommodate load growth. When the customer demand in one feeder area grew to where it exceeded the feeder’s capability, a zone would be transferred to neighboring feeders. At several utilities (e.g., Commonwealth Edison of Chicago) widespread application of this stopgap approach during the 1990s “used up” much of the contingency withstand capability of the feeder system.
Optimizing Engineering and Planning of Feeder Systems for Reliability
As was observed earlier, adequate and even superior customer service level reliability can be assured by properly engineering the switching and capacity margin of the feeder system. This level of reliability can be accomplished by engineering each feeder into an appropriate number and location of switchable zones. A key factor of success is the artful arrangement of the circuit pathways for each feeder and its neighbors so that all have the capacity to support switchable zone loads, and so that there are a sufficient number of strategically placed intersections at which to put switches. This type of engineering can be involved and can require specialized techniques and approaches to work best, but there are proven methods in well- documented sources. See the Power Distribution Distribution Planning Reference Book – Second Edition (Willis, 2004), Chapters 13 and 14, for a detailed discussion of switch zone engineering methods and design trade-offs. As an example of the difference such methods can make, Figure 10.8 shows a feeder layout called a short-contingency path, multi-branch feeder. This feeder has a more “dendrillic structure” (repeated hierarchical branching into more and smaller flow paths) as compared to the large trunk feeders shown in Figures 10.5 and 10.6. Large trunk feeders are the most traditional types of feeder design, having only one path that is used in contingency switching (their trunk). Large trunk designs date from the 1930s and are used, mainly due to tradition, as the layout concept for feeder engineering at about half of all utilities in the United States.
2 For example, switches were not located so they would segment the feeder into zones designed for improved reliability, but located based purely on topology, at branching points and intermediate locations along long trunks.
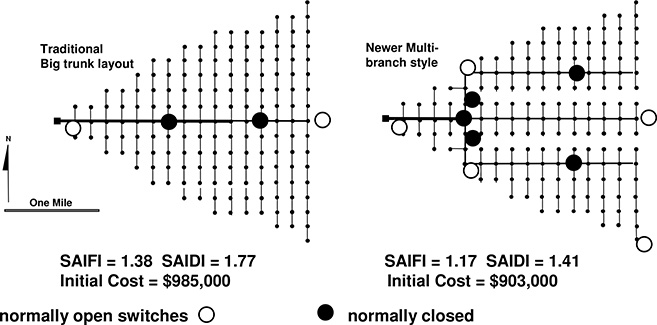
Figure 10.8 Left, the traditional large trunk feeder design, a simple to engineer and operate feeder layout based on 1930s engineering technologies. It has tie points to feeders at both ends of the trunk (Figure 10.7). Right, a multi-branch feeder serving the same area, designed to the same standards, has more switches and switching zones, with ties to similar multi-branch feeders on both sides of it, and at its end points. It is more difficult to engineer. But it but costs less and delivers better reliability. The point is that switching and layout can be engineered to deliver maximum reliability per dollar.
By contrast, the multi-branch feeder shown has a more complicated layout consisting of branches and sub-branches. These segment it into more and smaller zones. Basically, the feeder is broken into smaller “chunks” for contingency operation, and those chunks are transferred among several neighboring feeders during a contingency. This means:
A smaller portion of the feeder customer base will be unrestorable due to the failure. The switched zone containing failed equipment can never be transferred. Service in that one zone can be restored only by repair. Smaller zones mean a smaller portion of the customer base falls into this category during every outage. Consequently, a higher proportion of the customers can be restored through re-switching, cutting average interruption time.
Less contingency margin is needed. Loading levels and voltage drops during contingencies are far lower than with large trunk designs. Such a system is more challenging to design, although with modern electronic feeder CAD systems, this is quite within the grasp of any reasonably trained distribution-planning engineer.
Short pathways mean lower voltage drop. Although not obvious from visual inspection, the increase in MW-mile of flow during contingencies in the multi-branch shown is much less than in the large trunk designs. This means less money must be spent on conductor upgrades for contingency capacity and voltage drop capability (Figure 10.7).
High engineering and operating complexity. A distribution system composed of this type of feeder does involve slightly more work to design and to operate well during contingencies. However, the widespread use of CAD systems for feeder planning and CAM systems for distribution operations makes such capabilities commonplace.
The net impact of the above is that the multi-branch feeder has a 12% better SAIDI and 8% lower capital cost to serve the same load, while requiring roughly 10% more engineering effort and the same overall O&M cost.
The point of this discussion is not to promote the use of multi-branch feeders (there are other types of layout types besides large-trunk and multi-branch, and all have advantages and disadvantages that need to be carefully weighed in each situation). Rather, what is important here is that feeder layout, switching, and reliability can be engineered well, using proven methods. How this is done will be summarized in Chapters 13 and 14.
Strategic Planning – Analysis and Optimization of the Utility Feeder System’s “Strength”
Feeder systems can be engineered to provide only contingency support capability for feeder-level failures or to provide support through the feeder system for substation outages as well. Providing support for feeder outages - designing the feeder system so that it has switching and contingency capability to provide backup during failures on the feeder system, is certainly a best practice, and practically mandatory for urban and suburban systems.3 Layout, conductor size, and switching can be engineered so that all, or only a portion, of each feeder’s load can be transferred to neighboring feeders.
The primary means of supporting a feeder’s outage is to transfer its switching zones to adjacent feeders out of the same substation. This keeps the substation load as close as possible to actual, and is generally easier to accomplish in practice (line crews have to drive shorter distances to reach the various switches involved). It is also often considered a more prudent policy to transfer loads only between feeders of one substation, rather than between feeders served by different substations.4
Designing a Feeder System to Partly or Fully Support Substation Outages
If a particular feeder can be transferred so that it is completely served through a tie to a feeder emanating from a neighboring substation, then its electric consumers can remain in service during the failure of its substation (or the portion serving it). The ability to transfer the entire feeder load requires great strength among neighboring feeders in terms of feeder trunk capacity and voltage (factors such as discussed in Figures 10.7 – 10.8). A general capability to do this throughout a system – a feeder system designed so all feeders for any one substation can be transferred among its neighbors – results in what is termed a “strong” feeder system.
Clearly, to permit this to work well, in addition to a strong feeder system, the substations themselves must also have contingency withstand capability to accept the additional transferred loads. However this usually is not a design problem. In fact, use of a strong feeder system permits increased utilization ratios (peak load/capability ratio) at the substation level, i.e., lower contingency margin in substation designs. If a substation transformer fails, the remaining transformer(s) at the station do not have to pick up that transformer’s load – it can be distributed over many transformers by transferring some of the feeders to neighboring substations.
3 Given that most feeder systems are radial, there is no other way to assure quick termination of customer interruptions caused by feeder failures. In the design of rural distribution systems, there generally is no switching capability, due to the distances and scarcity of the system. But in suburban and urban systems where there are neighboring feeders in all areas, the design of the system to switch around feeder-level outages is a given in almost all utility systems.
4 The issue here is mostly a desire, when switching back to the original configuration after the outage is repaired, of avoiding a short-term interruption of service to any customers. To do so, the utility has to use “hot” or “make-before-break” switching. The “to” tie switch to the permanent feed feeder is closed before the “from” switch connecting it to the temporary contingency feeder is opened. For a moment during this process the transferable section has two feeds. This avoids a short interruption to the customer, which occurs if the “from” switch is opened prior to closing the switch to the other source. Hot switching between feeders served by the same substation is generally “safe” in the sense that it will cause no loop flows or overloads. But hot switching on feeders of different substations can create high loop flows, if phase angle differences between the substations caused by circuit flows on the transmission system is large. Some utilities have a firm policy of not doing such switching between substations, and as a result, prefer to do switching only between feeders served by the same substation.
Often, a utility will design its feeder system to support a limited amount of feeder load transfers to neighboring substations. For example, suppose that the outermost one-third of load on every feeder can be transferred to neighboring feeders. This is not an undue amount of load (one-third that of transferring the full feeders) and more importantly, is the portion of load closest to the neighboring feeders, meaning flow paths and voltage drops are lower, so that it is not typically difficult to arrange.
With this feeder system strength, the loss of one of two identical transformers at a substation can be supported, even if they are both loaded to 100% at peak, with an overload of only 33%. During the contingency, load amounting to 66% of a transformer’s capacity is transferred to neighboring substations (the outermost one-third portion of feeders served by both transformers), leaving the remaining 133% to be served by the one unit in place. Overloading is equivalent to what occurs without feeder transfers, if the transformers were loaded to only 66%. The ability to transfer 33% of feeder loads results in an ability to increase transformer loading by 50% (from 55% to 100% of rating) with no increase in substation contingency stress levels.
Optimizing the amount of strength in a feeder system can be accomplished by balancing the marginal cost of feeder strength against the marginal savings in transformer capacity. Again, as throughout this book, the keys to success in gaining reliability/dollar are:
• Systems approach – in this case the feeder and substation levels need to be considered simultaneously, trading strength at one level against the other, in order to achieve reliability targets at minimum cost.
• Marginal cost optimization – as described elsewhere, the planners “buy” and “sell” reliability between levels until there is no bargain at either level.
In any real system, application of this design approach results in areas of the system with stronger and weaker feeders, and weaker and stronger substations respectively. These differences are due to constraints and factors unique to locations throughout the system. At substations where there is a limitation in capacity, a high utilization factor already, and very high marginal cost for any additions, reinforcement of reliability by use of a strong feeder system is generally the lowest cost option. Similarly there are areas where the reliability can be bought at the substation level less expensively than at the feeder level. But the fact is that the system if designed like this overall, delivers the performance required at minimum cost.
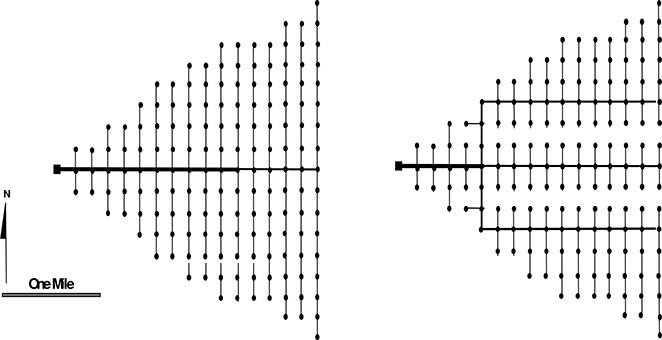
Figure 10.9 Feeder configuration evolution. By selectively reinforcing segments and changing configuration, an existing large-trunk feeder (left) can be modified, or through gradual changes, evolved, into a multi-branch feeder with greater inter-substation tie capability (right). Engineering such changes so that they both work well, and fit within constraints of route and duct size, etc., and fit budget and work management schedules, generally requires a modern feeder system CAD software package with optimization capabilities. But, this is well within the capability of several existing commercial, feeder design software systems.
Increasing Feeder Strength to Augment Aging Infrastructures
Generally, in aging infrastructure situations it is impossible, or very expensive, to augment the substations – sites are small relative to need and tightly packed with equipment. Reinforcement of the feeder system to add strength is a good means of improving reliability overall, as it can usually be achieved within existing constraints and at lower cost. Such design, called configuration evolution, is not practiced by most utilities but is feasible and long proven in numerous cases (Figure 10.9).
Details of configuration evolution can be found in the Power Distribution
N
One Mile
Planning Reference Boo – Second Edition (Willis, 2004). The important point here is that the reliability of a system, aged infrastructure or not, can be managed through artful use of modern reliability-engineering methods.
10.4 SMART DISTRIBUTION SYSTEMS
Although the term “grid” is usually reserved for the high-voltage (wholesale transmission) portion of a power system, the term “smart grid” is widely used to refer to any and all parts of a power system that employ “smart” technology. But as was discussed in Chapter 1, for a system to truly be a Smart Grid, it must have two characteristics:
1) It must use smart technology: sensors, digital and analog electronic controls, and data communications.
2) It must have a revised or updated design of the power system itself and the way it is operated to take full advantage of the capabilities that the smart equipment provides.
These two capabilities are discussed in more detail below.
1 - Variation in something is the key to “smart”
The essence of smart systems is variation in some significant factor(s) of system behavior or settings on a context sensitive manner: the system responds to different situations it senses by varying its own equipment settings, configurations, or perhaps rates or limitations on demand in order to best fit those situations. A power system with widespread use of “smart technology” just to gather detailed information on loading, customer usage, and equipment status might be omniscient, but if does not do something with the information it gathers it is not truly “smart.” A smart system might increase the price of power during peak periods and lower it during times of lower demand. It might set protection into a “fuse-saving” mode at some times but not at others, based on the expected customer sensitivity to the blinks that fuse-saving protection schemes produce, based on a function of day of week and time of day, system configuration and customer loading. It might re-configure switching automatically in response to failures or equipment loadings, etc. Such variation is a requirement for a truly smart system, and this means equipment installed on the power system must nearly always be able to vary its electrical performance. A capacitor bank must be able to turn itself on or off (perhaps in stages), a voltage regulator vary its tap ratios, a recloser relay vary its reply programming, etc. With this equipment installed, the system can now do something with the data it gathers and the inferences based on that which are developed by analytical engines in the system hub or in local equipment. Capacitors and voltage regulators on a circuit act in concert, cooperating (because they sense what each other is doing) and working to maintain voltage profile, loses, and power quality at the best points possible regardless of circuit loading and configuration, and so forth.
2 - Re-Designing the distribution system to take advantage of “smart”
The traditional design for primary distribution in North America is to lay out circuits in a “big-trunk” radial configuration and to arrange sectionalization (where and how fuses opened if there were problems) in a cascading protection sequence up and down the circuit.5 As was discussed in Section 2.7, the chief advantage of the traditional big-truck radial feeder approach is simplicity, of design, protection coordination, and operation, to a degree that fist the needs of the period during which the industry settled on this approach (first quarter of the 20th century). Circuits can be successfully designed and equipment properly specified with a minimum of information and, quite literally, on the back of the envelope calculations.6 The system is straightforward to operate, dispatch, and refer in a safe manner with only maps as databases and common sense procedures used to assure safety. The industry stuck with radial distribution systems throughout the 20th century and into the 21st because they provided satisfactory performance for the time and no change was needed. Considerable improvement in every and all aspects of a power distribution system’s performance can be achieved if a more complicated basic design approach is used as compared to simple radial configurations. System cost, customer service reliability, voltage stability, power quality, electric losses, and safety can all be improved at the same time. The price paid for the simplicity of early radial distribution systems is a substantial margin in equipment and system capability that is often there but unused. In the early 20th century, this margin covered all the unknowns due to engineers and operators not having comprehensive load and system metering data at their fingertips, and for the approximations used in back-of-the-envelope calculations, so that circuits designed with linear models of non-linear processes would still work well. Figure 10.10 illustrates these concepts.
5 See for example, Chapter 20 of the Transmission and Distribution Reference Book (the original Westinghouse “Blue Book,” now published by ABB in a red binding) or Chapter 4 of the Electrical Engineering Reference Book, Volume 3 – Distribution Systems also by Westinghouse. Both books have been published in various editions since the 1950s and contain the most widely available discussions of traditional, pre-computer age distribution design available. For a more recent discussion including modern alternatives to traditional designs, see the Power Distribution Planning Reference Book – Second Edition, Chapter 14, particularly the portion after page 483 and the section title “Switching and Sectionalization – Managing Complexity and Cost.” Smart systems greatly reduce the cost and increase the efficacy of the high-reliability configurations discussed there.
6 This is not to say one cannot do a somewhat better job at assuring good performance and lowered cost using the greater data gathered by modern IT systems and the computerized tools in wide use today. However, with only a pencil and paper, and estimates of number of customers and peak load/customers, a competent engineer can lay out a radial distribution system so it will both worth satisfactorily when all equipment is functioning as intended and fail safe when something goes wrong. In a period when the most advanced tools available to power engineers were a slide rule and a book of logarithms, this was a necessity.
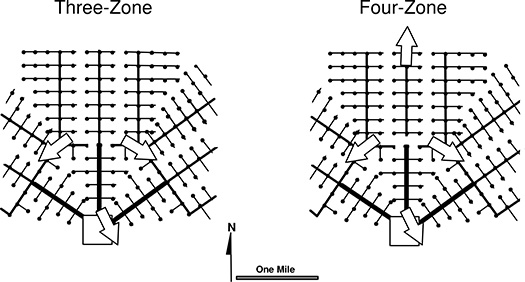
Figure 10.10 Left, a three-branch feeder somewhat similar to that shown on the right in Figure 10.9 provides better switching opportunities, operational flexibility, and potential service reliability than the big truck feeder shown on the left in that figure. Right, a four-zone feeder configuration uses more switches and complexity in transfers.
Arrows indicate the direction that switches would transfer power if the feed were lost at the substation. The four-branch configuration divides the load being restored both more evenly and into smaller portions. This generally means that the restoration can be accommodated more easily and for longer periods by neighboring equipment. For this reason the four-zone configuration will provide slightly better customer service reliability, particularly in a system with high equipment utilization rates. However it will be more complicated to operate, requiring more information on the part of the dispatchers, or the DMS system.
A system designed without that margin can be cheaper – perhaps up to 15% lower in overall cost – and more reliable with better quality of service. But engineers will need much more data in order to plan and engineer it. Modern smart data acquisition systems can gather this data, and modern Enterprise IT systems can provide it to the engineers in a way they can efficiently use it. Further, system operators will find the system a challenge to operate compared to the traditional radial system. It will require that they constantly adjust equipment settings in response to changes in load and system conditions, and that from time to time they recognize the system is in a different operating mode and that they have to re-orient some of its basic scheduling rules and priorities in order to assure that it “fails safe” should something go wrong.
All of this can be accommodated, usually in a completely automatic way, by the proper use of smart grid equipment and designs. The distribution system is no longer entirely radial in configuration or operation, at least as regards all the configurations it can be switching to. It is deliberately designed so that it will have to change its configuration (switching) and equipment settings (voltage tap levels and capacitor switching) in order to function well throughout the course of a year or even perhaps a single day. Automatic equipment can do that. Protection and fail safe capability require that one unit of equipment “know” the status and loading of others nearby: data communication can provide this.
The net result is that a smart distribution system has better performance in every category than a traditional system, including the performance category cost. There is a price to pay, however. Smart systems are much more complex from nearly every standpoint, and require advanced design tools and planners, engineers, and operators of exceptional skill and training to plan, design, and operate them.
10.5 CONCLUSION
Distribution systems often provide fertile ground for cost-effective improvement of power system reliability. This is not only due to the fact that many power quality problems start at the distribution level and are therefore most effectively solved there. It is also because the distribution level can be used to provide load transfer capability between substations, thus reinforcing weaknesses in the overall customer service reliability chain due to weaknesses at the sub-transmission and substation levels. A distribution system’s strength – its ability to transfer load between substations – can be tailored as needed at locations throughout the power system.
In aging infrastructure areas, reliability-based augmentation of the distribution system is a particularly attractive option for improvement of overall customer service quality. Basically, the cost of “buying” reliability improvements at the primary feeder level is often far less than at the sub-transmission and substation levels, which are far more constrained. The distribution has a small granularity - it can be upgraded in stages – and essentially evolved into a system designed to bolster sub-transmission/substation level weaknesses. This is not to say that distribution can provide all, or even most, of the “cure” needed in aging infrastructure areas, but it is one of the most effective among the many options which a utility can assemble into a viable overall plan.
Explicit Distribution Reliability Methods
Given the increasing failure rates of its components, a distribution system will benefit as to its electrical and customer service reliability, and the utility owner benefit as regards business results, by some degree of de-design for higher reliability and to take maximum advantage of smart equipment and systems to augment system performance. Distribution planning and methods traditionally used at most utilities applied standardized concepts, often not completely articulated, but instead institutionalized as tacit knowledge or culture, for how the system should be laid out, tables used, and guideline-driven design methods to simplify effort and engineering. While adequate to meet the traditional expectations for performance of the distribution system, these did not address reliability directly nor get the maximum possible from the distribution system in terms of reliability interaction with other levels, or economy.
For these reasons, modern planning needs are best met using power system design and planning techniques that directly address reliability performance. The most important points are:
1. Systems approach - planning of the distribution system must be completely coordinated with the sub-transmission and substation levels. The goal is not to design an optimal distribution level, or substation level, but to design an optimum system. Any one portion of that whole might be decidedly “non-optimum” until its context within the entire system is taken into account.
2. Balancing of cost versus performance among multiple levels of the system using adjustment of design based on achieving equivalent marginal cost of reliability. This results in near-optimum use of limited funds to “buy” reliability improvements.
3. Engineering of configuration and switching – a wide variety of possibilities in the overall layout of a feeder exist and should be reviewed in order to pick the best approach for the needs in each area. Very often standards at a utility will be so tightly institutionalized that engineers are not aware of neither other options nor the advantages they could obtain with flexibility of configuration and layout.
4. Reliability-based engineering – explicit rather than implicit methods for reliability engineering of the distribution system. Applications of these methods to power systems provided a much more dependable design method to achieve operating reliability.
Dependable, practical, methods for applying these concepts to aging infrastructure (and others types of) power systems have been proven in numerous applications. While these are different than traditional methods, and require more skills and somewhat more labor, they are often essential in order to achieve any type of meaningful performance improvement from the distribution system within a reasonable budget limit. This chapter served only as a summary of modern distribution planning methods. Additional details are found in the references below, particularly in those by Engel (1992) and Willis (2004).
REFERENCES AND BIBLIOGRAPHY
ABB Power T&D Company Inc., Electric Power Transmission and Distribution Reference Book, Fifth Edition, Raleigh, 1998.
R. E. Brown, Electric Power Distribution Reliability – Second Edition, CRC Press, Boca Raton, 2009.
R. E. Brown, Business Essentials for Utility Engineers, CRC Press, Boca Raton, 2009.
M. V. Engel, editor, Power Distribution Planning Tutorial, IEEE Power Engineering Society, 1992.
Institute of Electrical and Electronics Engineers, Recommended Practice for Electric Power Distribution for Industrial Plants (the Red Book), Institute of Electrical and Electronics Engineers, New York, 1994.
Institute of Electrical and Electronics Engineers, Recommended Practice for Design of Reliable Industrial and Commercial Power Systems (the Gold Book), Institute of Electrical and Electronics Engineers, New York, 1991.
H. L. Willis, Power Distribution Planning Reference Book - Second Edition, Marcel Dekker, New York, 2004.
United States Department of Energy, Power Outages and System Trouble (POST) Report, March 2000, Washington DC.