
You’ve already drawn your first line in Processing, but that was just the beginning. In this project, you’ll use basic rectangles to create some awesomely low-resolution graphics, so look to your favorite retro video game sprite (or any simple, blocky image) for inspiration. We’re making pixel art!
• Graph paper
• Colored pencils
• Felt-tip pen
First, you’ll draft your pixelated masterpiece in the physical world. Using your colored pencils, draw a square that is 20 boxes by 20 boxes on a piece of graph paper to represent your sketch window in Processing, and create your image inside that square. Follow these rules to make your image easier to translate into code:
Rule 1Use only full squares of color—no angles, arcs, or partial squares!
Rule 2Start by creating something simple, like a smiley face or a house.
Rule 3Try to use contrasting colors at first. Some subtler shades may not be noticeable when transferred to the computer.
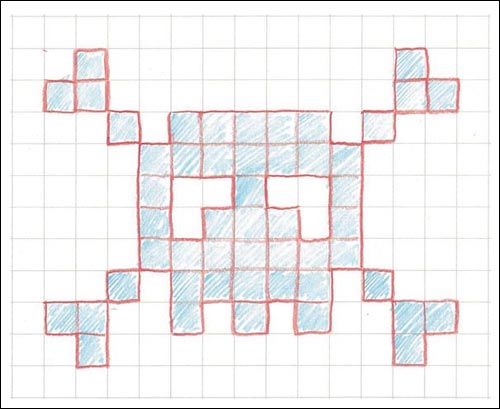
To spark your creativity, Figure 1-1 shows an example of the “unplugged” version of this project that follows the rules just given.
FIGURE 1-1: A sketch of my pixel art, ready to be programmed in Processing
Once you’ve drawn your rough draft, you have some planning to do. Remember the Processing version of the Cartesian coordinate plane from Project 0? That coordinate plane (Figure 1-2) is going to be your best friend from here on out, because Processing uses this plane for specifying locations.
FIGURE 1-2: Processing’s coordinate plane
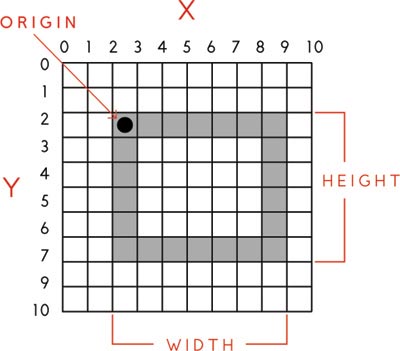
In Processing, a rectangle has an origin just like the sketch window does, as well as a width and height. On your screen, a rectangle’s origin and dimensions will be given in pixels, but for now we’ll count in graph paper squares. Mark the origin of your 20×20 graph paper drawing, and then, using a felt-tip pen that will contrast well against the colors you’ve already used, break up your drawing into the largest rectangles of solid color possible. These larger rectangles will make your drawing much easier to translate into code. In Processing, you must be able to break down a drawing into smaller shapes, and since you’re making pixel art, you’ll use rectangles to draw your image. The great thing is that you don’t have to draw each individual pixel: grouping pixels into the largest possible rectangles means you’ll write less code in the long run!
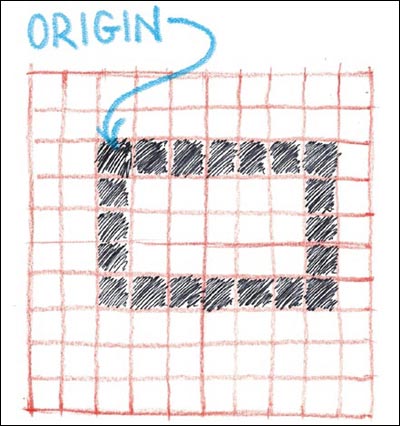
Now mark the upper-left corner of each rectangle in your pixel art, as shown in Figure 1-3. The upper-left corner is that rectangle’s origin, and you’ll need to know this location for each shape you want to draw.
FIGURE 1-3: The upper-left corner of a rectangle is its origin.
The number of rectangles you end up with depends on how many colors you used and the complexity of your design. Usually, the more complex the drawing, the more rectangles you’ll have and the smaller those rectangles will be in size; the inverse usually holds true for simple drawings.
Once you have all of your rectangles outlined and their origins marked, you’re just about ready to translate the image into code. To draw your pixel art in Processing, you need four values from each rectangle: the x- and y-coordinates of the rectangle’s origin with respect to the origin of your 20×20 Cartesian coordinate plane, and the width and height of the rectangle, measured in graph paper squares.
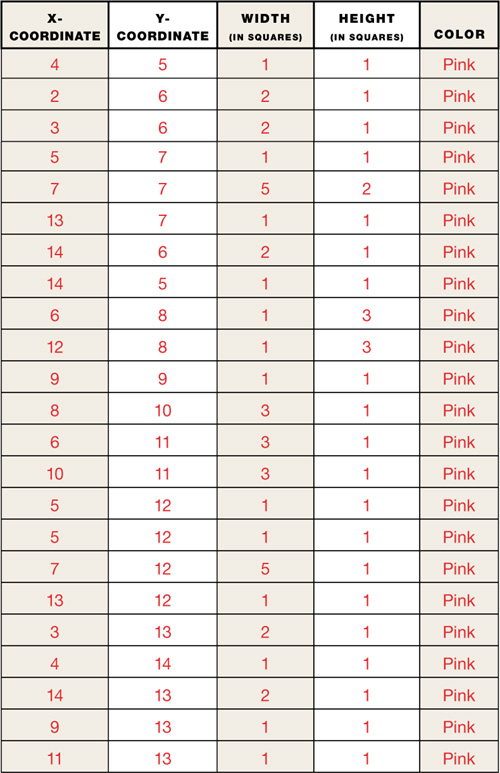
I usually create a table to hold the values for each rectangle, as I’ve done in Table 1-1 for the skull drawing (Figure 1-1). Be sure to group all the rectangles of the same color in your table. Sorting the rectangles by color now will help you avoid further sorting and rearranging when you start translating them into code.
TABLE 1-1: Rectangles to draw, sorted by color, for skull image
When you have all of the rectangles mapped in the manner shown in Figure 1-2 and Table 1-1, it’s time to jump back into Processing and take your pixel art to the screen!
TRANSLATING YOUR SKETCH INTO CODE
Start with a blank code window in the Processing IDE, and write the two main functions of every sketch: setup() and draw(). Recall from Project 0 that the setup() function runs once and only once. The draw() function, on the other hand, runs over and over again in a loop.
void setup()
{
//setup code goes here and runs once
}
void draw()
{
//draw code goes here and runs over and over again
}
NOTE
Use comments to label functions, colors, shapes, and so on, or to leave notes to help guide friends who might read your sketch later!
The grayed-out lines of code starting with // are called comments. Processing won’t execute any code that is commented out. Comments are normally used to leave information or notes for other people that won’t be read by the computer. We can use comments to “hide” functions from the computer instead of deleting them. It’s a way to turn functions on and off but keep them in place. Here, I’ve included the comments to remind you how the setup() and draw() functions work.
Tackle the setup() function first: type void setup() followed by an open brace and closed brace, {}. Inside those braces, set the size of your sketch window by calling size() with a width and height of 20 pixels.
void setup()
{
size(20,20);
}
Now for the draw() loop, which will house all of the code you’ll use to draw your rectangles. Processing has several functions you can use to draw specific shapes, and in this project, you’ll use the rect() function to create rectangles.
As noted earlier, you need to pass four values, or parameters, to the rect() function, and you must place them in a specific order: the x-coordinate of the top-left corner, the y-coordinate of that corner, the rectangle width, and the rectangle height. For example, calling rect(100,100,20,30) would draw a 20×30-pixel rectangle starting 100 pixels to the right and 100 pixels down from the sketch origin.
Start by drawing a basic rectangle before you jump into drawing rectangles from the table you used to break down your pixel art. Create a draw() loop function, and add a rect() function inside the loop. Make sure you don’t forget to add a semicolon! Your code should look something like this:
void draw()
{
rect(50,85,150,75);
}
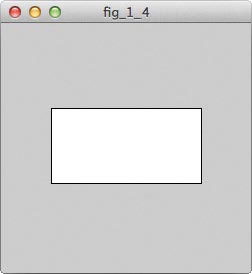
Click the Run button, and your sketch window should display a white rectangle outlined in black (Figure 1-4). Success!
FIGURE 1-4: Rectangle drawn by Processing sketch
But your pixel draft probably includes colors other than white, so how do you change the color of a rectangle?
ADDING COLOR
Processing provides a number of ways to change the color of a drawing, including a function called fill() that fills shapes with color, like the paint bucket tool in many graphic design applications.
There are a few ways you can specify color to a computer, but I’ll focus on just one for now: RGB. RGB stands for red green blue, and in this format, each color intensity is represented by a number from 0 to 255, where 0 is no color and 255 is full intensity. The fill() function accepts three different parameters, which also range from 0 to 255 and represent amounts of red, green, and blue (in that order). You could pass 255, 0, and 0 to the fill() function to fill a shape with only the highest intensity of red. The two zeros tell Processing not to use blue or green.
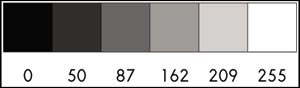
If you use a single 0–255 number, you’ll get a grayscale value, where 0 is black and 255 is white (see Figure 1-5).
FIGURE 1-5: Grayscale values in Processing
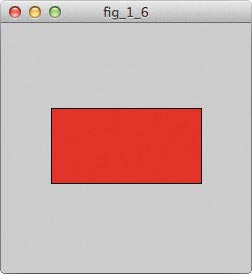
Any function that manipulates a shape’s appearance is called a modifier, and all modifiers must appear above the shapes being altered in your Processing code. So to color your rectangle red, add the fill() function above the rect() function and pass the three values representing full-intensity red without green or blue (see Figure 1-6).
void draw()
{
fill(255,0,0);
rect(50,85,150,75);
}
FIGURE 1-6: Color shapes with full-intensity red using fill(255,0,0).
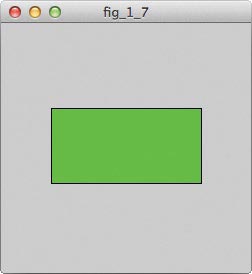
Play around with more number combinations in fill() to see what colors you get! Figure 1-7 shows a purely green rectangle using fill(0,255,0). How would you make a blue one?
FIGURE 1-7: Color shapes with full-intensity green using fill(0,255,0).
Processing also includes a tool that lets you select a specific color. In the menu bar at the top of the code window, click Tools to access a menu of add-ons that make certain tasks easier. Click Color Selector to launch the Color Selector tool in a dialog, as shown in Figure 1-8.
FIGURE 1-8: The Color Selector tool
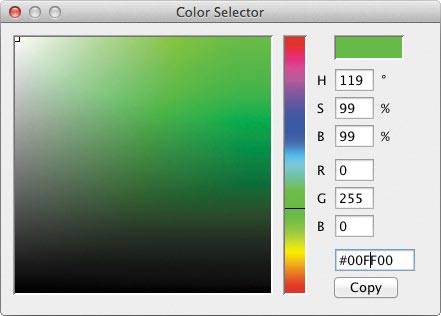
Note the RGB values for red, green, and blue. You can use this interface to find the exact color you’re looking for. Select the color you want with your mouse, and the Color Selector displays the color’s RGB value on the right side of the window. Using the Color Selector tool, you can create very detailed images with appropriate colors without having to play an RGB guessing game.
NOTE
The other popular way to specify color in Processing is with hex values, which are also often used to specify color in websites and other digital content. The Color Selector shows a hex value in the very last text field. Use hex values in your code if you’d prefer, but I’ll use the RGB setting throughout this book to keep explanations simple.
ORDER MATTERS
Remember how you sorted your list of rectangles by color, as shown in Table 1-1? I had you organize them that way to make using the fill() function easier.
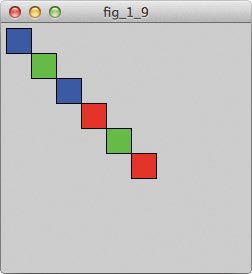
When you add a fill() function to your code, it fills all shapes below it with the color you specify. If you don’t group your rectangles by color, then you might have to call a fill() function for each rectangle! When you call the rect() functions for all rectangles of a particular color in a group, you only have to call fill() once for each color, as in this draw() function for the sketch shown in Figure 1-9.
void setup()
{
size(250,250);
}
void draw()
fill(0,0,255); //blue rectangles
rect(5,5,25,25);
rect(55,55,25,25);
fill(0,255,0); //green rectangles
rect(30,30,25,25);
rect(105,105,25,25);
fill(255,0,0); //red rectangles
rect(80,80,25,25);
rect(130,130,25,25);
}
You called the fill() function only three times, even though the sketch window shows six colored rectangles. Grouping elements of the same color helps to keep your code nice and clean, especially if you leave some whitespace between your color groupings.
FIGURE 1-9: Each rectangle is the same color as the fill() function above it in the code.
Now that you have some experience with creating a rectangle and filling it with color, you can tackle your table of colored rectangles from your pixel art drawing. Start with one color from your drawing, use the Color Selector tool to find the fill color that best matches it, draw all of the rectangles of that color at one time, and then move on to the next color. Click the Run button every so often to check the progress of your image, see if everything is lining up correctly, and confirm that you like the colors you’ve chosen. Continue working this way until you’ve drawn all of your rectangles.
REMOVING OR MODIFYING YOUR OUTLINES
Each rectangle in your picture probably still has a black outline, which may make your drawing look funny. The outline of a shape is called a stroke, and Processing applies a single black stroke to every shape by default. If you don’t like the current stroke, you can modify it or get rid of it completely.
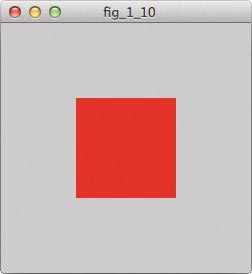
When creating a pixel art image, you really don’t want every rectangle outlined; it ruins the look of using individual pixels! Use the function noStroke() at the top of your draw() loop, as shown here, to remove the stroke from all of the shapes in your sketch, just as I did for the red square in Figure 1-10.
void draw()
{
noStroke(); //no outline
fill(255,0,0); //red fill
rect(75,75,100,100);
}
FIGURE 1-10: A red square with no stroke
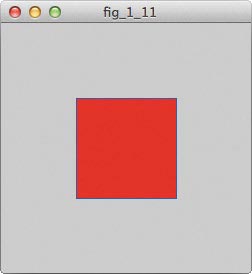
If you want a stroke for some shapes, use the stroke() function to add it back to a particular shape or group of shapes. Notice that the stroke() function works just like the fill() function, but it’s for coloring outlines rather than filling entire shapes. You can use an RGB or hex value if you want a specific color; the red square specified here and shown in Figure 1-11 has a blue stroke.
void draw()
{
stroke(0,0,255); //blue outline
fill(255,0,0); //red fill
rect(75,75,100,100);
}
FIGURE 1-11: Outlining a single shape
Remember, if you don’t specify the stroke() of groups of code lines or specify noStroke(), then one stroke() value will be applied to all geometry functions.
SCALING YOUR SKETCH TO EPIC PROPORTIONS
You’ve learned to draw basic rectangles, placed them on a Cartesian coordinate plane, filled them with color, and removed their outlines. You should have the coolest tiny pixel art image ever! Your Processing code should look something like Listing 1-1.
LISTING 1-1:
Rectangle sizes with a sketch window of 20×20 pixels
void setup ()
{
size(20,20);
❶ background(0,0,0);
}
void draw()
{
noStroke();
❷ fill(188,13,168);
rect(4,5,1,1);
rect(3,6,2,1);
rect(5,7,1,1);
rect(7,7,5,2);
rect(13,7,1,1);
rect(14,6,2,1);
rect(14,5,1,1);
rect(6,8,1,3);
rect(12,8,1,3);
rect(9,9,1,1);
rect(8,10,3,1);
rect(6,11,3,1);
rect(10,11,3,1);
rect(5,12,1,1);
rect(13,12,1,1);
rect(3,13,2,1);
rect(4,14,1,1);
rect(14,13,2,1);
rect(14,14,1,1);
rect(7,13,1,1);
rect(9,13,1,1);
rect(11,13,1,1);
}
This sketch draws the skull shown in “Drafting Your Pixel Art” on page 18 and in Figure 1-12. The background() function ❶ takes three parameters that represent red, green, and blue, just like fill(), and I used it to color my background black. All of the rectangles in the skull are pink ❷, just as I defined them in Table 1-1.
FIGURE 1-12: Skull image at 20×20 pixels
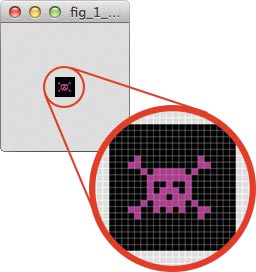
But that sketch is awfully small. Don’t worry—you can make it bigger.
In Processing, size is all about scale. If you multiply all of the values in your rectangle functions as well as your sketch window size by a factor of 10, your image will come out much larger—in fact, 10 times larger! Check out Listing 1-2 for an example.
LISTING 1-2:
Rectangle sizes with a sketch window of 200×200 pixels
void setup ()
{
❶ size(200,200);
background(0,0,0);
}
void draw()
{
noStroke();
fill(188,13,168);
❷ rect(40,50,10,10);
rect(50,70,10,10);
rect(70,70,50,20);
rect(130,70,10,10);
rect(140,60,20,10);
rect(140,50,10,10);
rect(60,80,10,30);
rect(120,80,10,30);
rect(90,90,10,10);
rect(80,100,30,10);
rect(60,110,30,10);
rect(100,110,30,10);
rect(50,120,10,10);
rect(70,120,50,10);
rect(130,120,10,10);
rect(30,130,20,10);
rect(40,140,10,10);
rect(140,130,20,10);
rect(140,140,10,10);
rect(70,130,10,10);
rect(90,130,10,10);
rect(110,130,10,10);
}
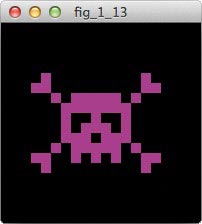
Starting with the sketch window size ❶ and moving on to the rectangle locations and dimensions ❷, I’ve made each value in this sketch 10 times larger. The actual pixel art image (Figure 1-13) is much easier to see now!
FIGURE 1-13: Skull image at 200×200 pixels
TAKING IT FURTHER
If you really like your image and want to share it with others, I highly recommend visiting http://openprocessing.org/. OpenProcessing allows you to upload your sketches to the Web and share not only how they look but also the code that you used to create them. Other people can then check out your projects and even fork your code and modify it. Modifying other users’ code to see how your changes affect the original image is also a great way to learn how to program in Processing.
If you want to try your hand at more complex pixel art, then instead of creating an image off the top of your head, try reproducing a pixelated version of an existing image by printing it out and placing it underneath your graph paper. Using the same pixel art rules for your original pixel masterpiece, try to trace the print out with squares of colors to pixelate it. You should end up with an elaborate, pixelated version of what you printed out. Dare I suggest attempting the Mona Lisa? And it’s always fun to pixelate a friend!