
Building a Weather Dashboard with JSON Data
You’ve created Processing sketches that change based on user input, but you can also make art pieces that respond to data. The Internet places a vast amount of varied information right at your fingertips, so Naturally there are a number of ways to collect that data.
In this project, I’ll teach you how to harness online data to create a simple weather dashboard that you can customize on your own. The key to this project is finding a way to get all that weather information into a Processing sketch, and that’s where JavaScript Object Notation (JSON) comes in. JSON is a standard for communicating data across different tools and languages, and it’s a popular way of formatting information on the Web (since all browsers run JavaScript). In practical terms, JSON allows you to transfer data across the Web in a way that’s language-agnostic and easy to work with.
This project will focus on how JSON data is structured, where to get it, how to get it, and finally, how to use it in Processing. The weather dashboard you’ll build is just a starting point; I want you to focus on learning how to capture JSON data, parse it, and display it in Processing. Once you’ve created the basic weather dashboard, I encourage you to apply the skills you’ve learned in previous projects to make it more visually pleasing.
WHAT DOES JSON DATA LOOK LIKE?
JSON data often comes in the form of a JSON object, a collection of data that assigns keys to various values in the form of pairs. These key-value pairs are separated by commas and placed inside a set of braces to form the JSON object. Here’s a simplified example of a JSON object:
{
❶ "First Name ": ❷"Derek" ,
"Last Name": "Runberg",
"Height": 6,
"Eye": "Brown",
❸ "Age": 30,
"Author": true,
❹ "Job":
{
"Company": "SparkFun",
"Position": "Regional Education Developer",
"Years": 2
}
}
Between the two bounding braces, this object has five data pairs (also called properties). Each piece of data is labeled with a string (the key) ❶ and has a value assigned to it ❷. The key is separated from its associated value by a colon. If you want to find a specific value in an object, all you have to know is the key that the value is assigned to. If you’re looking for a person’s age in a JSON object like this one, for example, just ask your JSON parsing tool to look up the Age key ❸, and it will return the value associated with Age. In this example, it would return 30.
One cool aspect of JSON data is that a property’s assigned value could be an entire JSON object, in which case the value is known as a nested object. In this example, the data about my job with SparkFun ❹ is an object nested within the object describing me. Nesting becomes really useful when a single value isn’t convenient for describing all aspects of a key. Just imagine the string value for "Job" without nesting!
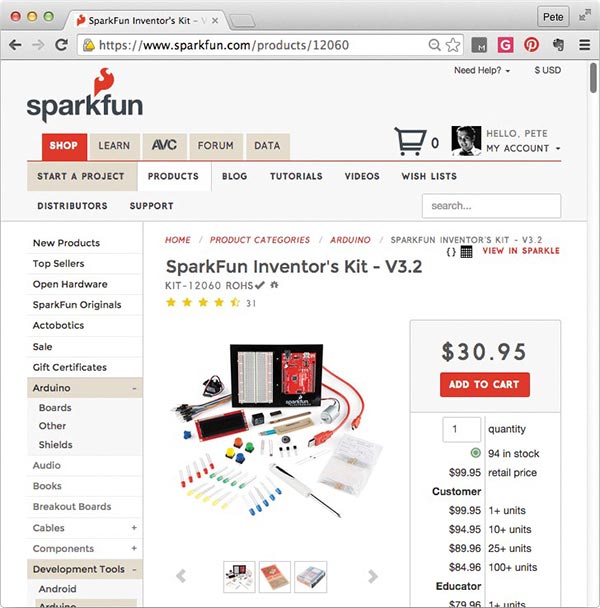
But most JSON data doesn’t start out as neat as the object I just showed. For example, at SparkFun, we share data in JSON format on all the products we carry. Open a browser window and go to https://www.sparkfun.com/SIK/. This will bring up the page for our SparkFun Inventor’s Kit, as seen in Figure 12-1.
FIGURE 12-1: SparkFun.com product page for the SparkFun Inventor’s Kit
To view the product information in JSON format, click the two braces in the upper-right corner. The output may look scary at first, as you can see in Figure 12-2.
FIGURE 12-2: The mess of unformatted JSON data
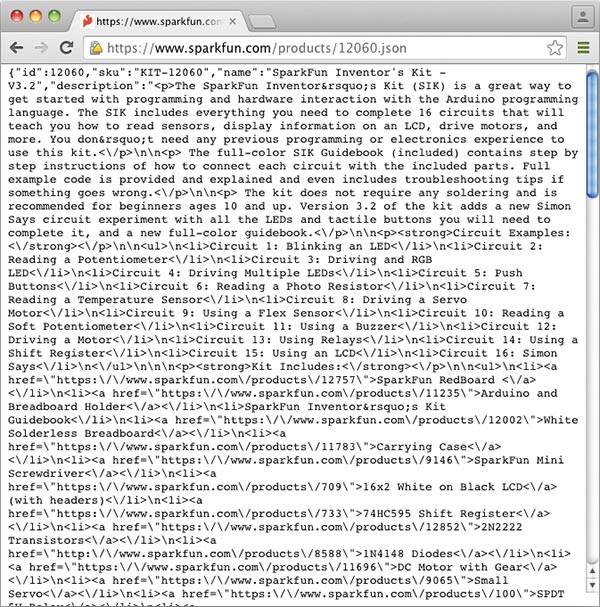
I’ve shown only part of the JSON output, but if you read the text carefully, you’ll see that despite the clutter, the data still follows the same syntax as on page 210, complete with bounding braces, comma-separated pairs, and so on. This is the way your computer reads JSON data, because unlike us, computers don’t need information to be neatly organized visually in order to understand it.
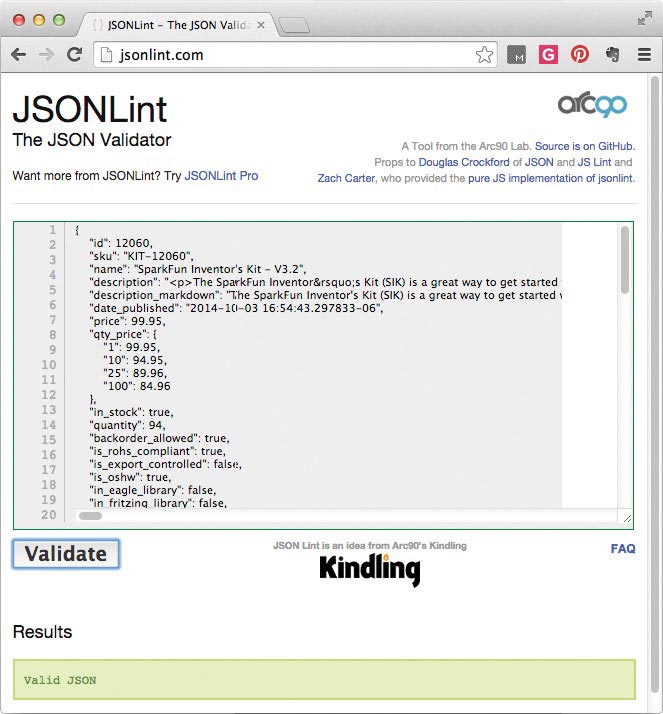
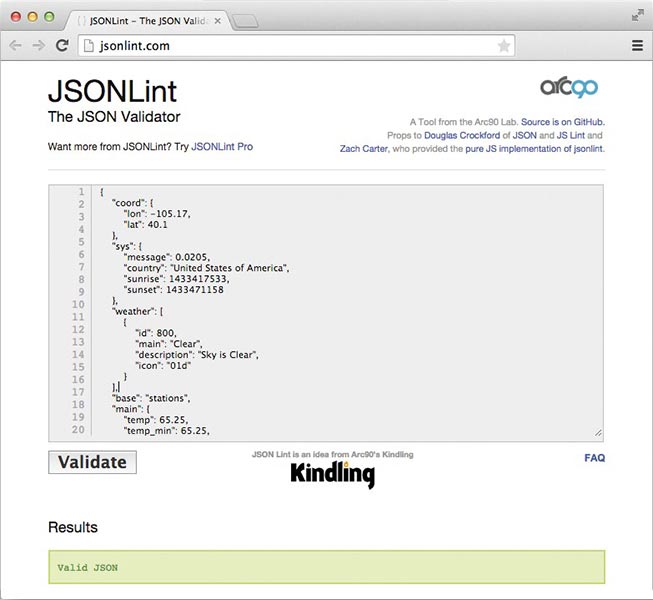
Fortunately, you can reformat this data for human consumption with a free tool called JSONLint. Just copy the URL for the JSON data you want to format, go to http://jsonlint.com/, paste the copied URL into the JSONLint text box, and click Validate. JSONLint will reformat the output as seen in Figure 12-3. Pretty cool!
FIGURE 12-3: JSON data formatted by JSONLint for human consumption
Spend some time exploring the formatted JSON data from the Inventor’s Kit page, and you’ll notice that at SparkFun, we keep a lot of data on each product, from its product number (SKU) to its weight, price, and whether it’s open source. As people purchase items or we restock, our backend computer system for http://www.sparkfun.com/ updates this JSON file.
Scroll toward the bottom of the JSON file you just formatted and look for a subtle difference in some of the data, specifically in the "images" property. This and some other properties in the Inventor Kit’s JSON data don’t use braces; instead, they use square brackets, [ ]. This structure is a JSON array, which you’ll explore now.
ARRAYS OF JSON OBJECTS
A JSON array is like any other array in that it’s an ordered grouping of data. For instance, if I were to extend my first example to include data for multiple people, I’d put them in a JSON array that would look something like this:
[
"me":
{
"First Name": "Derek",
"Last Name": "Runberg",
"Height": 6,
"Eye": "Brown",
"Age": 30
},
"wife":
{
"First Name": "Zondra",
"Last Name": "Runberg",
"Height": 5, "Eye": "Blue",
"Age": 30
},
"son1":
{
"First Name": "Bear",
"Last Name": "Runberg",
"Height": 3.5,
"Eye": "Brown",
"Age": 5
},
"son2":
{
"First Name": "Bridge",
"Last Name": "Runberg",
"Height": 3,
"Eye": "Blue",
"Age": 2
}
"pet": false,
"cars": 2
]
Essentially, an array is a group of comma-separated objects inside a set of square brackets. In this case, the array is my family, and each object in the array is a member of my family. The array is not named because it is the top level of organization, so it should inherit the name of the JSON file as a whole. If an array or object is named, you can assume that it is part of a larger data set, like the arrays you saw in Figure 12-3.
All JSON arrays follow this basic structure:
[
"Objectl":
{
"Objectl name": "Object value",
"Objectl name": "Object value"
},
"Object2":
{
"Object2 name": "Object value",
"Object2 name": "Object value"
},
"Object3": value
]
NOTE
JSON doesn’t have any hard-and-fast rules for what is right and wrong in terms of hierarchy or order But remember, JSON should simplify data for machines and humans alike. If your JSON object doesn’t do that, then you may need to restructure it.
The same rule about nesting holds true for arrays as it does objects: you can nest arrays within other arrays or within objects. You can also have individual ordered pairs within an array.
Now that you’ve seen how JSON looks and how the data is structured, your next project is where the rubber meets the road: you are going to use JSON to build a local weather dashboard in Processing. Are you ready to get some data?
Using JSON data in Processing is actually pretty simple, and you’ve already used most of the concepts necessary to work with it by now. The hard part is knowing what data you’re looking for, where to get it, and how to parse it appropriately. JSON may be a standard for conveying data, but there’s no standard for labeling or arranging that data in the JSON itself.
In your weather application, you will collect JSON data from a database called openweathermap.org. OpenWeatherMap has a great API and structures its JSON data consistently, which is a plus for you. That means that if you finish this project and want to change the city that you fetch OpenWeatherMap JSON data for, the data should just change in Processing, without breaking your code. Take a look at the JSON data provided by OpenWeatherMap now.
Go to http://www.openweathermap.org/, click the API menu option, and select the Current Weather Data page. This page has a number of different options for retrieving weather data. You want to get JSON weather data for your town, so find the “By City Name” section and copy the JSON hyperlink; it should look something like this:
http://api.openweathermap.org/data/2.5/weather?q=London,uk
To view the JSON weather data for your city, simply paste this text into your URL bar and change the query portion of the URL (the part after the ?q=) from London,uk to your own city and state. For example, the URL for my home in Niwot, Colorado, would be:
http://api.openweathermap.org/data/2.5/weather?q=Niwot,CO
This URL returns a bunch of JSON data in the same hard-to-read format you saw on the Inventor’s Kit web page in Figure 12-2, but you can run it through a tool like JSONLint to make the output a little nicer. Here’s an example of neatly formatted weather data for Niwot, Colorado:
{
❶ "coord":
{
"lon": -105.17,
"lat": 40.1
},
❷ "sys":
{
"message": 0.1849,
"country": "United States of America",
"sunrise": 1419862942,
"sunset": 1419896626
},
❸ "weather":
[
{
"id": 803,
"main": "Clouds",
"description": "broken clouds",
"icon": "04d"
}
],
"base": "cmc stations",
❹ "main":
{
"temp": 259.619,
"temp_min": 259.619,
"temp_max": 259.619,
"pressure": 742.33,
"sea_level": 1042.44,
humidity": 66
},
❺ "wind":
{
"speed": 1.41,
"deg": 95.0029
},
❻ "Clouds":
{
"all": 64
},
"dt": 1419882623,
"id": 5580305,
"name": "Niwot",
"cod": 200
}
Wow, that’s a lot of data! But you can break it down a bit and focus just on the parts you really need. Luckily, the data is already grouped into a number of smaller JSON objects, so you can use those to navigate through the information and see if it contains what you’re looking for.
NOTE
You will display the GPS coordinates in your dashboard application, but I highly recommend the Unfolding library for Processing if you ever plan on working with maps, as it provides a quick and easy way to integrate maps and geolocation into your sketches.
The first JSON object is assigned to the "coord" label ❶ and contains the GPS coordinates (longitude and latitude) of the city you queried for. This data is really useful if you are looking to integrate it into a map or compare it with another location.
The second JSON object is under the "sys" property (short for system) ❷ . It contains a system message (which you won’t use; it’s meant as feedback for other tools), the location’s country code, and the sunrise and sunset times in Unix UTC (Coordinated Universal Time) format.
Next is a JSON array with a single weather condition object, "weather" ❸. The first item in the object is the weather condition’s ID number, which you can look up in the table found at http://openweathermap.org/weather-conditions/. But the values you’ll be using are in the "main", "description", and "icon" properties. You’ll use "main" and "description" to display the weather conditions in text format. The "main" property is a general condition like "Clouds", while "description" includes more detailed information about, say, how cloudy it is (in this example, "broken clouds"). You’ll use the reference code in "icon" to display the appropriate icon for the current weather condition in your application later.
Finally, the last three objects contain detailed weather measurements that will make up the bulk of the data you’ll use for your app. The "main" JSON object ❹ houses the temperature, humidity, and pressure values from the weather station. It also includes pressure readings at sea level and at the station’s elevation (or "grnd_level") for comparison purposes.
The temperature measurements are in Kelvin by default, but you can convert them to Fahrenheit by appending &units=imperial to your JSON URL, like so:
http://api.openweathermap.org/data/2.5/weather?q=Niwot,CO&units=imperial
Alternatively, you can append &units=metric to get the temperature in Celsius instead.
The next two JSON objects are smaller, and contain data for cloud coverage and precipitation. The "wind" object ❺ gives the direction (in degrees) and speed (in meters per second) of the wind, while "clouds" ❻ reflects the cloud coverage percentage.
As you can see, once you learn how to read it, JSON is a really clean and simple way to arrange data for others to use, especially if you’re not sure how they’re going to use it. Now you can pull all that data into Processing!
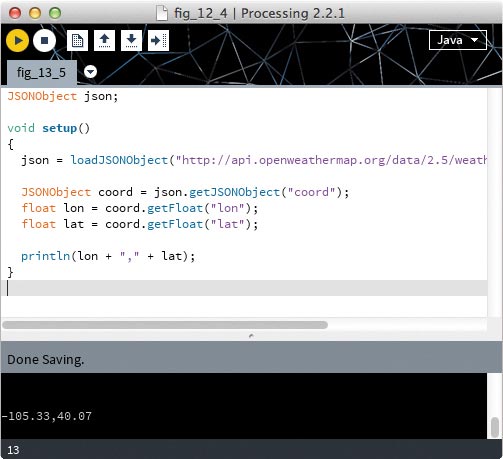
If you haven’t done so already, open a new Processing IDE window. You are going to start by parsing the JSON data to get the weather station’s GPS coordinates. Luckily, Processing has its own JSONObject class to make working with JSON data easy. Here’s how you can use it:
JSONObject json;
void setup()
{
❶ json = loadJSONObject("http://api.openweathermap.org/data/2.5/weather?q=Niwot,CO");
❷ JSONObject coord = json.getJSONObject("coord");
❸ float lon = coord.getFloat("lon");
float lat = coord.getFloat("lat");
❹ println(lon + "," + lat);
}
First, define a variable called json to store the JSONObject in, and use a setup with simple test code to ensure you’re accessing the JSON data correctly. In the setup() function, use the loadJSONObject() function ❶ to fetch the raw JSON weather data from the OpenWeatherMap URL (making sure to pass the URL as a string in double quotes), and then save it to the json variable as a JSONObject.
Remember that the weather data comes as several smaller JSON objects wrapped inside a larger one. That outer object is what I saved in the json variable, but you still need to reach those smaller inner objects to get the data you want. In this case, you’re looking for the weather station’s GPS coordinates, which you know are stored inside a smaller object under the "coord" key.
Since the value of "coord" is a JSON object, use another JSONObject variable (named coord) to store it ❷. Then extract the object by calling json.getJSONObject() with the name of the item you’re looking for ("coord"); this tells the json object that you want it to retrieve the value for that key, and return it to you as a JSONObject.
Using the JSONObject class is helpful, because you can take advantage of its various getter functions to fetch the values you need in their respective data types. In this case, GPS coordinates have decimal points, so parse them as floats using coord.getFloat() ❸ and store the results in lon and lat.
Finally, print out the two coordinate variables to check the data ❹. There is no draw() loop, because you only want to print these values once as a diagnostic. When you click Run, Processing should print the GPS coordinates of the weather station in the console. It may take a few seconds for Processing to access the URL and parse the JSON data, but eventually you should see the longitude and latitude of your weather data printed out in the console, as shown in Figure 12-4.
Success! You just used data from the Web in Processing. Your output may vary depending on the location you use, but you can always double-check your output against the raw JSON data. Just visit your location’s OpenWeatherMap URL as described in "Getting Weather Data in JSON" on page 215, and look at the "lon" and "lat" values inside "coord".
FIGURE 12-4: The output of your JSON object in the console
WRITING A CUSTOM DATA PARSING FUNCTION
Your weather dashboard will keep track of a number of objects, and your initial reaction may be to instantiate all your objects in the setup() function. The problem with creating objects there is that setup() runs only once, so while you’d create all your objects successfully, they would never get updated with newer weather data. In other words, the JSON from the URL would be loaded only once, and updates require revisiting the URL for new data constantly.
You could load the JSON data in your draw() loop, but then you’d be cluttering it with several lines of nondrawing code. What you need is a custom function!
Starting a New Function Tab
You can put all your JSON code in a custom function, and separate it into its own tab in your Processing editor. This simplifies your update code down to a single function that you’ll only need to call once from your draw() loop.
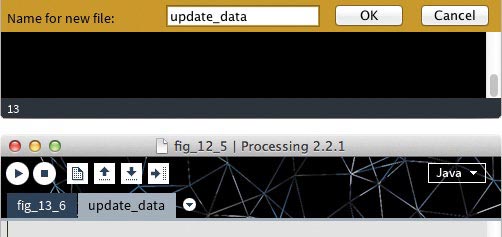
To create a new tab, click the small circle with a down arrow next to your current sketch tab’s name. From the drop-down menu that opens, select New Tab. You will be prompted to name the tab in the alert bar at the bottom, as in Figure 12-5 (top). Name it update_data. (You cannot have spaces in Processing sketch names, so the underscore is a placeholder.)
FIGURE 12-5: Creating a second tab called update_data. The Name text box should appear above your console.
Once you accept the name, you should have a second tab at the top of your IDE window called update_data, like the one in Figure 12-5 (bottom).
Tabs help you organize functions and keep your code neat, and you can treat them like separate pages of your sketch. They’re still part of your sketch, though, so they shouldn’t have setup() functions or draw() loops. For example, as your sketch gets longer, you may place your setup() function on one tab, your draw() loop on another, and a number of custom functions on yet more tabs. It’s up to you.
I suggest keeping setup() and draw() on the main tab and separating custom functions into their own tabs with any global variables they need. Keeping the global variables in the tab of the function that needs them will make your code easier to use in other projects.
Save the sketch with your main tab and update_data tab now, and open your sketch folder. There should actually be two different .pde files because Processing creates a new sketch file for each tab. This makes your Processing code modular: just copy the update_data.pde file and paste it into another sketch folder to reuse it!
In the update_data tab, you’ll write a custom function that updates the JSON data for the sketch. Essentially all of your JSON programming will go in this tab.
Now that you have a new function tab, create a list of variables to store your JSON data in once you’ve parsed it. This list helps you do two important things: it makes those variables global so that all functions can access them, and it ensures that you have the correct data type for the data you are parsing. Listing the variables you need is always a good idea when importing data from anywhere outside of Processing.
Create a list of weather variables at the top of your update_data tab, as shown in Listing 12-1. This way, they’ll be global so that your main tab can access them, but they’ll be transported with your function if you use it somewhere else.
LISTING 12-1: Global weather variables in the update_data tab
//coord variables
float lon;
float lat;
//system variables
int sunR;
int sunS;
//main weather variables
float temp;
float pressure;
int humidity;
//wind variables
float windS;
float windD;
//cloud variable
int cloud;
//weather variables
int ID;
String condition;
String description;
String icon;
PImage weatherIcon;
NOTE
It’s good practice to create your own variable list and decipher the JSON data you want to use before you start parsing that data. I gave you the list of variables this time, but when you use JSON on your own, always start with the variable list!
Compare this variable list to the JSON data on page 216, and you’ll see that I tried to label my variables as close to the names of the JSON data pairs as possible.
Writing a Basic Custom Function in update_data
Now in the update_data tab, start writing your function, using the following syntax:
void update_data()
{
println("Function works!");
}
First, specify the data type you want the function to return (in this case void, because you don’t need to return anything after performing a JSON update). Then, type the function name (update_data), followed by parentheses and a set of braces to put your code in. To keep your code modular, it’s good practice to name the custom function after your tab, if it is the only function within that tab.
For now, inside the braces, write a simple println() statement so you can test the function in the main tab. Go back to your main tab, and create a setup() function. Inside setup(), call your custom function:
void setup()
{
update_data();
}
Run your sketch. If everything is correct, you should see the “Function works!” message in your console once.
Calling your update_data() function is the same as running the code inside it. This may not seem like a big deal now, but you’ll make it more useful. Back in your update_data tab, create a JSONObject named json at the very top of the page:
JSONObject json;
Instantiate json inside the update_data() function so it re-instantiates with updated data every time you call the function.
void update_data()
{
json = loadJSONObject(" http://api.openweathermap.org/data/2.5/weather?q=Boulder,CO&units=imperial");
print(json);
}
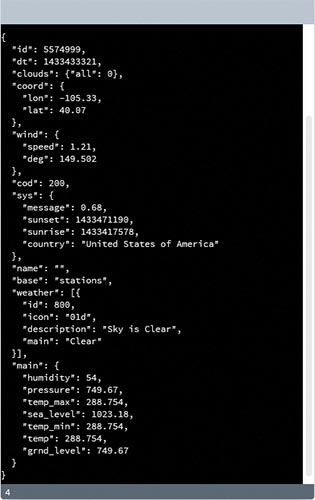
Pass the loadJSONObject() object your location’s weather data URL, and set json to that result. To double-check that Processing is getting the JSON data smoothly, change the println() statement in update_data() to print(json). Run your sketch, and if everything goes as planned, the entire JSON stream should print in your console window, as shown in Figure 12-6.
FIGURE 12-6: JSON data printed in the console
Parsing Your Weather Data in a Custom Function
Now you’ll parse that data so you can actually use it! Recall from the GPS coordinate example that Processing has a convenient JSONObject class that allows you to break down and access any part of a JSON object and parse its data into your variables. The example JSON is formatted as a list of JSON objects and a JSON array, so change your update_data() function as follows to parse it:
JSONObject json;
void update_data()
{
json = loadJSONObject("http://api.openweathermap.org/data/2.5/weather?q=Niwot,CO&units=imperial");
print(json);
❶ JSONObject coord = json.getJSONObject("coord");
lon = coord.getFloat("lon");
lat = coord.getFloat("lat");
JSONObject sys = json.getJSONObject("sys");
sunR = sys.getInt("sunrise");
sunS = sys.getInt("sunset");
JSONObject main = json.getJSONObject("main");
temp = main.getFloat("temp");
pressure = main.getFloat("pressure");
humidity = main.getInt("humidity");
JSONObject wind = json.getJSONObject("wind");
windS = wind.getFloat("speed");
windD = wind.getFloat("deg");
JSONObject clouds = json.getJSONObject("clouds");
cloud = clouds.getInt("all");
❷ JSONArray weather = json.getJSONArray("weather");
JSONObject mainCond = weather.getJSONObject(0);
ID = mainCond.getInt("id");
condition = mainCond.getString("main");
description = mainCond.getString("description");
icon = mainCond.getString("icon");
weatherIcon = loadImage("http://openweathermap.org/img/w/" + icon + ".png");
}
To capture data from JSON, you need to create a JSONObject class object for each JSON object in the JSON file. Working your way down the file, the first object you reach is the "coord" object that holds the GPS coordinates of the weather station. To access the "coord" JSON object, you have to create another class object for coord and instantiate it as json.getJSONObject("coord"). From there you can initialize your lon and lat variables using the getFloat() function within the class object of coord as shown at ❶.
To capture the paired data, you pass the getFloat() function the name of the pair as a string. So coord.getFloat("lon") returns the longitude value that you’ll use to set the lon variable in your Processing sketch. The process is similar for all of the other JSON objects in the file, and the getter function changes according to the data type. Continue in the same manner for the next four JSON objects, and parse only the data that you need.
The last piece to the JSON puzzle is the JSON array in the file. Parsing the array follows roughly the same pattern as parsing an object, but with an extra step. Recall that any array is an ordered list numbered from 0; that is, the first item in the array is element 0, the second item is 1, and so on. A JSON array is no different.
First create an array object called weather, and instantiate it with json.getJSONArray("weather") ❷, which looks up the value of "weather" in the raw JSON object, and returns a JSONArray object you can use. From there, you can parse the objects in the array. There is only one object in this array, so you’d work only with element 0. You create a JSONObject class object called mainCond and instantiate it as weather.getJSONObject(0). You pass 0 instead of a string because you are parsing the object’s position in the array, not the object itself. From there, parse the four variables you are looking for. Notice that the last three variables are strings and are required to use the getString() functions.
If you read through each section of this code, you can see that it follows the same pattern as the GPS coordinate example in "Using JSON Data in Processing" on page 218. You create a JSONObject variable, initialize it with the JSON object you are going to parse, and then parse it for the values you want below that. During this process, I suggest having the JSON file open (as in Figure 12-7) so you can reference names of objects and data types without having to play a guessing game. This step is case sensitive, so check your spelling!
FIGURE 12-7: Refer to the JSON file you’re working with when trying to parse it.
To test your new code, go back to your main tab and println() any of the variables you have parsed data to. A value matching the JSON data should appear in the console.
DRAWING THE WEATHER DASHBOARD IN THE MAIN TAB
Now that you have your data, you can build your weather dashboard. Go back to your main tab and update your current code as follows:
void setup()
{
size(400,500);
update_data();
}
First, flesh out the setup code and set the dashboard window to a reasonable size of 400×500. Then, call your update_data() function to make sure your sketch can access the JSON file on the Web. You will move it to your draw() loop later, but calling it once in setup() now lets you test your code and see any data errors only once.
Now it’s time to show the dashboard in the draw() loop!
void draw()
{
background(150);
textSize(20);
fill(0);
text("GPS Location: " + lat + " , " + lon,50,100);
text("Sunrise: " + sunR,50,125);
text("Sunset: " + sunS,50,150);
text("Temperature: " + temp,50,175);
text("Atmospheric Pressure: " + pressure,50,200);
text("Humidity: " + humidity + "%",50,225);
text("Wind Speed: " + windS + "mps",50,250);
text("Wind Direction: " + windD,50,275);
text("Cloud Coverage: " + cloud + "%",50,300);
text("Conditions: " + condition + " , " + description,50,325);
}
Set the background color of the sketch, and then use the text() function to display all the weather stats you want, starting with the GPS location and moving down the variable list. Here, I concatenated labels and units of measurement wherever they made sense for the values, but you can make your text say anything you like.
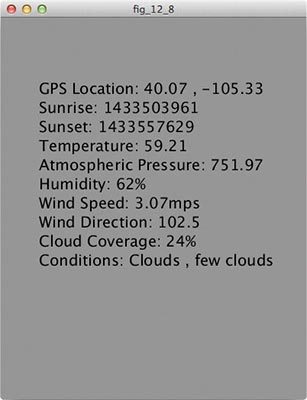
Once you get this code into your draw() loop, run your sketch. You should get something that looks similar to Figure 12-8, but with different data (assuming you didn’t use Niwot, Colorado, as your location).
FIGURE 12-8: A simple weather dashboard using JSON data
Awesome! You took JSON data from the Web and translated it into something useful and human-friendly. If you leave this running for a while, you’ll notice that it doesn’t update at all. That is because your update_data() function call is still in setup(), which collects the JSON file only once at the beginning of your sketch. But you can’t just drop it into your draw() loop yet; right now, you’d call the JSON URL 60 times a second! This would cause OpenWeatherMap to block your Processing sketch from accessing its JSON data after about 15 seconds or so, because it would think you were spamming the site.
To solve this problem, create an if() statement that runs the update_data() function every 15 minutes and place it at the end of the draw() loop:
if((minute()%15 == 0) && (second() == 1))
{
update_data();
}
This should keep the sketch from bombarding OpenWeatherMap with JSON requests. I also suggest adding the frameRate() function to the setup() and passing it 1 so that it runs the draw() loop only once per second to reduce the number of calls even further during that second when the if() statement is true.
PULLING A WEATHER ICON FROM THE WEB
Now for the icing on the cake for this project: a little weather icon! Every weather application has one, so why not yours?
If you scroll up through your global variables, you will notice that you capture a string called "icon". That string is the icon code for the current weather at your location. You can access this icon from OpenWeatherMap using a URL call specific to that icon. Figure 12-9 shows an example icon.
FIGURE 12-9: A sample weather icon

Ask Processing to load an image file from a URL, and save it to a variable so you can use it in your sketch as you did with the JSON data. Just like including any other image file in Processing, the first step is to create a PImage variable to use it with. Fortunately, you’ve done that already if you created the global variables in "Listing Data Variables" on page 221; there should be a weatherIcon object at the end of your list in the update_data tab. You should also have already instantiated the weatherIcon object, in Listing 12-1. Make sure your update_data() function contains the following line:
PImage weatherIcon = loadImage("http://openweathermap.org/img/w/" + icon + ".png");
Then, head back to your main tab and add a simple call to image() near the end of the draw() loop with your shiny new weather icon. Here are my final setup() and draw() loops for the dashboard:
void setup()
{
size(400,500);
update_data();
frameRate(1);
}
{
background(150);
textSize(20);
fill(0);
text("GPS Location: " + lat + " , " + lon,100,100); text("Sunrise: " + sunR,100,125);
text("Sunset: " + sunS,100,150);
text("Temperature: " + temp,100,175);
text("Atmospheric Pressure: " + pressure,100,200);
text("Humidity: " + humidity + "%",100,225);
text("Wind Speed: " + windS+ "mps",100,250);
text("Wind Direction: " + windD,100,275);
text("Cloud Coverage: " + cloud + "%",100,300);
text("Conditions: " + condition + " , " + description,100,325);
image(weatherIcon,50,350);
if((minute()%15 == 0) && (second() == 1))
{
update_data();
}
}
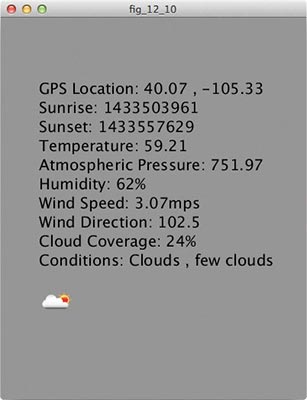
Run your sketch with these changes, and now you should see a weather icon at the bottom of your sketch, as in Figure 12-10.
FIGURE 12-10: Final weather dashboard using JSON data. It’s warm in Niwot today!
For a cherry on top, make your dashboard a little more visually appealing by adding a photo of the location of the weather conditions. In my case, that’s SparkFun headquarters. Luckily, there’s no shortage of photos of this building!
In my main tab, I added an image to my project and loaded it into the sketch, just like you did in Chapter 6. I created an image object using the PImage data type, used loadImage() in the setup() function to load the image to the object, and then used the image() function to display it in my draw() loop. I don’t show the code for this mod because I want you to try it on your own, but you can see my final dashboard in Figure 12-11.
FIGURE 12-11: Final weather dashboard, including an image of my location
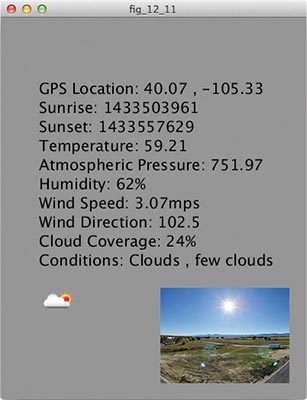
My dashboard may seem a little stark and gray, but that bright, sunny picture certainly communicates the weather outside!
Even without this final touch, you’ve taken data from the Web and built something amazing. Try extending the project by adding visual readouts in bar graph form. You could even draw a little thermometer that changes with the data updates.
When you’re done exploring this weather data, look for other data in JSON format and create more Processing sketches to visualize it. A great place to start is http://www.data.gov/, which is a repository for open government data that anyone can use. There are a number of different data formats there, but JSON is pretty popular. Now, go forth and do something big with big data!