
Chapter 5. Using Redis for application support
This chapter covers
- Logging to Redis
- Counters and statistics
- Discovering city and country from IP address
- Service discovery and configuration
In the last chapter, we spent most of our time talking about how to keep Redis up and running as part of a larger group of systems. In this chapter, we’ll talk about using Redis to support other parts of your environment: from gathering information about the current state of the system with logs and counters, to discovering information about the clients using your system, all the way to configuring your system by using Redis as a directory.
Overall, this chapter offers control of and insight into how your system operates during runtime. As you read along, keep in mind that we’re looking to support the continued running of higher-level applications—that the components we build in this chapter aren’t the applications themselves, but will help to support those applications. This support comes by way of recording information about the applications and application visitors, and a method of configuring applications. Let’s look at the first level of monitoring that we can add through logging.
5.1. Logging to Redis
As we build applications and services, being able to discover information about the running system becomes increasingly important. Being able to dig into that information to diagnose problems, discover problems before they become severe, or even just to discover information about users—these all necessitate logging.
In the world of Linux and Unix, there are two common logging methods. The first is logging to a file, where over time we write individual log lines to a file, and every once in a while, we write to a new file. Many thousands of pieces of software have been written do this (including Redis itself). But this method can run into issues because we have many different services writing to a variety of log files, each with a different way of rolling them over, and no common way of easily taking all of the log files and doing something useful with them.
Running on TCP and UDP port 514 of almost every Unix and Linux server available is a service called syslog, the second common logging method. Syslog accepts log messages from any program that sends it a message and routes those messages to various on-disk log files, handling rotation and deletion of old logs. With configuration, it can even forward messages to other servers for further processing. As a service, it’s far more convenient than logging to files directly, because all of the special log file rotation and deletion is already handled for us.
Replacing syslog
Whether you end up using the logging methods described here, you owe it to yourself to consider replacing your current syslog daemon (which is likely Rsyslogd) with syslog-ng. Having used and configured both systems, I find that the configuration language that syslog-ng provides for directing log messages is easier to use. And though I don’t have the space or time to build it in this book, building a service that consumes syslog messages and puts them into Redis is a great way to offer a layer of indirection between what needs to happen now for processing a request, and what can happen later (like logging or updating counters).
Having logs available in files on a single server (thanks to syslog forwarding) is a great long-term plan with logging (remember to back them up). In this section, we’ll talk about using Redis as a way of keeping more time-sensitive logs, to function as a replacement for syslog messages being stored in the short term. Our first view into changing logs is a continuously updated stream of recent log messages.
5.1.1. Recent logs
When building a system, knowing what’s important to record can be difficult. Do you record every time someone logs in? What about when they log out? Do you log every time someone changes their account information? Or do you only log errors and exceptions? I can’t answer those questions for you directly, but I can offer a method of keeping a recent list of log messages in Redis, which will let you get a snapshot view of your logs at any time.
To keep a recent list of logs, we’ll LPUSH log messages to a LIST and then trim that LIST to a fixed size. Later, if we want to read the log messages, we can perform a simple LRANGE to fetch the messages. We’ll take a few extra steps to support different named log message queues and to support the typical log severity levels, but you can remove either of those in your own code if you need to. The code for writing recent logs to Redis is shown in the next listing.
Listing 5.1. The log_recent() function
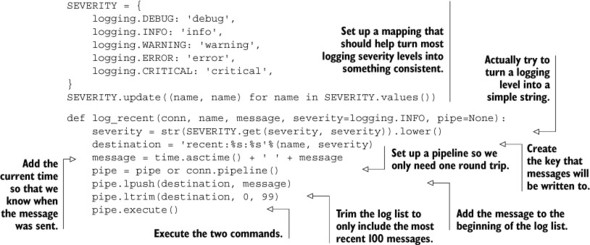
Aside from the part that handles turning the different log levels into useful strings like info and debug, the log_recent() function is simple—a quick LPUSH followed by an LTRIM. Now that you have a better idea of what’s going on right now, can we discover the most common (and maybe the most important) messages?
5.1.2. Common logs
If you’ve been running log_recent(), you’ll probably discover that although it’s useful for getting an idea of what’s happening right now, it’s not very good at telling you whether any important messages were lost in the noise. By recording information about how often a particular message appears, you could then look through the messages ordered by how often they happened to help you determine what’s important.
A simple and useful way of knowing how often a message appears is by storing the message as a member of a ZSET, with the score being how often the message appears. To make sure that we only see recent common messages, we’ll rotate our record of common messages every hour. So that we don’t lose everything, we’ll keep the previous hour’s worth of common messages. Our code for keeping track of and rotating common log messages is shown next.
Listing 5.2. The log_common() function
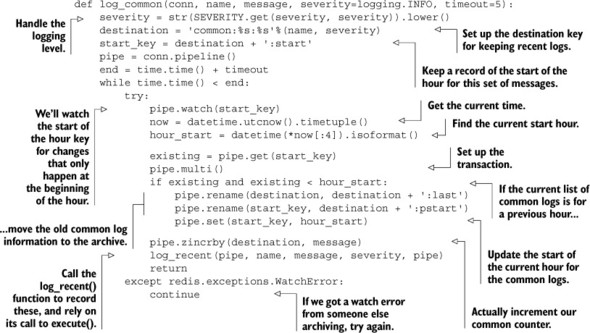
This logging function was more involved than the recent logging function, primarily due to being careful when taking care of old logs. That’s why we used the WATCH/MULTI/EXEC transaction to rename the ZSET and rewrite the key that tells us what hour the current data is for. We also passed the pipeline through to the log_recent() function to minimize round trips to Redis while keeping track of common and recent logs.
Now that we’ve started to gather information about running software in Redis by storing recent and common logs, what other kinds of information would be useful to keep in Redis?
5.2. Counters and statistics
As you saw way back in chapter 2 when I introduced the concept of counting individual page visits, having basic hit count information can (for example) change the way we choose our caches. But our example from chapter 2 was very simple, and reality is rarely that simple, especially when it involves a real website.
The fact that our site received 10,000 hits in the last 5 minutes, or that the database handled 200 writes and 600 reads in the last 5 seconds, is useful information to know. If we add the ability to see that information over time, we can notice sudden or gradual increases in traffic, predict when server upgrades are necessary, and ultimately save ourselves from downtime due to an overloaded system.
This section will work through two different methods for recording both counters and statistics in Redis, and will finish by discussing how to simplify the collection of our example statistics. Both of these examples are driven by real use cases and requirements. Our next stop on the road of application introspection is collecting time series counters in Redis.
5.2.1. Storing counters in Redis
As we monitor our application, being able to gather information over time becomes ever more important. Code changes (that can affect how quickly our site responds, and subsequently how many pages we serve), new advertising campaigns, or new users to our system can all radically change the number of pages that are loaded on a site. Subsequently, any number of other performance metrics may change. But if we aren’t recording any metrics, then it’s impossible to know how they’re changing, or whether we’re doing better or worse.
In an attempt to start gathering metrics to watch and analyze, we’ll build a tool to keep named counters over time (counters with names like site hits, sales, or database queries can be crucial). Each of these counters will store the most recent 120 samples at a variety of time precisions (like 1 second, 5 seconds, 1 minute, and so on). Both the number of samples and the selection of precisions to record can be customized as necessary.
The first step for keeping counters is actually storing the counters themselves.
Updating a counter
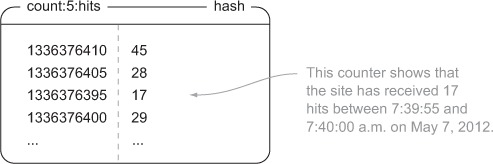
In order to update counters, we’ll need to store the actual counter information. For each counter and precision, like site hits and 5 seconds, we’ll keep a HASH that stores information about the number of site hits that have occurred in each 5-second time slice. The keys in the hash will be the start of the time slice, and the value will be the number of hits. Figure 5.1 shows a selection of data from a hit counter with 5-second time slices.
Figure 5.1. A HASH that shows the number of web page hits over 5-second time slices around 7:40 a.m. on May 7, 2012
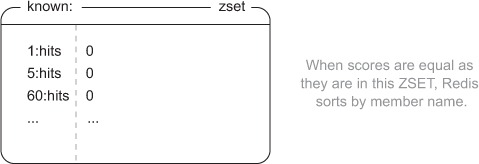
As we start to use counters, we need to record what counters have been written to so that we can clear out old data. For this, we need an ordered sequence that lets us iterate one by one over its entries, and that also doesn’t allow duplicates. We could use a LIST combined with a SET, but that would take extra code and round trips to Redis. Instead, we’ll use a ZSET, where the members are the combinations of precisions and names that have been written to, and the scores are all 0. By setting all scores to 0 in a ZSET, Redis will try to sort by score, and finding them all equal, will then sort by member name. This gives us a fixed order for a given set of members, which will make it easy to sequentially scan them. An example ZSET of known counters can be seen in figure 5.2.
Figure 5.2. A ZSET that shows some known counters
Now that we know what our structures for counters look like, what goes on to make that happen? For each time slice precision, we’ll add a reference to the precision and the name of the counter to the known ZSET, and we’ll increment the appropriate time window by the count in the proper HASH. Our code for updating a counter looks like this.
Listing 5.3. The update_counter() function
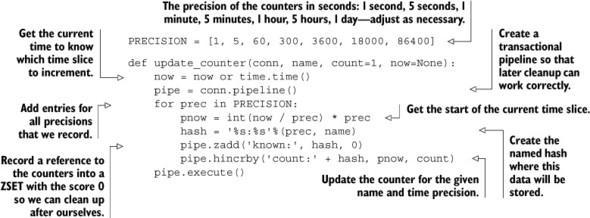
Updating the counter information isn’t so bad; just a ZADD and HINCRBY for each time slice precision. And fetching the information for a named counter and a specific precision is also easy. We fetch the whole HASH with HGETALL, convert our time slices and counters back into numbers (they’re all returned as strings), sort them by time, and finally return the values. The next listing shows our code for fetching counter data.
Listing 5.4. The get_counter() function
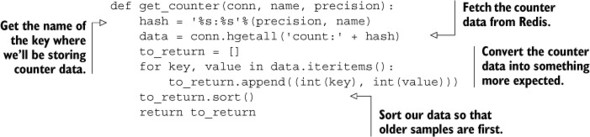
We did exactly what we said we were going to do. We fetched the data, ordered it sequentially based on time, and converted it back into integers. Let’s look at how we prevent these counters from keeping too much data.
Cleaning out old counters
Now we have all of our counters written to Redis and we can fetch our counters with ease. But as we update our counters, at some point we’re going to run out of memory if we don’t perform any cleanup. Because we were thinking ahead, we wrote to our known ZSET the listing of known counters. To clean out the counters, we need to iterate over that listing and clean up old entries.
Why not use EXPIRE?
One limitation of the EXPIRE command is that it only applies to whole keys; we can’t expire parts of keys. And because we chose to structure our data so that counter X of precision Y is in a single key for all time, we have to clean out the counters periodically. If you feel ambitious, you may want to try restructuring the counters to change the data layout to use standard Redis expiration instead.
As we process and clean up old counters, a few things are important to pay attention to. The following list shows a few of the more important items that we need to be aware of as we clean out old counters:
- New counters can be added at any time.
- Multiple cleanups may be occurring at the same time.
- Trying to clean up daily counters every minute is a waste of effort.
- If a counter has no more data, we shouldn’t try to clean it up any more.
With all of those things in mind, we’ll build a daemon function similar in operation to the daemon functions that we wrote back in chapter 2. As before, we’ll repeatedly loop until the system is told to quit. To help minimize load during cleanup, we’ll attempt to clean out old counters roughly once per minute, and will also clean up old counters at roughly the schedule that they’re creating new entries, except for counters that get new entries more often than once per minute. If a counter has a time slice of 5 minutes, we’ll try to clean out old entries from that counter every 5 minutes. Counters that have new entries more often (1 second and 5 seconds in our example), we’ll clean out every minute.
To iterate over the counters, we’ll fetch known counters one by one with ZRANGE. To clean a counter, we’ll fetch all of the start times for a given counter, calculate which items are before a calculated cutoff (120 samples ago), and remove them. If there’s no more data for a given counter, we’ll remove the counter reference from the known ZSET. Explaining what goes on is simple, but the details of the code show some corner cases. Check out this listing to see the cleanup code in full detail.
Listing 5.5. The clean_counters() function

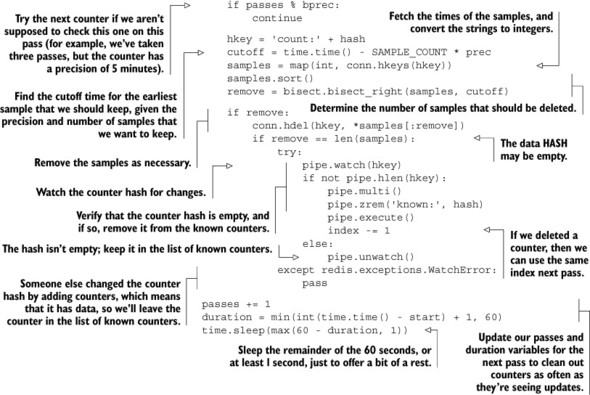
As described earlier, we iterate one by one over the ZSET of counters, looking for items to clean out. We only clean out counters that should be cleaned in this pass, so we perform that check early. We then fetch the counter data and determine what (if anything) should be cleaned up. After cleaning out old data as necessary, if we don’t believe that there should be any remaining data, we verify that there’s no more data for the counter and remove it from our ZSET of counters. Finally, after passing over all of the counters, we calculate how long it took to perform a pass, and sleep roughly the remainder of the minute we left for ourselves to perform the full cleanup, until the next pass.
Now that we have counter data, are cleaning it up, and can fetch it, it’s just a matter of building an interface for consuming the data. Sadly, that part is out of the scope of this book, but there are a few usable JavaScript plotting libraries that can help you out on the web side of things (I’ve had good experiences with jqplot [http://www.jqplot.com/], Highcharts [http://www.highcharts.com/], dygraphs [http://dygraphs.com/], and D3 [http://d3js.org/] for personal and professional uses).
When dealing with the depth of complexity in a real website, knowing that a page gets hit thousands of times a day can help us to decide that the page should be cached. But if that page takes 2 milliseconds to render, whereas another page gets one tenth the traffic but takes 2 seconds to render, we can instead direct our attention to optimizing the slower page. In the next section, we change our approach from keeping precise counters that give us data over time, to keeping aggregate statistics to help us make more nuanced decisions about what to optimize.
5.2.2. Storing statistics in Redis
Truth be told, I’ve personally implemented five different methods of storing statistics in Redis. The method described here takes many of the good ideas from those methods and combines them in a way that allows for the greatest flexibility and opportunity to scale. What are we going to build?
We’ll build a method to store statistics that have a similar scope to our log_common() function from section 5.1.2 (the current hour and the last hour). We’ll collect enough information to keep track of the minimum, maximum, average value, standard deviation, sample count, and the sum of values that we’re recording. We record so much information because we can just about guarantee that if we aren’t recording it, we’ll probably need it.
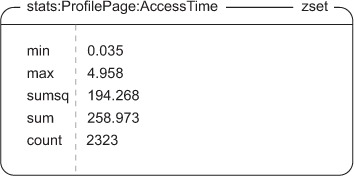
For a given named context and type, we’ll store a group of values in a ZSET. We won’t use the ZSET for its ability to sort scores, but instead for its ability to be unioned against another ZSET, keeping only the MIN or MAX of items that intersect. The precise information that we’ll store for that context and type is the minimum value, the maximum value, the count of values, the sum of the values, and the sum of the squares of the values. With that information, we can calculate the average and standard deviation. Figure 5.3 shows an example of a ZSET holding this information for the ProfilePage context with statistics on AccessTime.
Figure 5.3. Example access time stats for the profile page. Remember that ZSETs are sorted by score, which is why our order seems strange compared to our description.
Now that we know the type of data that we’ll be storing, how do we get the data in there? We’ll start like we did with our common logs by checking to make sure that our current data is for the correct hour, moving the old data to an archive if it’s not for the current hour. We’ll then construct two temporary ZSETs—one with the minimum value, the other with the maximum value—and ZUNIONSTORE them with the current stats with an aggregate of MIN and MAX, respectively. That’ll allow us to quickly update the data without needing to WATCH a potentially heavily updated stats key. After cleaning up those temporary ZSETs, we’ll then ZINCRBY the count, sum, and sumsq members of the statsZSET. Our code for performing this operation is shown next.
Listing 5.6. The update_stats() function
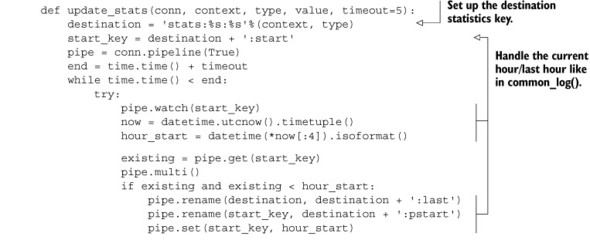
We can ignore almost all of the first half of the code listing, since it’s a verbatim copy of the rollover code from our log_common() function from section 5.1.2. The latter half does exactly what we described: creating temporary ZSETs, ZUNIONSTOREing them with our destination ZSET with the proper aggregates, cleaning the temporary ZSETs, and then adding our standard statistics information. But what about pulling the statistics information back out?
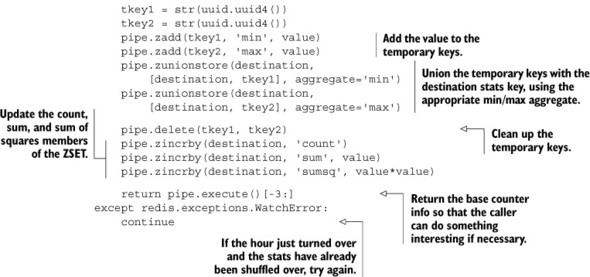
To pull the information back out, we need to pull all of the values from the ZSET and then calculate the average and standard deviation. The average is simply the sum member divided by the count member. But the standard deviation is more difficult. With a bit of work, we can derive the standard deviation from the information we have, though for the sake of brevity I won’t explain the math behind it. Our code for fetching stats is shown here.
Listing 5.7. The get_stats() function
Aside from the calculation of the standard deviation, the get_stats() function isn’t surprising. And for those who’ve spent some time on the Wikipedia page for standard deviation, even calculating the standard deviation shouldn’t be all that surprising. But with all of this statistical information being stored, how do we know what information to look at? We’ll be answering that question and more in the next section.
5.2.3. Simplifying our statistics recording and discovery
Now we have our statistics stored in Redis—what next? More specifically, now that we have information about (for example) access time on every page, how do we discover which pages take a long time on average to generate? Or how do we know when it takes significantly longer to generate a page than it did on previous occasions? The simple answer is that we need to store more information in a way that lets us discover when both situations happen, which we’ll explore in this section.
If we want to record access times, then we need to calculate access times. We can spend our time adding access time calculations in various places and then adding code to record the access times, or we can implement something to help us to calculate and record the access times. That same helper could then also make that information available in (for example) a ZSET of the slowest pages to access on average, and could even report on pages that take a long time to access compared to other times that page was accessed.
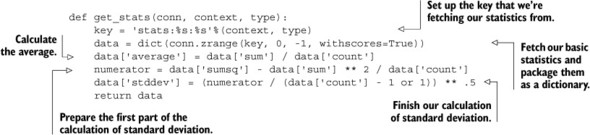
To help us calculate and record access times, we’ll write a Python context manager[1] that will wrap our code that we want to calculate and record access times for. This context manager will get the current time, let the wrapped code execute, and then calculate the total time of execution, record it in Redis, and also update a ZSET of the highest access time contexts. The next listing shows our context manager for performing this set of operations.
1 In Python, a context manager is a specially defined function or class that will have parts of it executed before and after a given block of code is executed. This allows, for example, the easy opening and automatic closing of files.
Listing 5.8. The access_time() context manager
There’s some magic going on in the access_time() context manager, and it’ll probably help to see it in use to understand what’s going on. The following code shows the access_time() context manager being used to record access times of web pages that are served through a similar kind of callback method as part of a middleware layer or plugin that was used in our examples from chapter 2:
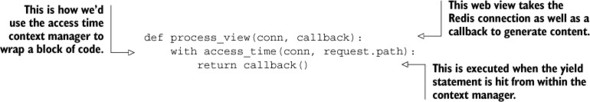
After seeing the example, even if you don’t yet understand how to create a context manager, you should at least know how to use one. In this example, we used the access time context manager to calculate the total time to generate a web page. This context manager could also be used to record the time it takes to make a database query or the amount of time it takes to render a template. As an exercise, can you think of other types of context managers that could record statistics that would be useful? Or can you add reporting of access times that are more than two standard deviations above average to the recent_log()?
Gathering statistics and counters in the real world
I know that we just spent several pages talking about how to gather fairly important statistics about how our production systems operate, but let me remind you that there are preexisting software packages designed for collecting and plotting counters and statistics. My personal favorite is Graphite (http://graphite.wikidot.com/), which you should probably download and install before spending too much time building your own data-plotting library.
Now that we’ve been recording diverse and important information about the state of our application into Redis, knowing more about our visitors can help us to answer other questions.
5.3. IP-to-city and -country lookup
While we’ve been collecting statistics and logs in Redis, we’ve been gathering information about visitor behavior in our system. But we’ve been ignoring one of the most important parts of visitor behavior—where the visitor is coming from. In this section, we’ll build a set of functions that we can use to parse an IP-to-location database, and we’ll write a function to look up IP addresses to determine the visitor’s city, region (state), and country. Let’s look at an example.
As visitors to Fake Game Company’s game have multiplied, players have been coming from all over the world to visit and play. Though tools like Google Analytics have helped Fake Game Company to understand which major countries their users are from, they want to know cities and states to better understand their users. It’s our job to use one of the IP address-to-city databases and combine it with Redis to discover the locations of players.
We use Redis instead of a typical relational database because Redis will generally be faster for this (and other) use cases. And we use Redis over local lookup tables because the amount of information necessary to locate users is large enough to make loading tables on application startup a relatively expensive operation. To start using our lookup tables, we first need to load the tables into Redis.
5.3.1. Loading the location tables
For development data, I’ve downloaded a free IP-to-city database available from http://dev.maxmind.com/geoip/geolite. This database contains two important files: GeoLiteCity-Blocks.csv, which contains information about ranges of IP addresses and city IDs for those ranges, and GeoLiteCity-Location.csv, which contains a mapping of city IDs to the city name, the name of the region/state/province, the name of the country, and some other information that we won’t use.
We’ll first construct the lookup table that allows us to take an IP address and convert it to a city ID. We’ll then construct a second lookup table that allows us to take the city ID and convert it to actual city information (city information will also include region and country information).
The table that allows us to find an IP address and turn it into a city ID will be constructed from a single ZSET, which has a special city ID as the member, and an integer value of the IP address as the score. To allow us to map from IP address to city ID, we convert dotted-quad format IP addresses to an integer score by taking each octet as a byte in an unsigned 32-bit integer, with the first octet being the highest bits. Code to perform this operation can be seen here.
Listing 5.9. The ip_to_score() function
def ip_to_score(ip_address):
    score = 0
    for v in ip_address.split('.'):
        score = score * 256 + int(v, 10)
    return score
After we have the score, we’ll add the IP address mapping to city IDs first. To construct a unique city ID from each normal city ID (because multiple IP address ranges can map to the same city ID), we’ll append a _ character followed by the number of entries we’ve added to the ZSET already, as can be seen in the next listing.
Listing 5.10. The import_ips_to_redis() function
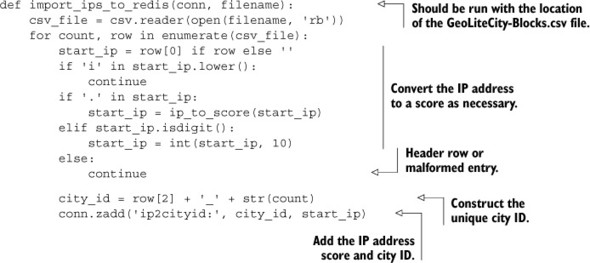
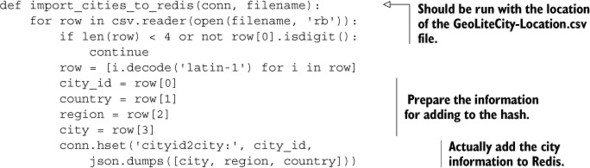
When our IP addresses have all been loaded by calling import_ips_to_redis(), we’ll create a HASH that maps city IDs to city information, as shown in the next listing. We’ll store the city information as a list encoded with JSON, because all of our entries are of a fixed format that won’t be changing over time.
Listing 5.11. The import_cities_to_redis() function
Now that we have all of our information in Redis, we can start looking up IP addresses.
5.3.2. Looking up cities
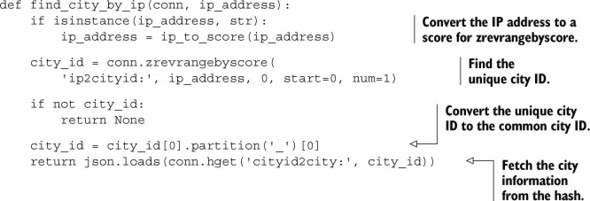
To support looking up IP addresses, we added integer scores to a ZSET to represent the beginning of IP address ranges for a given city ID. In order to find a city given an IP address, we map the IP address to a similarly calculated score and then find the city ID that has the largest starting IP address less than or equal to the IP address we pass. We can use ZREVRANGEBYSCORE with the optional START and NUM arguments set to 0 and 1, respectively, to fetch this information. After we’ve discovered the city ID, we can fetch the city information from our HASH. Our function for finding which city an IP address is in can be seen next.
Listing 5.12. The find_city_by_ip() function
We can now look up city information based on IP address and begin to analyze where our users are coming from. This method of converting data into integers for use with a ZSET is useful, and can greatly simplify the discovery of individual items or ranges. We’ll talk more about these kinds of data transformations in chapter 7. But for now, let’s look at how we can use Redis to help us find and connect to other servers and services.
5.4. Service discovery and configuration
As your use of Redis and other services grows over time, you’ll eventually come to a situation where keeping configuration information can get out of hand. It’s not a big deal when you have one Redis server, one database server, and one web server. But when you have a Redis master with a few slaves, or different Redis servers for different applications, or even master and slave database servers, keeping all of that configuration can be a pain.
Typically, configuration information for connecting to different services and servers is contained in configuration files that are stored on disk. And in situations where a machine breaks down, a network connection goes down, or something else causes us to need to connect to a different server, we’ll usually need to update a number of configuration files in one of a number of locations. In this section, we’ll talk about how we can move much of our configuration out of files and into Redis, which will let applications almost configure themselves.
Let’s start with a simple live configuration to see how Redis can help us.
5.4.1. Using Redis to store configuration information
To see how generally difficult configuration management can be, we only need to look at the simplest of configurations: a flag to tell our web servers whether we’re under maintenance. If so, we shouldn’t make requests against the database, and should instead return a simple “Sorry, we’re under maintenance; try again later” message to visitors. If the site isn’t under maintenance, all of the normal web-serving behavior should happen.
In a typical situation, updating that single flag can force us to push updated configuration files to all of our web servers, and may force us to reload configurations on all of our servers, if not force us to restart our application servers themselves.
Instead of trying to write and maintain configuration files as our number of services grows, let’s instead write our configuration to Redis. By putting our configuration in Redis and by writing our application to fetch configuration information from Redis, we no longer need to write tools to push out configuration information and cause our servers and services to reload that configuration.
To implement this simple behavior, we’ll assume that we’ve built a middleware layer or plugin like we used for caching in chapter 2 that will return our maintenance page if a simple is_under_maintenance() function returns True, or will handle the request like normal if it returns False. Our actual function will check for a key called is-under-maintenance. If the key has any value stored there, we’ll return True; otherwise, we’ll return False. To help minimize the load to Redis under heavy web server load (because people love to hit Refresh when they get maintenance pages), we’ll only update our information once per second. Our function can be seen in this listing.
Listing 5.13. The is_under_maintenance() function
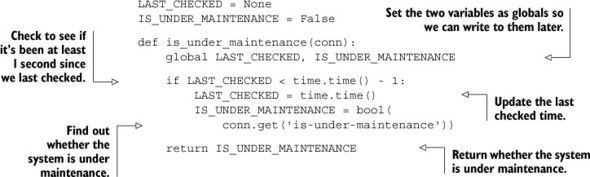
With that one function plugged into the right place in our application, we could affect the behavior of thousands of web servers within 1 second. We chose 1 second to help reduce load against Redis for very heavily trafficked web sites, but we can reduce or remove that part of the function if our needs require faster updates. This seems like a toy example, but it demonstrates the power of keeping configuration information in a commonly accessible location. But what about more intricate configuration options?
5.4.2. One Redis server per application component
As countless developers have discovered during our increasing use of Redis, at some point we outgrow our first Redis server. Maybe we need to log more information, maybe we need more space for caching, or maybe we’ve already skipped ahead and are using one of the more advanced services described in later chapters. For whatever reason, we’ll need more servers.
To help with the ease of transitioning to more servers, I recommend running one Redis server for every separate part of your application—one for logging, one for statistics, one for caching, one for cookies, and so forth. Note that you can run multiple Redis servers on a single machine; they just need to run on different ports. Alternatively, if you want to reduce your system administration load, you can also use different “databases” in Redis. Either way, by having different data split up into different key spaces, your transition to more or larger servers is somewhat simplified. Unfortunately, as your number of servers and/or Redis databases increases, managing and distributing configuration information for all of those servers becomes more of a chore.
In the previous section, we used Redis as our source for configuration information about whether we should serve a maintenance page. We can again use Redis to tell us information about other Redis servers. More specifically, let’s use a single known Redis server as a directory of configuration information to discover how to connect to all of the other Redis servers that provide data for different application or service components. While we’re at it, we’ll build it in such a way that when configurations change, we’ll connect to the correct servers. Our implementation will be more generic than this example calls for, but I’m sure that after you start using this method for getting configuration information, you’ll start using it for non-Redis servers and services.
We’ll build a function that will fetch a JSON-encoded configuration value from a key that’s named after the type of service and the application component that service is for. For example, if we wanted to fetch connection information for the Redis server that holds statistics, we’d fetch the key config:redis:statistics. The following listing shows the code for setting configurations.
Listing 5.14. The set_config() function
def set_config(conn, type, component, config):
    conn.set(
        'config:%s:%s'%(type, component),
        json.dumps(config))
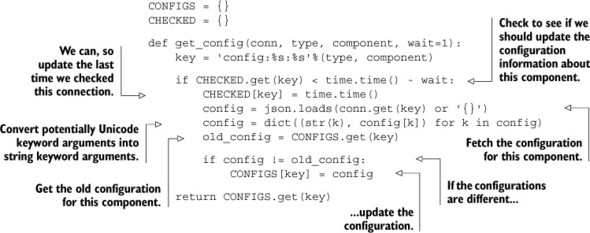
With this set_config() function, we can set any JSON-encodable configuration that we may want. With a slight change in semantics and a get_config() function structured similarly to our earlier is_under_maintenance() function, we could replace is_under_maintenance(). Consult the following listing for a function that matches set_config() and will allow us to locally cache configuration information for 1 second, 10 seconds, or 0 seconds, depending on our needs.
Listing 5.15. The get_config() function
Now that we have a pair of functions for getting and setting configurations, we can go farther. We started down this path of storing and fetching configurations in order to set up and create connections to a variety of different Redis servers. But the first argument to almost every function that we’ve written so far is a connection argument. Rather than needing to manually fetch connections for the variety of services that we’re using, let’s build a method to help us automatically connect to these services.
5.4.3. Automatic Redis connection management
Manually creating and passing connections to Redis can be tough. Not only do we need to repeatedly refer to configuration information, but if we’re using our configuration management functions from the last section, we still need to fetch the configuration, connect to Redis, and somehow deal with the connection when we’re done. To simplify the management of all of these connections, we’ll write a decorator that will take care of connecting to all of our Redis servers (except for the configuration server).
Decorators
Within Python there’s a syntax for passing a function X into another function Y. This function Y is called a decorator. Decorators are given an opportunity to alter the behavior of function X. Some decorators validate arguments, other decorators register callbacks, and even others manage connections like we intend to.
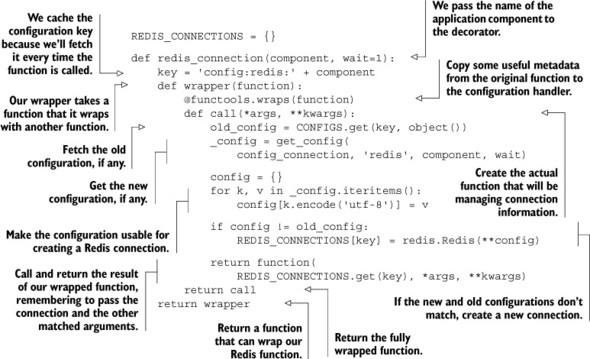
Our decorator will take a named configuration as an argument, which will generate a wrapper that, when called on the actual function, will wrap the function such that later calls will automatically connect to the appropriate Redis server, and that connection will be passed to the wrapped function with all of the other arguments that were later provided. The next listing has the source for our redis_connection() function.
Listing 5.16. The redis_connection() function/decorator
Combining *args and **kwargs
Way back in chapter 1, we first looked at default arguments in Python. But here, we’re combining two different forms of argument passing. If you’re having difficulty understanding what’s going on (which is essentially capturing all positional and named arguments in the args and kwargs variables in the function definition, and passing all positional and named parameters to the called function), then you should spend some time with the Python language tutorial via this shortened URL: http://mng.bz/KM5x.
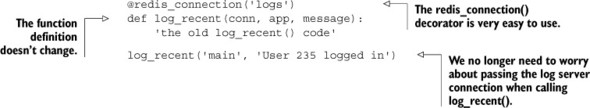
I know that this group of nested functions can be confusing at first, but it really isn’t that bad. We have a function, redis_connection(), that takes the named application component and returns a wrapper function. That wrapper function is then called with the function we want to pass a connection to (the wrapped function), which then returns the function caller. This caller handles all of the work of getting configuration information, connecting to Redis, and calling our wrapped function. Though it’s a mouthful to describe, actually using it is convenient, as you can see by applying it in the next listing to our log_recent() function from section 5.1.1.
Listing 5.17. The decorated log_recent() function
Decorators
In addition to the strange argument passing with *args and **kwargs from listing 5.16, we’re also using syntax to “decorate” the log function. That is to say, we pass a function to a decorator, which performs some manipulation on the function before returning the original function, or something else. You can read up on the details of what’s going on and why at http://www.python.org/dev/peps/pep-0318/.
Now that you’ve seen how to use the redis_connection() decorator on log_recent(), it doesn’t seem so bad, does it? With this better method of handling connections and configuration, we’ve just removed a handful of lines from almost every function that we’ll be calling. As an exercise, try to add this decorator to the access_time() context manager from section 5.2.3 so that we don’t need to pass a connection. Feel free to reuse this decorator with all of the other examples in the book.
5.5. Summary
All of the topics that we’ve covered in this chapter have directly or indirectly been written to support applications. These functions and decorators are meant to help you start using Redis as a way of supporting different parts of your application over time. Logging, counters, and statistics are there to offer direct insight into how your application is performing. IP-to-location lookup can tell you where your consumers are located. And storing service discovery and configuration can save a lot of effort because of not needing to manually handle connections.
Now that we have a solid foundation for supporting applications in Redis, chapter 6 will continue down this path to functions that can be used as building blocks of your application.