Summarizing Groups of Data
We can use PROC SQL steps to create detail reports.
But you might also want to summarize data in groups. To group data
for summarizing, you can use the GROUP BY clause. The GROUP BY clause
is used in queries that include one or more summary functions. Summary
functions produce a statistical summary for each group that is defined
in the GROUP BY clause.
Example
The following example
demonstrates the GROUP BY clause and summary functions.
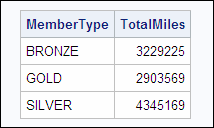
Suppose you want to
determine the total number of miles traveled by frequent-flyer program
members in each of three membership classes (Gold, Silver, and Bronze).
Frequent-flyer program information is stored in the table Sasuser.Frequentflyers.
To summarize your data, you can submit the following PROC SQL step:
proc sql;
   select membertype,
          sum(milestraveled) as TotalMiles
      from sasuser.frequentflyers
      group by membertype;
In this case, the SUM
function totals the values of the MilesTraveled column to create the
TotalMiles column. The GROUP BY clause groups the data by the values
of MemberType.
As in the ORDER BY clause,
in the GROUP BY clause that you specify the keywords GROUP BY, followed
by one or more column names separated by commas.
The results show total
miles by membership class (MemberType).
Note: If you specify a GROUP BY
clause in a query that does not contain a summary function, your clause
is changed to an ORDER BY clause, and a message to that effect is
written to the SAS log.
Summary Functions
To summarize data, you can use the following summary
functions with PROC SQL. Notice that some functions have more than
one name to accommodate both SAS and SQL conventions. Where multiple
names are listed, the first name is the SQL name.
|
AVG,MEAN
|
mean or average of values
|
|
COUNT, FREQ, N
|
number of nonmissing
values
|
|
CSS
|
corrected sum of squares
|
|
CV
|
coefficient of variation
(percent)
|
|
MAX
|
largest value
|
|
MIN
|
smallest value
|
|
NMISS
|
number of missing values
|
|
PRT
|
probability of a greater
absolute value of student's t
|
|
RANGE
|
range of values
|
|
STD
|
standard deviation
|
|
STDERR
|
standard error of the
mean
|
|
SUM
|
sum of values
|
|
T
|
student's t value
for testing the hypothesis that the population mean is zero
|
|
USS
|
uncorrected sum of squares
|
|
VAR
|
variance
|
..................Content has been hidden....................
You can't read the all page of ebook, please click here login for view all page.