
CONTENTS
Cable failure reporting in the US began by action of the Edison Electric Institute (EEI) and its predecessor the National Electric Light Association. A significant, early report covered the performance of paper-insulated, lead-covered cables (PILC), splices, and terminations beginning in 1923. Failure rates of cables were reported in units per 100 installed miles for a variety of causes. Splice and termination reports were based on failures per 1,000 units that were in service. These reports continued through 1966 and served both as a useful performance guide as well as a barometer of the effectiveness of the cable specifications in effect. The National Electric Light Association prepared the first U.S. paper cable specification in 1920 for cables rated up to 15 kV. The Association of Edison Illuminating Companies took over this responsibility and upgraded this to 45 kV in 1930 [1].
The advent of underground residential distribution (URD) systems with the extensive use of extruded dielectric cable convinced the U.S. utility group to become involved in specifications for this evolving type of cable. Later usage in conventional urban duct and manhole systems to take the place of the backbone paper-insulated cables finalized this requirement.
During the early 1970s, isolated reports of early cable failures on the extruded dielectric systems began to be documented in many parts of the world. “Treeing” was reintroduced to the cable engineer’s vocabulary, but with an entirely new meaning from the paper cable use of the word.
The EEI’s last attempt to report distribution cable failures was in 1973. A vacuum was therefore developed in the US for distribution cable failure reporting and no system for similar reporting exists in the world.
The data coming from a few U.S. utilities and work funded by the Electric Power Research Institute (EPRI) in 1975 [2] showed that thermoplastic polyethylene (PE) insulated cables were failing at a rapidly increasing rate and that cross-linked polyethylene (XLPE) and ethylene–propylene rubber (EPR) cables had a lower failure rate.
The next compilation of data began in 1976 with 16 and later 21 utilities in North America, reporting their failure rates on an annual basis for both polyethylene and XLPE insulated cables [3].
Failure data kept by the utilities was rather meager. It was decided to only request data based on the type of insulation, number of failures for each year, and the total amount of each of those insulation types in service at the end of the year. It was also decided to only ask for failures of known electrical causes, such as defective cable, insulation deterioration, lightning, etc., and then include all “unknown” causes since treeing analysis was not easily obtainable.
Comparable data from EEI for paper-insulated, medium voltage power cables installed in the US is included as Figure 21.1 for the years 1923 through 1966—when the data was no longer collected. Similar data showing the electrical failures of polyethylene and XLPE for 21 North American utilities is shown in Figure 21.2. The Association of Edison Illuminating Companies (AEIC) then began to collect and report similar data in 1984 except that data was requested from all utilities. A major future step was to request information on jackets, ducts, voltage stress levels, etc. The old 21-company base was not separately recorded, however. They also began to collect data for tree-retardant XLPE (TR-XLPE) as well as EPR (see Figures 21.3 through 21.6).
AEIC strongly suggests that this data be carefully analyzed and understood. This is important since the ages of the cables were not known and could skew the results. For instance, jacketed cable is probably newer than nonjacketed cable and hence the failure rate of the older cables may not be entirely the result of a jacket.

FIGURE 21.1 PILC cable failures in the US.
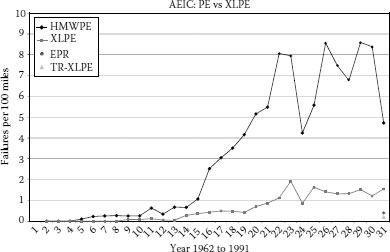
FIGURE 21.2 Electrical failures of extruded dielectric cables in North America.
The European community also began to collect data and their results were published as UNIPEDE-DISCAB that represents most of the European countries. Their data includes polyethylene, XLPE, EPR, and polyvinyl chloride (PVC).
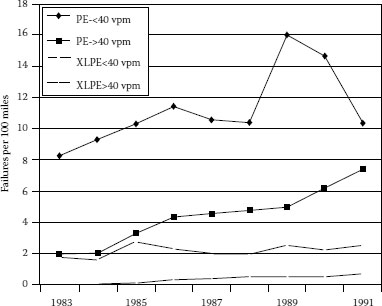
FIGURE 21.3 AEIC cable failure data, high and low electrical stress.
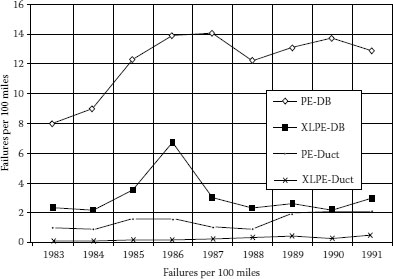
FIGURE 21.4 AEIC cable failure data, duct versus direct buried.
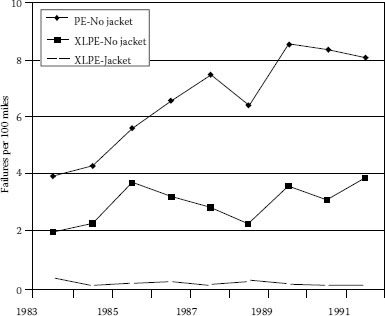
FIGURE 21.5 AEIC cable failure data, jacket versus nonjacket construction.

FIGURE 21.6 Cable failure data, seasonal pattern.
Cable failure rates in the US have historically been calculated on the basis of failures per 100 miles of installed cable. The rest of the world reports failures per 100 kilometers. All data is shown as rates per 100 miles for ease of comparison.
The most frequently used form of the data shows the number of failures per 100 miles for each year. The disadvantage of such a depiction is that older cable is looked at in the same light as the new one. This data is more readily available, but a preferred method is to take into account the years in service for all cables. This is accomplished by integrating the miles installed with the years of service. The expression is:
(21.1) |
where
A = system age in year j in terms of service mile-years
Mi = the number of miles of cable installed in year i
Nj−i = the number of years from i to j.
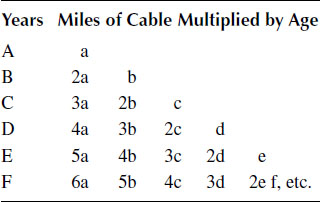
At the end of year F, the age of the system is:
(21.2) |
where a, b, and c represent the number of miles of cable installed in A, B, and C, respectively.
This analysis can be shown as a summation of failures per 1,000 mile-years.

It is only necessary to add the miles of cable installed each year to the summation of cable installed in all previous years to obtain updated mile—years from this equation.
There is no new data to report regarding cable failure statistics. This is the result of two factors:
• New cable performance is very good. The few problems with the new cable makes collecting data seem unnecessary.
• There are not enough people to do the essential work.
The last North American performance data was collected in 1991 by AEIC. The data shows an extremely low failure rate for TR-XLPE and EPR. The XLPE rate has not escalated to a troublesome level. The European collection of data has also been discontinued.
This is certainly an indication of the effort that has been directed toward improved cables—from both the material suppliers’ standpoint as well as the cable manufacturers.
1. Thue, W. A., October, 2001 adapted from class notes, “Power Cable Engineering Clinic,” University of Wisconsin–Madison.
2. EPRI RP 133: “Electrochemical Treeing in Solid Dielectric Cable,” 1 EPRI Report EL-647, 1976.
3. Thue, W. A. and Bankoske, J., 1980, “Operating and Testing Experience on Solid Dielectric Cables,” CIGRE.