13. Unsteady-State Nonisothermal Reactor Design
Chemical engineers are not gentle people, they like high temperatures and high pressures.
—Steve LeBlanc
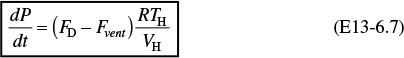
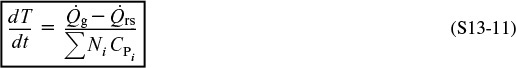
Overview. Up to now we have focused on the steady-state operation of nonisothermal reactors. In this chapter the unsteady-state energy balance will be developed and then applied to CSTRs, as well as well-mixed batch and semibatch reactors. We will use the difference between the rate of “heat generated,” ![]() , and the rate of “heat removed,”
, and the rate of “heat removed,” ![]() , to arrive at the user-friendly form of the energy balance
, to arrive at the user-friendly form of the energy balance

• Section 13.1 shows how to arrange the general energy balance (Equation (11-9)) in a more simplified form for unsteady-state operation.
• Section 13.2 discusses the application of the energy balance to the operation of batch reactors and discusses reactor safety and the reasons for the explosion of an industrial batch reactor.
• Section 13.3 shows how to apply the energy balance to a semibatch reactor with a variable ambient temperature.
• Section 13.4 discusses the startup of a CSTR and how to avoid exceeding the practical stability limit.
• Section 13.5 closes the chapter with a case study of the T2 Laboratory explosion involving multiple reactions in a batch reactor.
Safety is another focus of this chapter, and the example problems and home problems were chosen to emphasize the hazards of runaway reactors.
13.1 The Unsteady-State Energy Balance
We start by deriving the user-friendly form of the energy balance that can be easily used in making reactor calculations. As I have stated before, the reason I derive the equations rather than just giving the final result is (1) the reader can see what assumptions are used at what points along the way in the derivation to the user-friendly energy balance, and (2) it is my experience that if the reader goes line-by-line through the derivation, he/she will be less likely to insert the incorrect numbers into symbols in the equation.
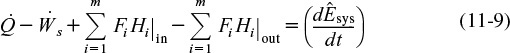
We begin by recalling the unsteady-state form of the energy balance developed in Chapter 11.
We shall first concentrate on evaluating the change in the total energy of the system wrt time, ![]() . The total energy of the system is the sum of the products of specific energies, Ei (e.g., J/mol i), of the various species in the system volume and the number of moles, Ni (mol i), of that species
. The total energy of the system is the sum of the products of specific energies, Ei (e.g., J/mol i), of the various species in the system volume and the number of moles, Ni (mol i), of that species

In evaluating ![]() , we shall neglect changes in the potential and kinetic energies and substitute for the internal energy Ui in terms of the enthalpy Hi
, we shall neglect changes in the potential and kinetic energies and substitute for the internal energy Ui in terms of the enthalpy Hi

We note the last term on the right-hand side of Equation (13-2) is just the total pressure times the total volume, i.e., PV, and this term is virtually always smaller than the other terms in Equation (13-2), and thus will be neglected.† For brevity, we shall write all summations as
† Marat Orazov while a student at University of California, Berkeley, pointed out that the last term in Equation (13-2) need not be neglected for the special case of an ideal gas with a constant total number of moles. The denominator on the r.h.s. of Equation (13-9) in this case is just ∑ Ni(CPi – R).

unless otherwise stated.
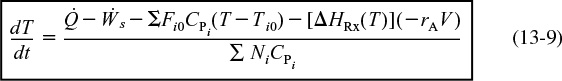
When no spatial variations are present in the system volume, and time variations in the product of the total pressure and volume (PV) are neglected, the energy balance, after substitution of Equation (13-2) into (11-9), gives
Recalling Equation (11-19)
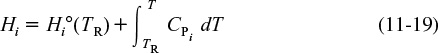
and differentiating with respect to time, we obtain
Then, substituting Equation (13-4) into (13-3) gives
The mole balance on species i is
Using Equation (13-6) to substitute for dNi/dt, Equation (13-5) becomes

Rearranging, and recalling ∑υiHi = ΔHRX, we have
This form of the energy balance should be used when there is a phase change.
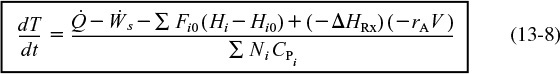
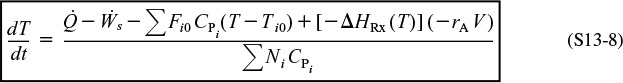
Substituting for Hi and Hi0 for the case of no phase change gives us
Energy balance on a transient CSTR or semibatch reactor
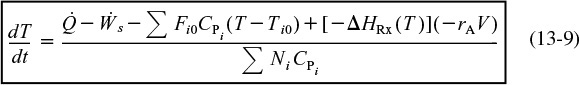
Equation (13-9) applies to a semibatch reactor, as well as to the unsteady-state operation of a CSTR, and is also shown in Table 11-1 as Equation (T11-1.I).
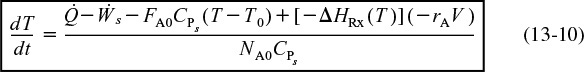
For liquid-phase reactions where ΔCP is usually small and can be neglected, the following approximation is often made

where CPs is the heat capacity of the solution. The units of the batch term (NA0 CPs) are (cal/K) or (J/K) or (Btu/°R), and for the flow term
∑ Fi0CPi = FA0CPs
the units are (J/s · K) or (cal/s · K) or (Btu/h · °R).1 With this approximation and assuming that every species enters the reactor at temperature T0, we have
1 If the heat capacities were given in terms of mass (i.e., CPsm J/g·K), then both FA0 and NA0 would have to be converted to mass

However, we note that the units of the product of mass flow rate and mass heat capacities would still be the same as the product of molar flow and molar heat capacities (e.g., cal/s · K), respectively.
13.2 Energy Balance on Batch Reactors (BRs)
A batch reactor is usually well mixed, so that we may neglect spatial variations in the temperature and species concentrations.
The energy balance on batch reactors is found by setting the inlet flows to zero, i.e., Fi0 = 0, in Equation (13-9)
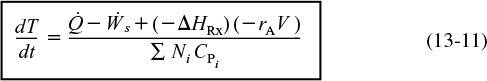
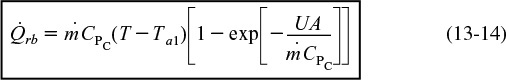
Next we use the heat-exchanger energy balance to obtain ![]() , Equation (12-19), and realize that the heat “added” to the batch reactor,
, Equation (12-19), and realize that the heat “added” to the batch reactor, ![]() , is just minus the heat “removed” from the batch reactor,
, is just minus the heat “removed” from the batch reactor, ![]() , i.e.,
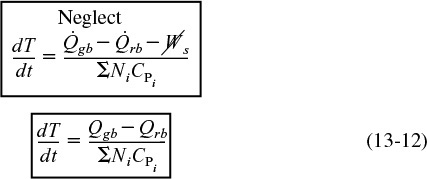
, i.e., ![]() . Neglecting shaft work (we can’t do this in Problem P12-6B) we get
. Neglecting shaft work (we can’t do this in Problem P12-6B) we get
where the terms for heat generated, ![]() , and heat removed,
, and heat removed, ![]() , for a batch system are
, for a batch system are
with an added bonus

Reminder: The sign convention
Heat Added
![]() = +10J/s
= +10J/s
Heat Removed
![]() = –10J/s
= –10J/s
Work Done by System
![]()
Work Done on System
![]()
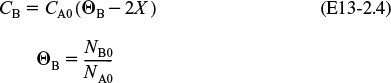
Equation (13-12) is the preferred form of the energy balance when the number of moles, Ni, is used in the mole balance, rather than the conversion, X. The number of moles of species i at any X is
Ni = NA0(Θi + viX)
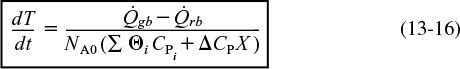
Consequently, in terms of conversion, the user-friendly form of the energy balance becomes
Batch reactor energy balance
Equation (13-12) must be coupled with the mole balance
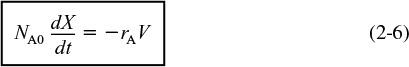
Batch reactor mole balance
13.2.1 Adiabatic Operation of a Batch Reactor
Batch reactors operated adiabatically are often used to determine the reaction orders, activation energies, and specific reaction rates of exothermic reactions by monitoring the temperature–time trajectories for different initial conditions. In the steps that follow, we will derive the temperature–conversion relationship for adiabatic operation.
For adiabatic operation (![]() = 0) of a batch reactor (Fi0 = 0) and when the work done by the stirrer can be neglected (
= 0) of a batch reactor (Fi0 = 0) and when the work done by the stirrer can be neglected (![]() ), Equation (13-10) can be written as
), Equation (13-10) can be written as

It is shown in the Summary Notes on the CRE Web site (www.umich.edu/~elements/5e/index.html) that if we combine Equation (13-17) with Equation (2-6), we can do a lot of rearranging and integrating to arrive at the following user-friendly equation for an adiabatic batch reactor


Temperature conversion relationship for any reactor operated adiabatically
We note that for adiabatic conditions, the relationship between temperature and conversion is the same for BRs, CSTRs, PBRs, and PFRs. Once we have T as a function of X for a batch reactor, we can construct a table similar to Table E11-3.1 and use techniques analogous to those discussed in Section 11.3.2 to evaluate the following design equation that determines the time necessary to achieve a specified conversion.
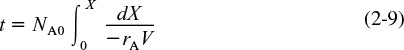
Time on your hands.

However, if you do not have that much time on your hands to form a table and use Chapter 2 integration techniques, then use Polymath or MATLAB to solve the coupled differential forms of mole balance equation (2-6) and the energy balance equation (13-19) simultaneously.
Example 13–1 Adiabatic Batch Reactor
It is still winter, and although you were hoping for a transfer to the plant in the tropical southern coast of Jofostan, unfortunately you are still the engineer of the CSTR from Example 12-3, in charge of the production of propylene glycol.

You are considering the installation of a new, attractive-looking, glass-lined 1,000-dm3 CSTR, and you decide to make a quick check of the reaction kinetics and maximum adiabatic temperature. You have a stylish, nicely decorated and instrumented 40-dm3 (~10 gal) stirred batch reactor you ordered from a company in Jofostan. You charge this reactor with 4 dm3 (~1 gal) of ethylene oxide, 4 dm3 (~1 gal) of methanol, and 10 dm3 (~2.5 gal) of water containing 0.1 wt % H2SO4. For safety reasons, the reactor is located on a boating pier on the banks of Lake Wobegon (you don’t want the entire plant to be destroyed if the reactor explodes). At this time of year in northern Minnesota, the initial temperature of all materials is 276 K (3˚C). We have to be careful here! If the reactor temperature increases above 350 K (77˚C), a secondary, more exothermic reaction will take over, causing runaway and subsequent explosion, similar to what happened in the T-2 Laboratory plant explosion in Florida, see page 660.
Although you requested obtaining the data for this reaction from the Jofostan national laboratory, the purchasing department decided to save money and buy it off the Internet. The values it purchased are
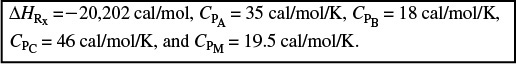
The concentration of pure ethylene oxide and methanol are 13.7 mol/dm3 and 24.7 mol/dm3 respectively. Consequently, the initial number of moles added to the reactor are
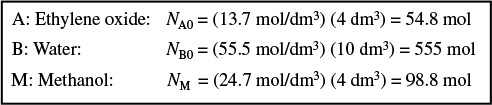
The sulfuric acid catalyst takes up negligible space, so the total volume is 18 dm3. Use the data and the reaction-rate law given in Example 12-3. We are going to carry out two scenarios: (1) to learn how fast the temperature rises and how long it takes to reach 350 K for adiabatic operation, and (2) how long would it take to reach 345 K if we added a heat exchanger.
(a) Plot conversion and temperature X and T as a function of time for adiabatic operation. How many minutes should it take the mixture inside the reactor to reach a conversion of 51.5%? What is the corresponding adiabatic temperature?
(b) Plot the temperature and conversion when the heat exchange is added. The product of the overall heat-transfer coefficient and area is UA = 10 cal/s/K with Ta1 = 290 K and the coolant rate is 10 g/s, and it has a heat capacity of 4.16 cal/g/K.
Solution
The initial temperature is 3˚C, and if the reactor temperature increases to above 77˚C, a dangerous exothermic side reaction can occur, as was reported in Jofostan Journal of Chemical Safety, Vol. 19, p. 201 (1988).
As before, there is approximately a 10˚C (17˚F) rise in temperature immediately after mixing. The activation energy is 32,400 cal/gmol • K.
1. Mole Balance, Chapter 2, rearranging Equation (2-6) we have
2. Rate Law:
3. Stoichiometry:
Recall that for liquid batch V = V0

4. Combining Equations (E13-1.1), (E13-1.2), and (2-6), we have
Changing the data in Example 12-3 from English units to mks units, we have
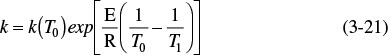
Choosing 297 K as a reference temperature for k1, and putting Equation (E13-1.5) in the form of Equation (3-21), we get

5. Energy Balance.
Part (a) Adiabatic Operation.
Using Equation (13-19), the relationship between X and T for an adiabatic reaction is given by
6. Parameters:
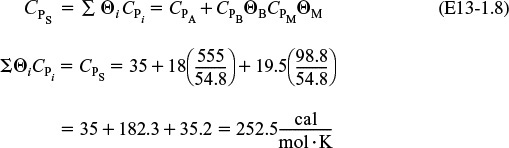
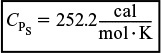
The lumped heat capacity of the solution is
In the expression for the heat of reaction, we are going to neglect the second term on the right-hand side, i.e.,
We can do this because ΔCP is –7 cal/mol/K and for a 50-K temperature difference, ΔCP (T–TR) = 350 cal/mol, which is negligible with respect to the heat of reaction of –20,202 or cal/mol
In calculating the inlet temperature after mixing, T0, we must include the temperature rise 10˚C (17˚F) resulting from the heat of mixing the two solutions initially at 3˚C
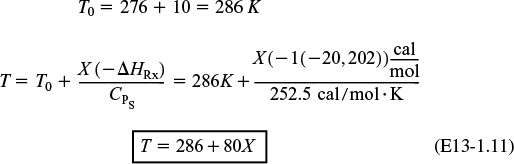
Adiabatic Energy Balance
A summary of the heat and mole balance equations is given in Table E13-1.1.
where T is in K and t is in seconds.
A table similar to that used in Example 11-3 can now be constructed or one can make better use of his or her time using Polymath.
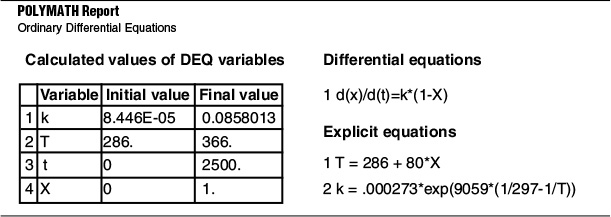
TABLE E13-1.1 SUMMARY FOR FIRST-ORDER ADIABATIC BATCH REACTION
The software package Polymath will be used to combine Equations (E13-1.4), (E13-1.6), and (E13-1.11) to determine conversion and temperature as a function of time. Table E13-1.2 shows the program, and Figures E13-1.1 and E13-1.2 show the solution results.
Adiabatic Batch Operation


Part (b) Heat Exchanger in a Batch Reactor.
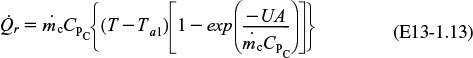
We now consider the case where a heat exchanger is added to the batch reactor. The coolant enters at 290 K and the flow rate, ![]() , through the exchanger is 10 g/s. The mole balance, Equation (E13-1.1), and the physical properties, Equations (E13-1.2) through (E13-1.6) and (E13-1.8), remain the same.
, through the exchanger is 10 g/s. The mole balance, Equation (E13-1.1), and the physical properties, Equations (E13-1.2) through (E13-1.6) and (E13-1.8), remain the same.
Mole Balance
Neglecting ΔCP the energy balance is
Energy Balance
with
The Polymath Program is shown in Table E13-1.3 with parameters
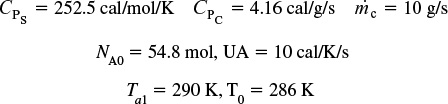
and the other terms remain the same as in Part (a).

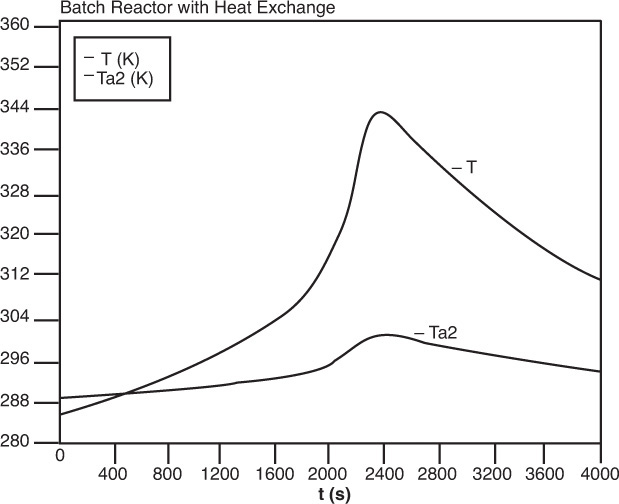
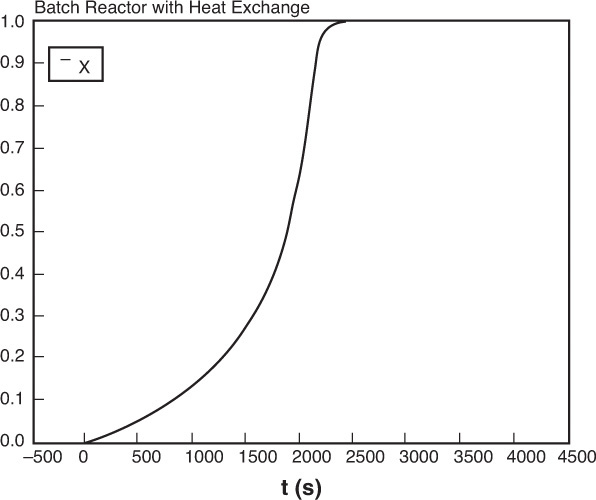
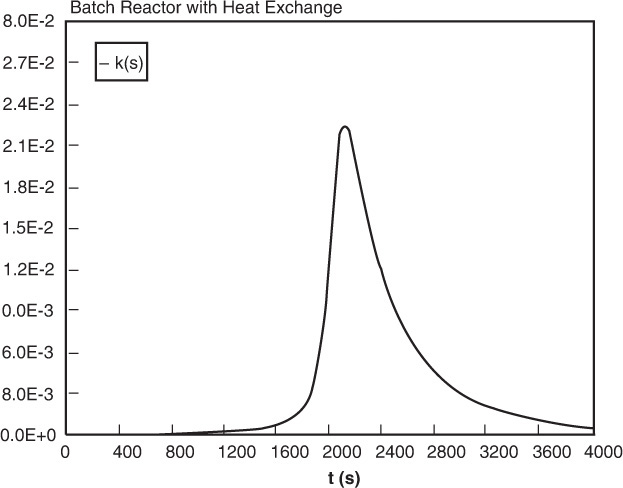
One notes from Figure E13-1.3(a) and (b) that the temperature profiles are not as steep as the adiabatic case. The specific reactor-rate constant, Figure E13-1.5, goes through a maximum as the fluid becomes heated at first then later cools. Figure E13-1.6 shows the trajectories of the “heat generated,” Qg, and “heat removed,” Qr. Whenever Qg > Qr
the temperature will increase when Qg > Qr and the temperature will decrease when Qr > Qg.
Analysis:
(a) Adiabatic. The initial temperature is rather low, so the reaction is slow at first. However, as the exothermic reaction proceeds, it heats up and becomes virtually autocatalytic as it goes from a small conversion at 1600 seconds to complete conversion just a few seconds later. The conversion reaches X = 1.0 and the temperature reaches its maximum value, where it remains.
(b) Heat Exchange. Because the temperature is maintained at a lower value in the heat exchange case than in the adiabatic case, there will be less conversion for the parameter values Ua, Tai, T0, ![]() , etc., given in the problem statement. However, if you change these values as suggested in Problem P13-1A (a), you will find situations where the conversion remains very low and cases where the temperature curve is extremely steep.
, etc., given in the problem statement. However, if you change these values as suggested in Problem P13-1A (a), you will find situations where the conversion remains very low and cases where the temperature curve is extremely steep.
13.2.2 Case History of a Batch Reactor with Interrupted Isothermal Operation Causing a Runaway Reaction
In Chapters 5 and 6 we discussed the design of reactors operating isothermally. This operation can be achieved by efficient control of a heat exchanger. The following example shows what can happen when the heat exchanger suddenly fails.
Example 13–2 Safety in Chemical Plants with Exothermic Runaway Reactions2
2 Adapted from the problem by Ronald Willey, Seminar on a Nitroaniline Reactor Rupture. Prepared for SAChE, Center for Chemical Process Safety, American Institute of Chemical Engineers, New York (1994). Also see Process Safety Progress, vol. 20, no. 2 (2001), pp. 123–129. The values of ΔHRx and UA were estimated from the plant data of the temperature–time trajectory in the article by G. C. Vincent, Loss Prevention, 5, 46–52.
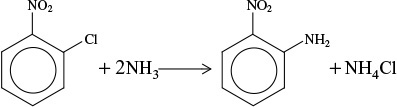
A serious accident occurred at the Monsanto plant in Sauget, Illinois, on August 8 at 12:18 A.M. (see Figure E13-2.1). (Sauget (pop. 200) is the home of the 1988 Mon-Clar League Softball Champions.) The blast was heard as far as 10 miles away in Belleville, Illinois, where people were awakened from their sleep. The explosion occurred in a batch reactor that was used to produce nitroaniline from ammonia and o-nitrochlorobenzene (ONCB):
This reaction is normally carried out isothermally at 175°C and about 500 psi. The ambient temperature of the cooling water in the heat exchanger is 25°C. By adjusting the coolant rate, the reactor temperature could be maintained at 175°C. At the maximum coolant rate, the ambient temperature is 25°C throughout the heat exchanger.
Let me tell you something about the operation of this reactor. Over the years, the heat exchanger would fail from time to time, but the technicians would be “Johnny on the Spot” and run out and get it up and running within 10 minutes or so, and there was never any problem. It is believed that one day someone in management looked at the reactor and said, “It looks as if your reactor is only a third full and you still have room to add more reactants and to make more product and more money. How about filling it up to the top so we could triple production?” They did, and started the reactor up at 9:45 p.m. Around midnight the reactor exploded and the aftermath is shown in Figure E13-2.1.
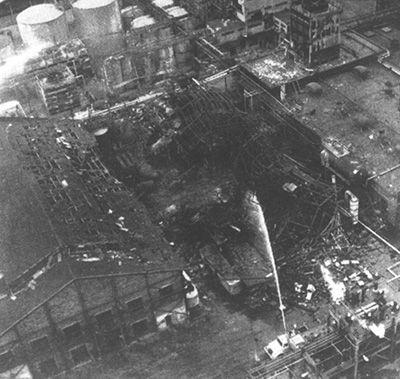
Figure E13-2.1 Aftermath of the explosion. (St. Louis Globe/Democrat photo by Roy Cook. Courtesy of St. Louis Mercantile Library.)
A decision was made to triple production.

On the day of the accident, two changes in normal operation occurred.
1. The reactor was charged with 9.044 kmol of ONCB, 33.0 kmol of NH3, and 103.7 kmol of H2O. Normally, the reactor is charged with 3.17 kmol of ONCB, 103.6 kmol of H2O, and 43 kmol of NH3.
2. The reaction is normally carried out isothermally at 175°C over a 24-h period. However, approximately 45 min after the reaction was started, cooling to the reactor failed, but only for 10 min, and cooling was again up and running at the 55-minute mark. Cooling may have been halted for 10 min or so on previous occasions when the normal charge of 3.17 kmol of ONCB was used and no ill effects occurred.
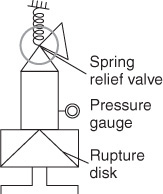
The reactor had a rupture disk designed to burst when the pressure exceeded approximately 700 psi. If the disk would have ruptured, the pressure in the reactor would have dropped, causing the water to vaporize, and the reaction would have been cooled (quenched) by the latent heat of vaporization.
(a) Plot and analyze the temperature–time trajectory up to a period of 120 min after the reactants were mixed and brought up to 175°C (448K).
(b) Show that all of the following three conditions had to have been present for the explosion to occur: (1) increased ONCB charge, (2) cooling stopped for 10 min at a time early in the reaction, and (3) relief-system failure.
Additional information:
Rate law: –rONCB = kCONCBCNH3
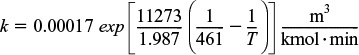
with ![]() and E = 11,273 cal/mol
and E = 11,273 cal/mol
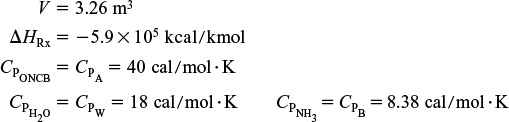
The reaction volume for the new charge of 9.0448 kmol of ONCB
V = 3.265 m3 ONCB/NH3 + 1.854 m3 H2O = 5.119 m3
Case History
The reaction volume for the previous charge of 3.17 kmol of ONCB:
Assume that ΔCP ≈ 0
Solution
Mole Balance:
Rate Law:
with
Combine:
Substituting our parameter values into Equation (3-21)
We obtain
Energy Balance:
For ΔCP = 0,
∑ Ni CPi = NCP = NA0 CPA + NB0CPB + NWCPW
Parameter evaluation for day of explosion:
NCP = (9.0448)(40) + (103.7)(18) + (33)(8.38)
NCP = 2504 kcal/K
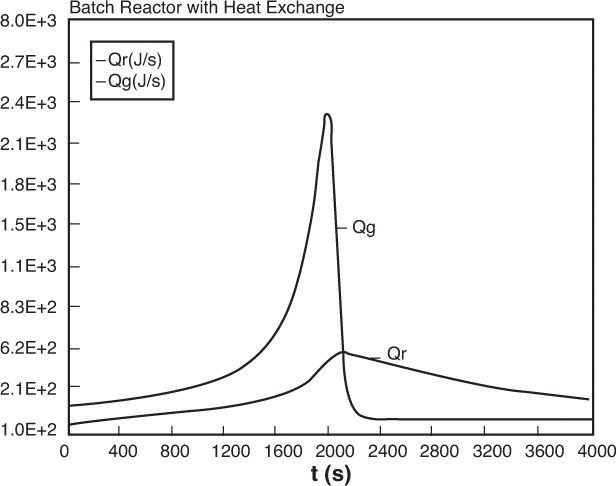
Again, let Qg be the heat generated, i.e., Qg = (rAV)(ΔHRx), and let Qr be the heat removed, i.e., Qr = UA (T – Ta).
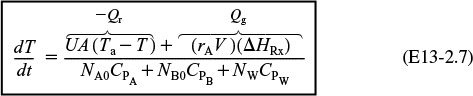
Qg = (rAV)(ΔHRx)
Qr = UA (T – Ta)
A. Isothermal Operation Up to 45 Minutes
We will first carry out the reaction isothermally at 175°C (448 K) up to the time the cooling was turned off at 45 min. Combining and canceling yields
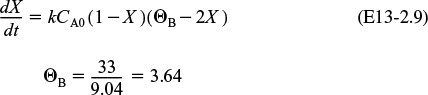
Integrating Equation (E13-2.9) gives us

At 175°C = 448 K, k = 0.0001167m3/kmol · min.
Substituting for k and the other parameter values

The calculation and results can also be obtained from the Polymath output
Solving for X, we find that at t = 45 min, then X = 0.033.
We will calculate the rate of generation, Qg, at this temperature and conversion and compare it with the maximum rate of heat removal, Qr, that is available for a constant coolant temperature of Ta = 298 K. The rate of generation, Qg, is

At this time (i.e., t = 45 min, X = 0.033, T = 175°C), we calculate k, then Qr and Qg . At 175°C, k = 0.0001167 m3/min · kmol.

The corresponding maximum cooling rate is
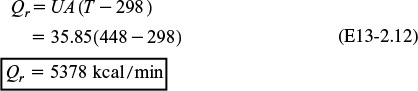
Therefore
Everything is OK.
The reaction can be controlled. There would have been no explosion had the cooling not failed.
B. Adiabatic Operation for 10 Minutes
Unexpectedly, the cooling failed from 45 to 55 min after the reaction was started. We will now use the conditions at the end of the period of isothermal operation as our initial conditions for the adiabatic operation period between 45 and 55 min
t = 45 min X = 0.033 T = 448 K
Interruptions in the cooling system have happened before with no ill effects.
Between t = 45 and t = 55 min, Qr = 0. The Polymath program was modified to account for the time of adiabatic operation by using an “if statement” for Qr in the program, i.e., Qr = if (t > 45 and t < 55) then (0) else (UA (T – 298)). A similar “if statement” is used for isothermal operation, i.e., (dT/dt) = 0.
For the 45- to 55-min period without cooling, the temperature rose from 448 K to 468 K, and the conversion increased from 0.033 to 0.0424. Using this temperature and conversion in Equation (E13-2.11), we calculate the rate of generation Qg at 55 min and see that it has increased to
Qg = 6591 kcal/min
The maximum rate of cooling at this reactor temperature is found from Equation (E13-2.12) to be
Qr = 6093 kcal/min
Here, we see that at the end of the 10-minute down time, the heat exchange system is now operating again, but now
The point of no return
and the temperature will continue to increase. We have a Runaway Reaction!! The point of no return has been passed and the temperature will continue to increase, as will the rate of reaction until the explosion occurs.
C. Batch Operation with Heat Exchange
Return of the cooling occurs at 55 min after startup. The values at the end of the period of adiabatic operation (T = 468 K, X = 0.0423) become the initial conditions for the period of restored operation with the heat exchange. The cooling is turned on at its maximum capacity, Qr = UA (T – 298), at 55 min. Table E13-2.1 gives the Polymath program to determine the temperature–time trajectory. (Note that one can change NA0 and NB0 to 3.17 and 43 kmol in the program and show that, if the cooling is shut off for 10 min, at the end of that 10 min, Qr will still be greater than Qg and no explosion will occur.)
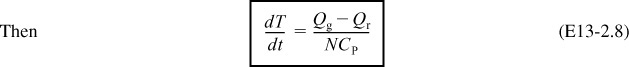
The complete temperature–time trajectory is shown in Figure E13-2.2. One notes the long plateau after the cooling is turned back on. Using the values of Qg and Qr at 55 min and substituting into Equation (E13-2.8), we find that


The explosion occurred shortly after midnight.
Consequently, even though dT/dt is positive, the temperature increases very slowly at first, 0.2°C/min. By 11:45, the temperature has reached 240°C and both the “heat generated” and the temperature begin to increase more rapidly. This rapid increase is a result of the Arrhenius temperature dependence, which caused the temperature to increase exponentially. The reaction is running away! One observes in Figure E13-2.2 that 119 min after the batch was started, the temperature increases sharply and the reactor explodes at approximately midnight. If the mass and heat capacity of the stirrer and reaction vessel had been included, the NCp term would have increased by about 5% and extended the time until the explosion occurred by 15 or so minutes, which would predict the actual time the explosion occurred, at 12:18 A.M.
When the temperature reached 300°C, a secondary reaction, the decomposition of nitroaniline to noncondensable gases such as CO, N2, and NO2, occurred, releasing even more energy. The total energy released was estimated to be 6.8 × 10⁹ J, which is enough energy to lift the entire 2500-ton building 300 m (the length of three football fields) straight up.
D. Safety Disk Rupture Failure
We note that the pressure-safety-relief disk should have ruptured when the temperature reached 265°C (ca. 700 psi) but did not and the temperature continued to rise. If it had ruptured and all the water had vaporized, 106 kcal would have been drawn from the reacting solution, thereby lowering its temperature and quenching the runaway reaction.
If the disk had ruptured at 265°C (700 psi), we know from fluid mechanics that the maximum mass flow rate, ![]() , out of the 2-in. orifice to the atmosphere (1 atm) would have been 830 kg/min at the time of rupture. The corresponding heat removed would have been
, out of the 2-in. orifice to the atmosphere (1 atm) would have been 830 kg/min at the time of rupture. The corresponding heat removed would have been
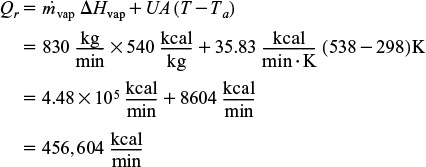
This value of Qr is much greater than the “heat generated” Qg (Qg = 27,460 kcal/min), so that the reaction could have been easily quenched.
Analysis: Runaway reactions are the most deadly in the chemical industry. Elaborate safety measures are usually installed to prevent them from occurring. However, as we show in this example, the back-up plan failed. If any one of the following three things had not occurred, the explosion would not have happened.
1. Tripled production
2. Heat-exchanger failure for 10 minutes early in the operation
3. Failure of the relieving device (rupture disk)

In other words, all the above had to happen to cause the explosion. If the relief valve had operated properly, it would not have prevented reaction runaway but it could have prevented the explosion. In addition to using rupture disks as relieving devices, one can also use pressure relief valves. In many cases, sufficient care is not taken to obtain data for the reaction at hand and to use it to properly size the relief device. This data can be obtained using a specially designed batch reactor called the Advanced Reactor Safety Screening Tool (ARSST), as shown in Chapter 13, PRS R13.1.
13.3 Semibatch Reactors with a Heat Exchanger
In our past discussions of reactors with heat exchangers, we assumed that the ambient temperature Ta was spatially uniform throughout the exchangers. This assumption is true if the system is a tubular reactor with the external pipe surface exposed to the atmosphere, or if the system is a CSTR or batch where the coolant flow rate through the exchanger is so rapid that the coolant temperatures entering and leaving the exchanger are virtually the same.
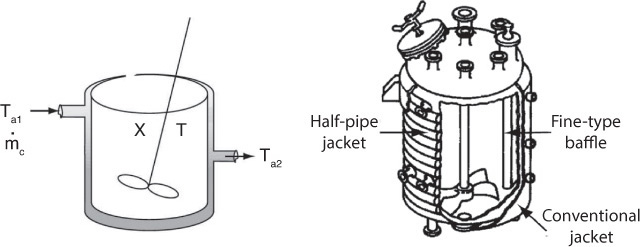
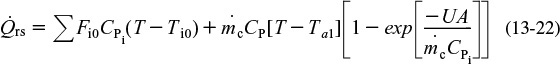
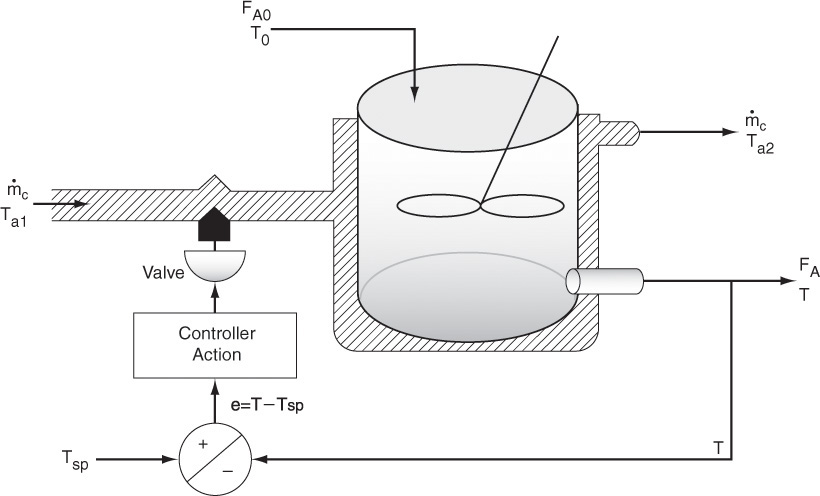
We now consider the case where the coolant temperature varies along the length of the exchanger while the temperature in the reactor is spatially uniform. The coolant enters the exchanger at a mass flow rate, ![]() , at a temperature, Ta1, and leaves at a temperature, Ta2 (see Figure 13-1). As a first approximation, we assume a quasi-steady state for the coolant flow and neglect the accumulation term (i.e., dTa/dt = 0). As a result, Equation (12-19) will give the rate of heat transfer from the exchanger to the reactor
, at a temperature, Ta1, and leaves at a temperature, Ta2 (see Figure 13-1). As a first approximation, we assume a quasi-steady state for the coolant flow and neglect the accumulation term (i.e., dTa/dt = 0). As a result, Equation (12-19) will give the rate of heat transfer from the exchanger to the reactor
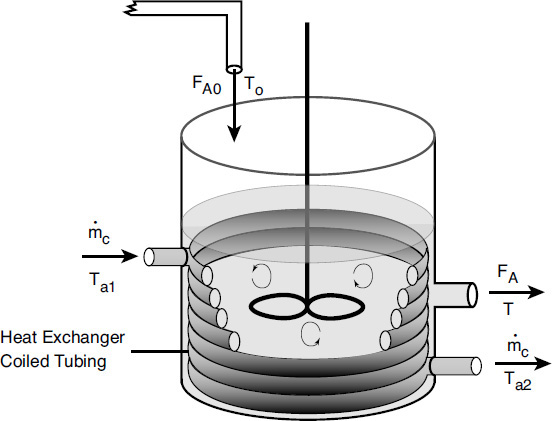
The energy balance on a semibatch reactor is
Using a slight rearrangement of the heat exchanger energy balance equation, i.e., Equation (12-9) and neglecting shaft work, ![]()

where the “heat generated,” ![]() , for a the semibatch reactor is the same as that for a BR,
, for a the semibatch reactor is the same as that for a BR,
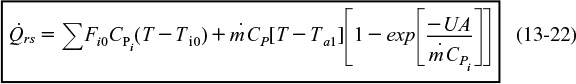
however, the “heat removed” for a semibatch reactor, ![]() , is
, is
Note: The subscript “s” in ![]() and
and ![]() means these equations only apply to semibatch reactor.
means these equations only apply to semibatch reactor.
For large coolant flow rates, Equation (13-22) reduces to
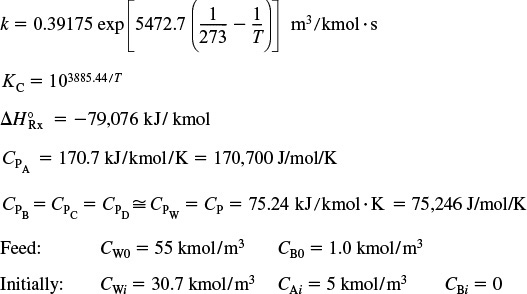
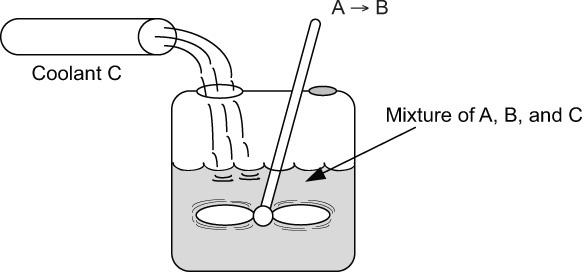
Example 13–3 Heat Effects in a Semibatch Reactor
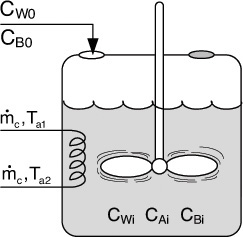
The second-order saponification of ethyl acetate is to be carried out in a semibatch reactor shown schematically below in Figure E13-3.1.

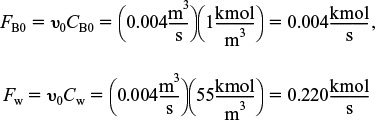
Aqueous sodium hydroxide is to be fed at a concentration of 1 kmol/m3, a temperature of 300 K, and a volumetric rate of 0.004 m3/s to an initial volume of 0.2 m3 of water and ethyl acetate. The concentration of water in the feed, CW0, is 55 kmol/m3. The initial concentrations of ethyl acetate and water in the reactor are 5 kmol/m3 and 30.7 kmol/m3, respectively. The reaction is exothermic and it is necessary to add a heat exchanger to keep its temperature below 315 K. A heat exchanger with UA = 3000 J/s · K is available for use. The coolant enters at a mass flow rate of 100 kg/s and a temperature of 285 K.
Are the heat exchanger and coolant flow rate adequate to keep the reactor temperature below 315 K? Plot the reactor temperature, T, and the concentrations, CA, CB, and CC as a function of time.
Additional information:3
3 Value for k from J. M. Smith, Chemical Engineering Kinetics, 3rd ed. (New York: McGraw-Hill, 1981), p. 205. Note that ΔHRx and KC were calculated from values given in Perry’s Chemical Engineers’ Handbook, 6th ed. (New York: McGraw-Hill, 1984), pp. 3–147.
Solution
1. Mole Balances: (See Chapter 6.)

NWi = ViCW0 = (0.2 m3) (30.7 kmol/m3) = 6.14 kmol
2. Rate Law:

3. Stoichiometry:
4. Energy Balance:
The user-friendly energy balance is

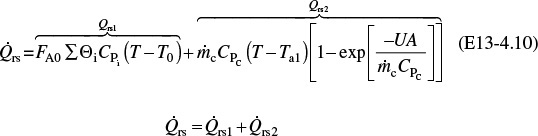
Only species B (NaOH) and water flow into the reactor, so Equation (13-22) becomes

Qrs1 is the heat removed by mass flow, and Qrs2 is the heat removed through heat exchange.
In Jofostan we have the added bonus that we can ask Prof. Dr. Sven Köttlov to calculate the temperature of the heat exchange fluid at its exit

5. Evaluation of Parameters:
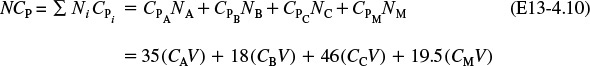
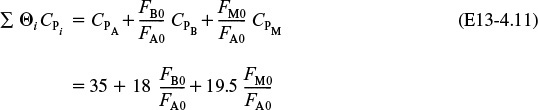
CPA = 170,700 J/kmol/K, CP = 75,246 J/kmol/K
We note the heat capacities for B, C, and water are essentially the same at CP
NCP = CPANA + CP (NB + NC + ND + NW)
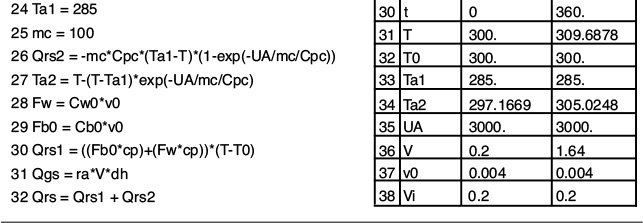
The Polymath program is given in Table E13-3.1. The solution results are shown in Figures E13-3.2 and E13-3.3.

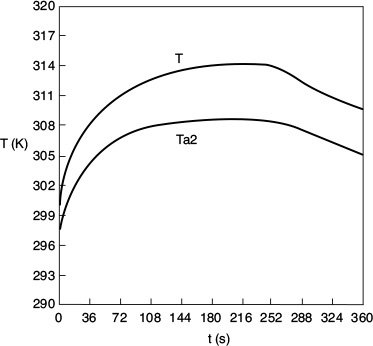
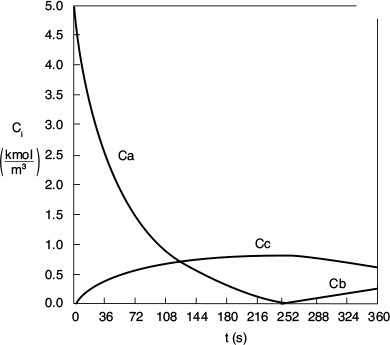
Analysis: From Figure E13-3.3 we see that the concentration of species B is virtually zero, owing to the fact that it is consumed virtually as fast as it enters the reactor up to a time of 252s. By the time we reach 252s, all species A has been consumed, and the reaction rate is virtually zero and no more of species C or D is produced and no more B is consumed. Because species B continues to enter the reactor at a volumetric flow rate υ0, after 252 seconds, the fluid volume continues to increase and the concentrations of C and D are diluted. The figure shows that before 252 s, Qg > Qr, and the reactor temperature and the coolant temperature increase. However, after 252 s, the reaction rate, and hence Qg, are virtually zero so that Qr > Qg and the temperature decreases. Because of the impractical short reaction time (252 seconds), a semibatch reactor would never be used for this reaction at this temperature; instead, we would most likely use a CSTR or PFR. See Problem P13-1B (c) to reflect on this example.
Wrong Reactor Choice!
13.4 Unsteady Operation of a CSTR
13.4.1 Startup
In reactor startup, it is often very important how temperature and concentrations approach their steady-state values. For example, a significant overshoot in temperature may cause a reactant or product to degrade, or the overshoot may be unacceptable for safe operation, such as a secondary reaction runaway. If either case were to occur, we would say that the system exceeded its practical stability limit. The practical limit is specific to the specific reaction and conditions under which the reaction is carried out, and is usually determined by the reaction safety engineer. Although we can solve the unsteady temperature–time and concentration–time equations numerically to see if such a limit is exceeded, it is often more insightful to study the approach to steady state by using the temperature–concentration phase plane. To illustrate these concepts, we shall confine our analysis to a liquid-phase reaction carried out in a CSTR.
Startup of a CSTR
A qualitative discussion of how a CSTR approaches steady state is given in PRS R13.5 on the CRE Web site. This analysis, summarized in Figure PRS13.5 in the Summary is developed to show the four different regions into which the phase plane is divided and how they allow one to sketch the approach to the steady state.
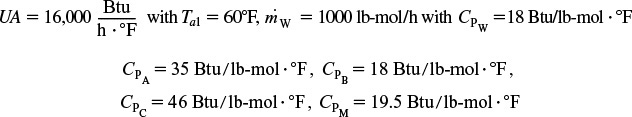
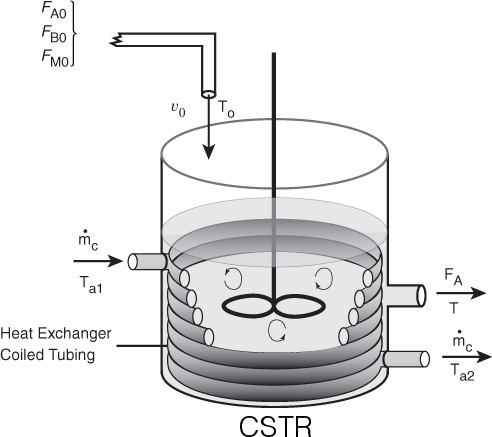
Example 13–4 Startup of a CSTR
Again, we consider the production of propylene glycol (C) in a CSTR with a heat exchanger in Example 12-3. Initially there is only water, Cwi = 3.45 lb-mol/ft3, at Ti = 75°F and 0.1 wt % H2SO4 in the 500-gallon reactor. The feed stream consists of 80 lb-mol/h of propylene oxide (A), 1000 lb-mol/h of water (B) containing 0.1 wt % H2SO4, and 100 lb-mol/h of methanol (M).
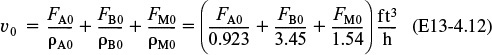
The water coolant flows through the heat exchanger at a rate of 5 lbm/s (1000 lb-mol/h). The molar densities of pure propylene oxide (A), water (B), and methanol (M) are ρA0 = 0.923 lb-mol/ft3, ρB0 = 3.45 lb-mol/ft3, and ρM0 = 1.54 lb-mol/ft3, respectively.
Plot the temperature and concentration of propylene oxide as a function of time, and a concentration vs. temperature graph for different entering temperatures and initial concentrations of A in the reactor.
Additional information:
Again, the temperature of the mixed reactant streams entering the CSTR is T0 = 75°F.
Solution
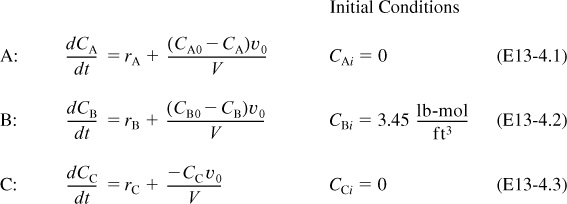
Mole Balances:
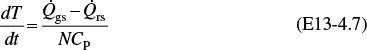
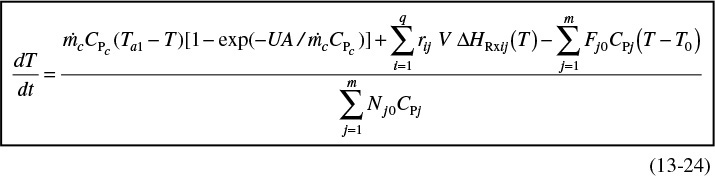
Energy Balance:
where
using
the “heat removed” term from the unsteady startup of a CSTR is similar to that for the “heat removed” term from a semi-batch reactor. Recalling Equations (12-12) and (12-19)
Evaluation of Parameters:
Neglecting ΔCP because it changes the heat of reaction insignificantly over the temperature range of the reaction, the heat of reaction is assumed constant at its reference temperature
The Polymath program is shown in Table E13-4.1.
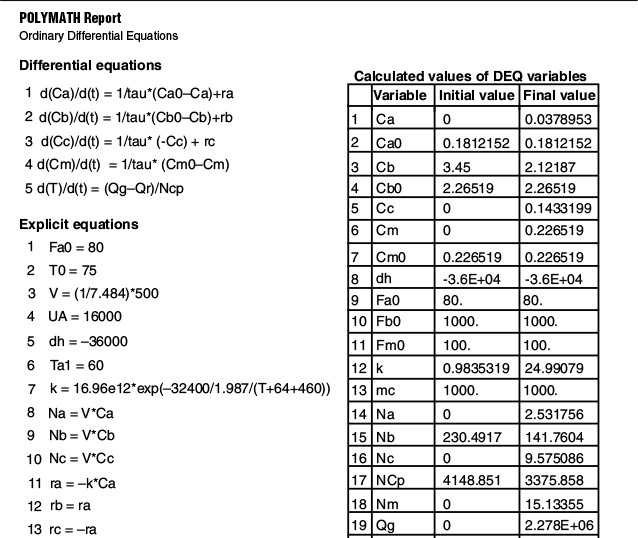

Figures E13-4.1 and E13-4.2 show the concentration of propylene oxide and reactor temperature as a function of time, respectively, for an initial temperature of Ti = 75°F and only water in the tank (i.e., CAi = 0). One observes that both the temperature and concentration oscillate around their steady-state values (T = 138°F, CA = 0.039 lb-mol/ft3) as steady state is approached.
Unacceptable startup
Figure E13-4.3 combines Figures E13-4.1 and E13-4.2 into a phase plot of CA versus T. The final operating concentration of A is 0.0379 lb-mol/ft3 at a temperature of 138°F. The arrows on the phase-plane plots show the trajectories with increasing time. The maximum temperature reached during startup is 152°F, which is below the practical stability limit of 180°F.
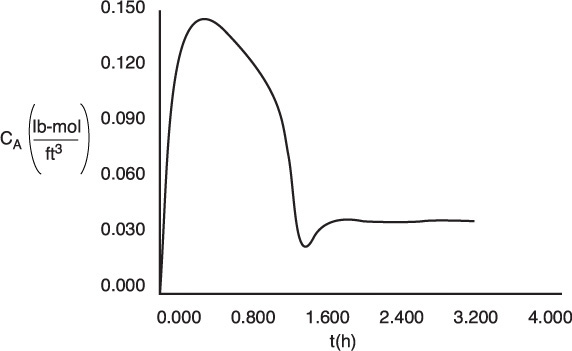
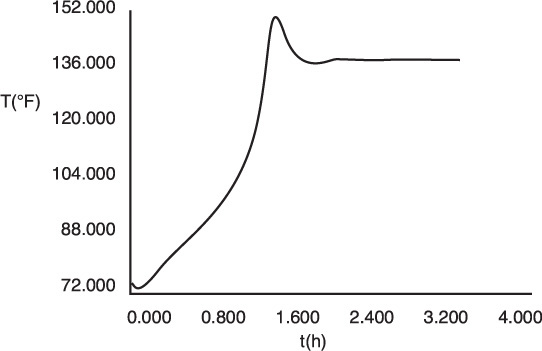
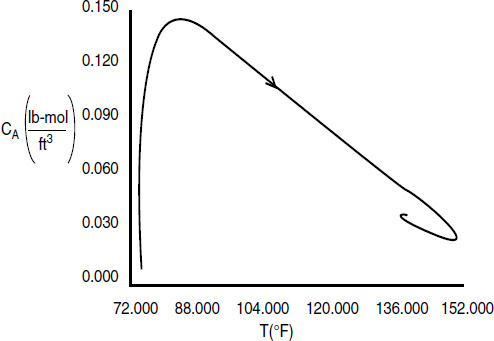
Figure E13-4.3 Concentration–temperature phase-plane trajectory using Figures E13-4.1 and E13-4.2.
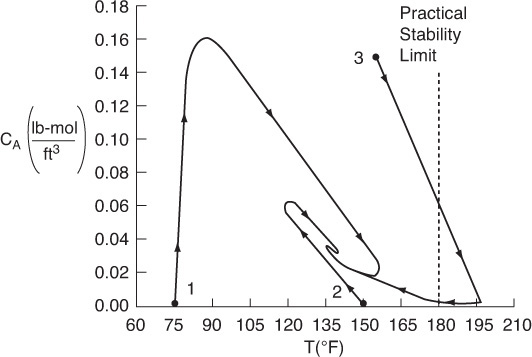
Next, consider Figure E13-4.4, which shows three different trajectories for three different sets of initial conditions:
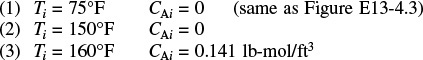
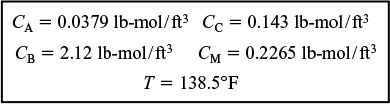
After three hours, the reaction is operating at steady state and all three trajectories converge on the final steady-state temperature of 138°F and the corresponding concentrations
Oops! The practical stability limit was exceeded.
For this reaction system, the plant safety office believes that an upper temperature limit of 180°F should not be exceeded in the tank. This temperature is the practical stability limit. The practical stability limit represents a temperature above which it is undesirable to operate because of unwanted side reactions, safety considerations, secondary runaway reactions, or damage to equipment. Consequently, we see that if we started at an initial temperature of Ti = 160°F and an initial concentration of 0.143 mol/dm3, the practical stability limit of 180°F would be exceeded as the reactor approached its steady-state temperature of 138°F. See the concentration–temperature trajectory in Figure E13-4.4.
Figures E13-4.1 through E13-4.4 show the concentration and temperature time trajectories for the start up of a CSTR for different initial conditions.
Analysis: One of the purposes of this example was to demonstrate the use of phase plots, e.g., T versus CA, in analyzing CSTR startup. Phase plots allow us to see how the steady state is approached for different sets of initial conditions and if the practical stability limit is exceeded causing a secondary, more exothermic reaction to set in.
13.5 Nonisothermal Multiple Reactions
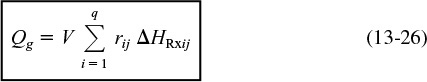
For q multiple reactions with m species occurring in either a semibatch or batch reactor, Equation (13-15) can be generalized in the same manner as the steady-state energy balance to give
For large coolant flow rates, Equation (13-17) becomes

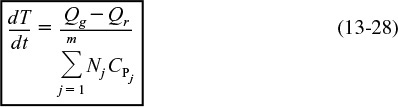
Rearranging Equation (13-18) and letting
and
we can write Equation (13-18) in the form
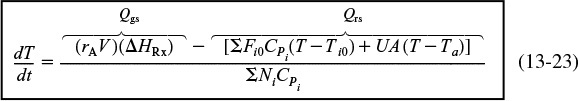
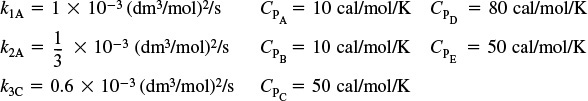
Example 13–5 Multiple Reactions in a Semibatch Reactor
The series reactions
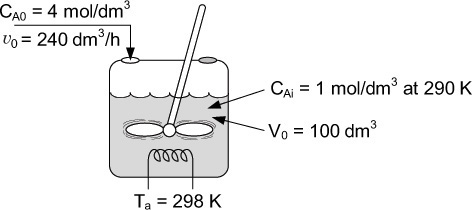
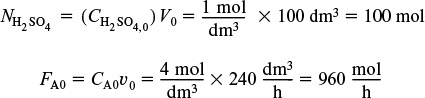
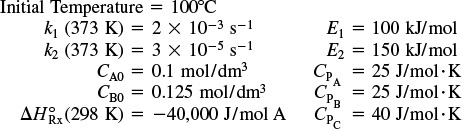
are catalyzed by H2SO4. All reactions are first order in the reactant concentration. However, Reaction (1) is exothermic and Reaction (2) is endothermic. The reaction is to be carried out in a semibatch reactor that has a heat exchanger inside with UA = 35,000 cal/h·K and a constant exchanger temperature, Ta, of 298 K. Pure A enters at a concentration of 4 mol/dm3, a volumetric flow rate of 240 dm3/h, and a temperature of 305 K. Initially, there is a total of 100 dm3 of liquid in the reactor, which contains 1.0 mol/dm3 of A and 1.0 mol/dm3 of the catalyst H2SO4. The reaction rate is independent of the catalyst concentration. The initial temperature inside the reactor is 290 K.
Plot and analyze the species concentrations and reactor temperature as a function of time.
Additional information:

Solution

1. Mole Balances:
(a) Rate Laws:
(b) Relative Rates:
(c) Net Rates:
3. Stoichiometry (liquid phase): Use CA, CB, CC
4. Energy Balance:
Semibatch reactor:
A slight rearrangement of (13-23) is

Expanding
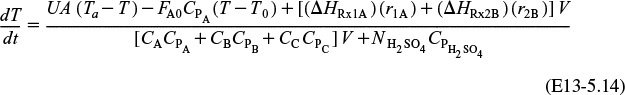
Substituting the parameter values into Equation (E13-5.14)

Equations (E13-5.1) through (E13-5.3) and (E13-5.8) through (E13-5.12) can be solved simultaneously with Equation (E13-5.14) using an ODE solver. The Polymath program is shown in Table E13-5.1. The concentration–time and temperature– time trajectories are shown in Figures E13-5.1 and E13-5.2.
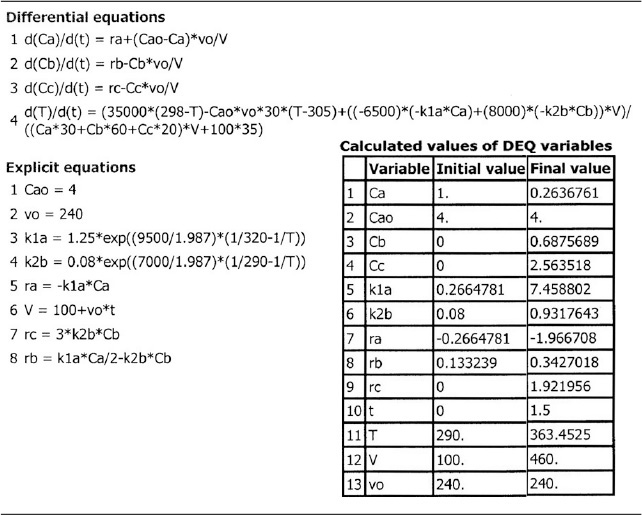


Analysis: At the start of the reaction, both CA and T in the reactor increase because CA0 and T0 are greater than CAi and Ti. This increase continues until the rate of consumption of the reacting species is greater than the feed rate to the reactor. We note that at about 0.2 h, the reactor temperature exceeds the feed temperature (i.e., 305 K) as a result of the heat generated by the exothermic reaction (Reaction 1). The temperature continues to rise until about 0.6 h, at which point reactant A is virtually all consumed. After this point the temperature begins to drop for two reasons: (1) the reactor is cooled by the heat exchanger and (2) heat is absorbed by the endothermic reaction rate (Reaction 2). The question is, does the maximum temperature (435 K) exceed a temperature that is too high, resulting in a high vapor pressure that then results in evaporation losses or causes a highly exothermic secondary reaction to set in?
Example 13–6 T2 Laboratories Explosion4
4 This example was coauthored by Professors Ronald J. Willey, Northeastern University, Michael B. Cutlip, University of Connecticut, and H. Scott Fogler, University of Michigan, and published in Process Safety Progress, 30, 1 (2011).
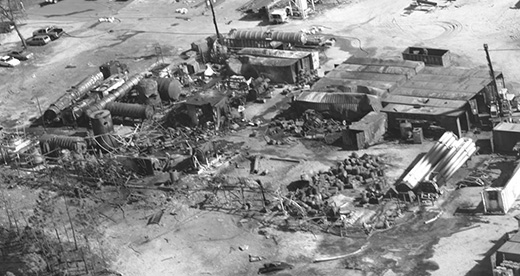
Figure E13-6.1 Aerial photograph of T2 taken December 20, 2007. (Courtesy of Chemical Safety Board.)
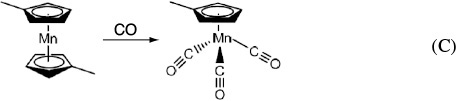
T2 Laboratories manufactured a fuel additive, methylcyclopentadienyl manganese tricarbonyl (MCMT), in a 2,450-gallon, high-pressure batch reactor utilizing a three-step batch process.
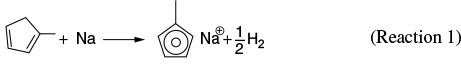
Step 1a. The liquid-phase metalation reaction between methylcyclopentadiene (MCP) and sodium in a solvent of diethylene glycol dimethyl ether (diglyme) to produce sodium methylcyclopentadiene and hydrogen gas is
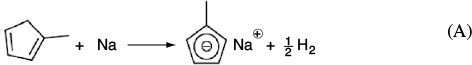
Hydrogen immediately comes out of the solution and is vented at the top in the gas head space.
Step 1b. At the end of Step 1a, MnCl2 is added. The substitution reaction between sodium methylcyclopentadiene and manganese chloride produced manganese dimethylcyclopentadiene and sodium chloride is

Step 1c. At the end of Step 1b, CO is added. The carbonylation reaction between manganese dimethylcyclopentadiene and carbon monoxide produces the final product, methylcyclopentadienyl manganese tricarbonyl (MCMT):
We will only consider Step 1a as this step is the one in which the explosion occurred.
Procedure
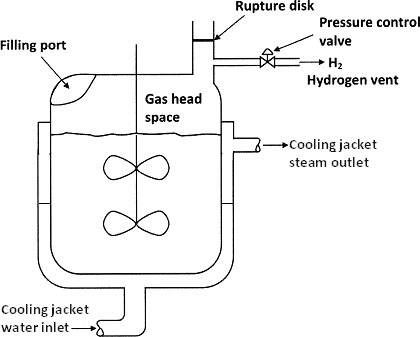
First, solid sodium is mixed in the batch reactor with methylcyclopentadiene dimer and a solvent diethylene glycol dimethyl ether (diglyme). The batch reactor is then heated to about 422 K (300˚F) with only slight reaction occurring during this heating process. On reaching 422 K, the heating is turned off, as the exothermic reaction is now proceeding, and the temperature continues to increase without further heating. When the temperature reaches 455.4 K (360˚F), the operator initiates cooling using the evaporation of boiling water in the reactor jacket as the heat sink (Ta = 373.15 K) (212˚F).
What Happened
On December 19, 2007, when the reactor reached a temperature of 455.4 K (360˚F), the process operator could not initiate the flow of cooling water to the cooling jacket shown in Figure E13-6.2. Thus, the expected cooling of the reactor was not available and the temperature in the reactor continued to rise. The pressure also increased as hydrogen continued to be produced at an increased rate, to the point that the reactor’s pressure control valve system on the 1-inch diameter hydrogen venting stream could no longer maintain the operating pressure at 50 psig (4.4 atm). As the temperature continued to increase further, a previously unknown exothermic reaction of the diglyme solvent that was catalyzed by sodium accelerated rapidly.
This reaction produced even more hydrogen, causing the pressure to rise even faster, eventually causing the rupture disk which was set at 28.2 atm absolute (400 psig), to break, in the 4-inch diameter relief line of H2. Even with the relief line open, the rate of production of H2 was now far greater than the rate of venting, causing the pressure to continue to increase to the point that it ruptured the reactor vessel initiating a horrific explosion. The T2 plant was completely leveled and four personnel lives were lost. Surrounding businesses were heavily damaged and additional injuries were sustained.
Before continuing with this example, it might be helpful to view the 9-minute Chemical Safety Board (CSB) video, which you can access directly from the CRE Web site (under YouTube videos), or you can read the supporting reports (http://www.csb.gov/videos/runaway-explosion-at-t2-laboratories/). You can also search the Web for “T2 explosion video.”
Simplified Model
Summarizing the important reactions for Step 1

Let A = methycylcopentadiene, B = sodium, S = solvent (diglyme), and D = H2. This runaway reaction can be approximately modeled with two reactions. These reactions are
![]()
![]()
In Reaction (1), A and B react to form products. Reaction (2) represents the decomposition of the liquid-phase solvent S catalyzed by the presence of B, but this reaction only begins to proceed once a temperature of approximately 470 K is reached.
The rate laws, along with the specific reaction-rate constants at the initial temperature of 422 K, are

The heats of reaction are constant.
ΔHRx1A = –45,400 J/mol
ΔHRx2S = –320,000 J/mol
The sum of products of the moles of each species and their corresponding heat capacities in the denominator of Equation (13-12) is essentially constant at
∑ NjCPj = 1.26 × 10⁷ J/K
Assumptions
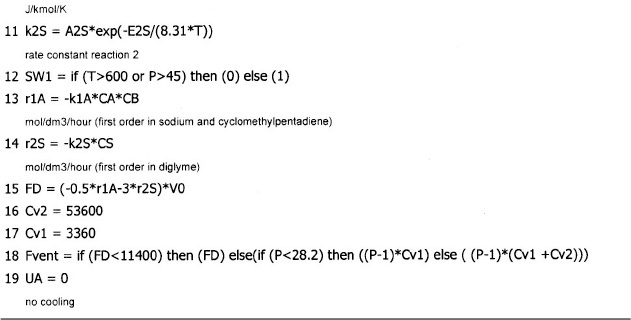
Assume that the liquid volume, V0, in the reactor remains constant at 4,000 dm3 and that the vapor space, VH, above the reactor occupies 5,000 dm3. Any gas, H2 (i.e., D), that is formed by Reactions (1) and (2) immediately appears as an input stream FD to the head-space volume. The dissolved H2 and the vapor pressures for the liquid components in the reactor can be neglected. The initial absolute pressure within the reactor is 4.4 atm (50 psig). During normal operation, the H2 generated obeys the ideal gas law. The pressure control system on the H2 vent stream maintains the pressure, P, at 4.40 atm up to a flow of 11,400 mol/hr. The reactor vessel will fail when the pressure exceeds 45 atm or the temperature exceeds 600 K.
Additional information:
UA = 2.77 x 10⁶ J hr–1 K–1. The concentrations in the reactor at the end of the reactor heating at 422 K are CA0 = 4.3 mol/dm3, CB0 = 5.1 mol/dm3, CI0 = 0.088 mol/dm3, and CS0 = 3 mol/dm3. The sensible heat of the two gas venting streams may be neglected.
Problem Statement
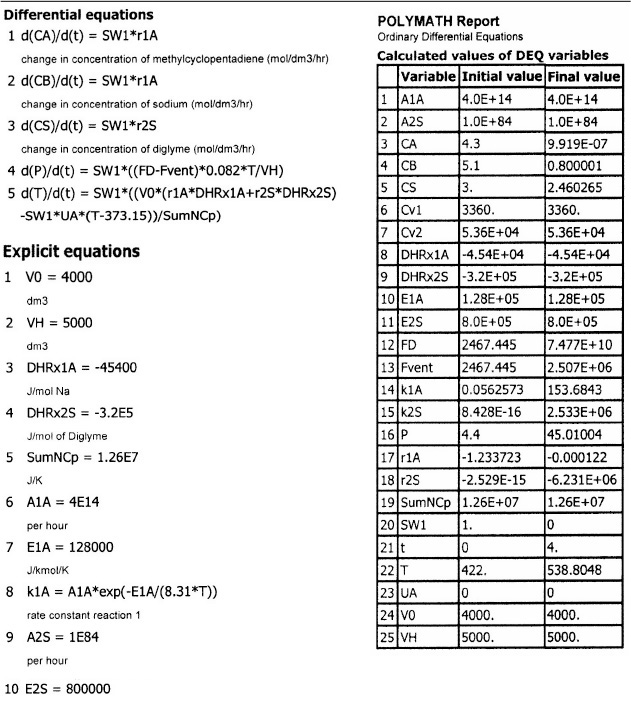
Plot and analyze the reactor temperature and head-space pressure as a function of time along with the reactant concentrations for the scenario where the reactor cooling fails to work (UA = 0). In Problem P13-1(f) you will be asked to redo the problem when the cooling water comes as expected whenever the reactor temperature exceeds 455 K.
Solution
(1) Reactor Mole Balances:
Reactor (Assume Constant Volume Batch)
Liquid
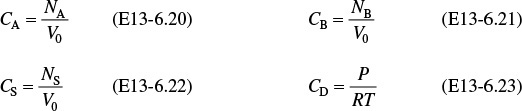
(2) Head-Space Mole Balance:
Let ND = moles of gas D in the reactor vapor space Vv. The flows in and out of the head space are shown in the figure below.
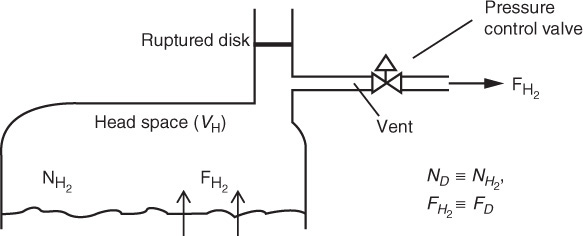
A balance on species D (H2) in the head-space volume VH yields
where Fvent is the molar flow rate of gas out of the head space through one or both outlet lines, and FD (i.e., FH2) is the molar rate of gas leaving the liquid and entering the head space and is equal to the hydrogen generated in the liquid (see relative rates and net rates in the algorithm where V0 is the liquid reactor volume).
The assumptions of a perfect gas in the head-space volume and modest changes in T allow Equation (E13-6.4) to be written in terms of total gas pressure in the reactor head space
Substituting for ND in Equation (E13-6.3) and rearranging
(3) How the Venting Works:
Gas exits the reactor through the pressure control valve line. At low gas production, the pressure control valve maintains set-point pressure at the initial pressure by venting all produced gas until the rate of gas production reaches 11,400 mol/hr.
We now need to know a little more about the venting system for H2 and the condition for flow out the vent. As the pressure increases, but is still below the rupture disk setting, the pressure control line vents to the atmosphere (1 atm) according to the equation
where P is the absolute pressure in the reactor (atm), 1 atm is the downstream pressure, and the pressure correlation constant Cv is 3,360 mol/hr • atm. If the pressure P within the reactor exceeds 28.2 atm (400 psig), the relief line activated by the rupture disk breaks and vents gas in the reactor at the rate given Fvent = (P–1)Cv2 where Cv2 = 53,600 mol/atm • hr.
After the rupture disk blowout at P = 28.2 atm, both the pressure control line and the rupture disk lines vent the reactor according to the equation
Equations (E13-6.7) through (E13-6.10) can then be used to describe the Fvent flow rate with time for the appropriate logic for the values of FD and P.
(4) Rates:
Laws:


Net Rates:
(5) Stoichiometry:
Neglect reactor-liquid volume change form loss of product gases.
(6) Energy Balance:
Applying Equation (E13-2.3) to a batch system (Fi0 = 0)
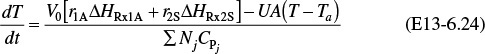
Substituting for the rate laws and ∑NjCPj

(7) Numerical Solutions: “Tricks of the Trade”
A rapid change of temperature and pressure is expected as Reaction (2) starts to run away. This typically results in a stiff system of ordinary differential equations, which can become numerically unstable and generate incorrect results. This instability can be prevented by using a software switch (SW) that will set all derivates to zero when the reactor reaches the explosion temperature or pressure. This switch can have the form of Equation (E13-6.26) in Polymath and can be multiplied by the right-hand side of all the differential equations in this problem. This operation will halt (or freeze) the dynamics when the temperature T becomes higher than 600 K or the pressure exceeds 45 atm.
We now will solve the essential equations from (E13-6.1) through (E13-6.26) for the scenario where there is no cooling and thus UA = 0. Also the switch SW1 must be implemented in all the differential equations as discussed above.
Note: The second reaction took off about 3.6 hours after starting the reactor.
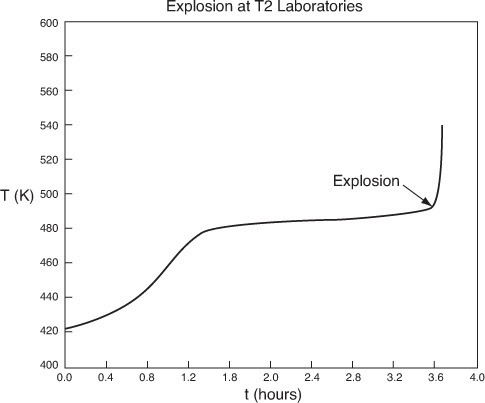
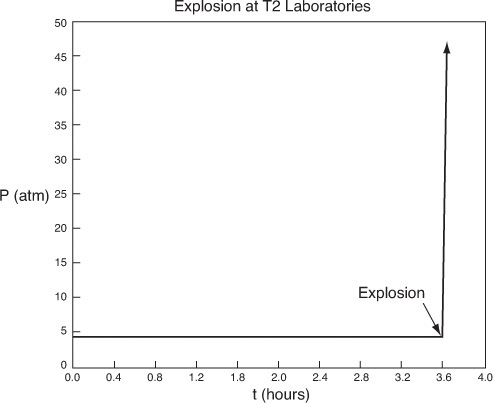
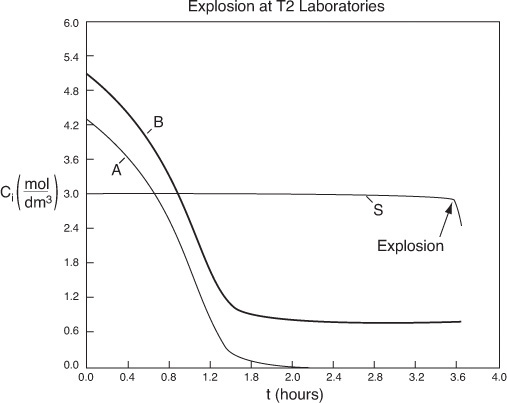
We note from Figures E13-6.3(a)–(b) that the explosion occurred at approximately 3.6 h after startup and the concentration of diglyme begins to drop sharply before that point. We also note that numerical instabilities occur at about the point of the arrows in these figures because of the rapid increase in temperature.
Analysis: Runaway would not have occurred if (1) the cooling system had not failed, causing the reactor temperature to rise and initiate a second a reaction, and (2) the solvent dygline had not decomposed at the higher temperature to produce hydrogen gas (D). The rate of production of H2 gas was greater than the removal of H2 from the head space, causing the pressure to build up to the point that it ruptured the reactor vessel.
Summary
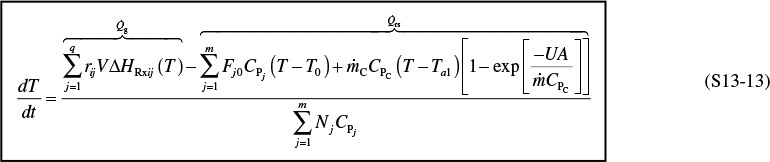
1. The energy balance on unsteady operation of a CSTR and semibatch reactors
Using the heater exchange equation (12-9) and neglecting shaft work
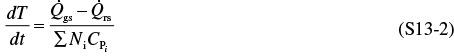
For large coolant ![]() flow rates,
flow rates, ![]() , Equation (13-22) reduces to
, Equation (13-22) reduces to
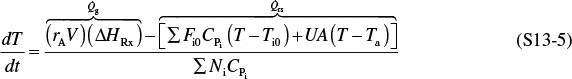
a. Non-adiabatic

where

b. Adiabatic


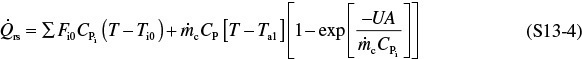
3. Semibatch reactors and startup of CSTR
Where ![]() is the same as Equation (S13-7) and
is the same as Equation (S13-7) and ![]() (sub rs, i.e., “heat removed” from semibatch) is
(sub rs, i.e., “heat removed” from semibatch) is

4. Multiple reactions (q reactions and m species)
where i = reaction number and j = species.
1. The Profssional Reference Shelf contains topics that could just as well go under “Expanded Material.”
2. Web Problem WP13-1B Multiple Reaction in a Batch Reactor.
• Learning Resources
1. Summary Notes
2. Web links: SAChE Safety Web site (www.sache.org). You will need to get the user name and password from your department chair. The kinetics (i.e., CRE) text, examples, and problems are marked K in the product sections: Safety, Health, and the Environment (S,H, & E).
3. Solved Problems
Example CD13-1 Use of the ARSST
Example CD13-2 Startup of a CSTR
Example CD13-3 Falling Off the Steady State
Example CD13-4 Proportional-Integral (PI) Control
• Living Example Problems
1. Example 13-1 Adiabatic Batch Reactor
2. Example 13-2 Safety in Chemical Plants with Exothermic Runaway Reactions
3. Example 13-3 Heat Effects in a Semibatch Reactor
4. Example 13-4 Startup of a CSTR
5. Example 13-5 Multiple Reactions in a Semibatch Reactor
6. Example 13-6 Explosion at T2 Laboratories
7. PRS Example CD13-1 Falling Off the Upper Steady State
8. PRS Example CD13-2 Integral Control of a CSTR
9. PRS Example CD13-3 Proportion-Integral Control of a CSTR
10. Example R13-4 Linear Stability
11. Example R13-1 Use of ARSST
• Professional Reference Shelf
R13.1. The Complete ARSST
In this section, further details are given to size safety valves to prevent runaway reactions.

R13.2. Falling Off the Upper Steady State
R13.3. Control of a CSTR
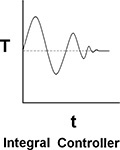
In this section, we discuss the use of proportional (P) and integral (I) control of a CSTR. Examples include I and PI control of an exothermic reaction.
Reactor with coolant flow-rate control system.
Proportional integral action
R13.4. Linearized Stability Theory (PDF)
R13.5. Approach to Steady-State Phase-Plane Plots and Trajectories of Concentration versus Temperature Startup of a CSTR (Figure R13.5) and the approach to the steady state (CRE Web site). By mapping out regions of the concentration–temperature phase plane, one can view the approach to steady state and learn if the practical stability limit is exceeded. The steady-state trajectories are shown for the mole balance (MB = 0) and energy balance (EB = 0).

R13.6. Adiabatic Operation of a Batch Reactor
R13.7. Unsteady Operation of Plug-Flow Reactor
Questions and Problems
Questions
Q13-1 Discuss with a classmate what are the most important safety considerations to address for exothermic reactions. To help answer this question, prepare a list of safety considerations for designing and operating chemical reactors. See the August 1985 issue of Chemical Engineering Progress.
Problems
P13-1B Review the example problems in this chapter and use a software package such as Polymath or MATLAB to carry out a parameter sensitivity analysis to answer the following “What if...” questions. What if...
(a) Example 13-1 LEP. (1) How would your answer change if the heat of the mixing had been neglected? (2) How much time would it take to achieve 90% conversion if the reaction were started on a very cold day where the initial temperature was 20°F? (Methanol won’t freeze at this temperature.) (3) Now, consider that a heat exchanger is added to the reactor for the propylene oxide reaction; the parameters are: CA0 = 1 lb-mol/ft3, V = 1.2 ft3 (∑NiCPi = 403 Btu°R), neglect ΔCP, UA = 0.22 Btu/°R/s, and Ta = 498 K. Plot and analyze the trajectories X, T, Qg, and Qr as a function of time.
(b) Example 13-2 LEP. Download the Living Example Problem and explore the ONCB explosion described in Example 13-2.
(1) Explain what you would do to prevent an explosion of this type from ever occurring again while still operating at the triple production specified by management.
(2) Show that no explosion would have occurred if the cooling was not shut off for the 9.04-kmol charge of ONCB or if the cooling was shut off for 10 min after 45 min of operation for the 3.17-kmol ONCB charge.
(3) Show that if the cooling had been shut off for 10 min after 12 h of operation, no explosion would have occurred for the 9.04-kmol charge.
(4) Develop a set of guidelines as to when the reaction should be quenched should the cooling fail. Perhaps safe operation could be discussed using a plot of the time after the reaction began at which the cooling failed, t0, versus the length of the cooling failure period, tf, for the different charges of ONCB.

(5) Find a set of parameter values that would cause the explosion to occur at exactly 12:18 A.M. For example, include the mass and heat capacities of the metal reactor and/or make a new estimate of UA.
(6) Finally, what if a 1/2-in. rupture disk rated at 800 psi had been installed and did indeed rupture at 800 psi (270°C)? Would the explosion still have occurred? Note: The mass flow rate ![]() varies with the cross-sectional area of the disk. Consequently, for the conditions of the reaction, the maximum mass flow rate out of the 1/2-in. disk can be found by comparing it with the mass flow rate of 830 kg/min of the 2-in. disk.
varies with the cross-sectional area of the disk. Consequently, for the conditions of the reaction, the maximum mass flow rate out of the 1/2-in. disk can be found by comparing it with the mass flow rate of 830 kg/min of the 2-in. disk.
(c) Example 13-3 LEP. Download the Living Example Problem. (1) At what times will the number of moles of C (NC = CCV) and the concentration of species C reach a maximum? (2) Are they different and, if so, why? What would the X versus t and T versus t trajectories look like if the coolant rate is increased by a factor of 10? Why is the reaction time (252s) so short?
(d) Example 13-4 LEP. Download the Living Example Problem for Startup of a CSTR, for an entering temperature of 70°F, an initial reactor temperature of 160°F, and an initial concentration of propylene oxide of 0.1 M. (1) Try other combinations of T0, Ti, and CAi, and report your results in terms of temperature–time trajectories and temperature–concentration phase planes. (2) Find a set of conditions above which the practical stability limit will be reached or exceeded and those conditions below which it will not. (3) Vary the coolant flow rate and compare with the base case given in Figures E13-4.1 to E13-4.4. Describe what you find.
(e) Example 13-5 LEP. Download the Living Example Problem. (1) Vary the volumetric flow rate 24 < v0 < 1,000 and compare with the base case. Describe any trends you find. (2) Plot and analyze NA = CAV and NB = CBV for long times (e.g., t = 15h). What do you observe? (3) Can you show that for long times NA ≅ CA0υ0/k1A and NB ≅ CA0υ0/2/k2B? (4) What do you think is happening to this semibatch reactor if it has no lid and a maximum volume of 1,000 dm3 at long times? (5) If B is the deserved product, how would you maximize NB?
(f) Example 13-6 LEP. T2 Laboratory Explosion.
(1) View the Chemical Safety Board (CSB) video online and read the supporting reports (http://www.chemsafety.gov/videoroom/detail.aspx?VID=32). Also search the Web for “T2 explosion video.”
(2) (a) What did you learn from watching the video? (b) Suggest how this reactor system should be modified and/or operated in order to eliminate any possibility of an explosion. (c) Would you use backup cooling and, if so, how? (d) How could you learn if a second reaction could be set in at a higher temperature? Hint: See PRS R13.1 The Complete ARSST.
(3) Download the Living Example Polymath E13-6. Plot CA, CB, CC, P, and T as a function of time. Vary UA between 0.0 and 2.77×10⁶ J/h/K to find the lowest value of UA that you observe a runaway. Describe the trends as you approach runaway. Did it occur over a very narrow range of UA values? Hint: The problem becomes very stiff near the explosion condition when T > 600 K or P > 45 atm. If the temperature or pressure reaches these values, set all derivatives (concentration changes, temperature change, and pressure change) and reaction rates equal to zero so that the numerical solution will complete the analysis and hold all variables at the explosion point of the reactor.
(4) Now let’s consider the actual operation in more detail. The reactor contents are heated from 300 K to 422 K at a rate of ![]() = 4 K/minute. At 422 K, the reaction rate is sufficient such that heating is turned off. The reactor temperature continues to rise because the reaction is exothermic, and, when the temperature reaches 455 K, the cooling water turns on and cooling is initiated. Model this situation for the case when UA = 2.77×10⁶ J/h/K and when UA = 0.
= 4 K/minute. At 422 K, the reaction rate is sufficient such that heating is turned off. The reactor temperature continues to rise because the reaction is exothermic, and, when the temperature reaches 455 K, the cooling water turns on and cooling is initiated. Model this situation for the case when UA = 2.77×10⁶ J/h/K and when UA = 0.
(5) What is the maximum time in minutes that the cooling can be lost (UA = 0) starting at the time when the reactor temperature reaches 455 K so that the reactor will not reach the explosion point? The conditions are those of part (1) of this problem.
(6) Vary the parameters and operating conditions and describe what you find.
(g) LEP PRS R13.2 Example CD13-5. Download the Living Example Problem for Falling Off the Upper Steady State. Try varying the entering temperature, T0, between 80°F and 68°F, and plot the steady-state conversion as a function of T0. Vary the coolant rate between 10,000 and 400 mol/h. Plot conversion and reactor temperature as a function of coolant rate.
(h) LEP PRS R13.3 Example CD13-2. Download the Living Example Problem. Vary the gain, kC, between 0.1 and 500 for the integral controller of the CSTR. Is there a lower value of kC that will cause the reactor to fall to the lower steady state or an upper value to cause it to become unstable? What would happen if T0 were to fall to 65°F or 60°F?
(i) LEP PRS R13.3 Example CD13-3. Download the Living Example Problem. Learn the effects of the parameters kC and τI. Which combination of parameter values generates the least and greatest oscillations in temperature? Which values of kC and τI return the reaction to steady state the quickest?
(j) SAChE. Go to the SAChE Web site (www.sache.org). On the left-hand menu, select “SaChe Products.” Select the “All” tab and go to the module entitled: “Safety, Health and the Environment (S, H & E).” The problems are for KINETICS (i.e., CRE). There are some example problems marked K and explanations in each of the above S, H & E selections. Solutions to the problems are in a different section of the site. Specifically look at: Loss of Cooling Water (K-1), Runaway Reactions (HT-1), Design of Relief Values (D-2), Temperature Control and Runaway (K-4) and (K-5), and Runaway and the Critical Temperature Region (K-7). Go through the K problems and write a paragraph on what you have learned. Your instructor or department chair should have the username and password to enter the SAChE Web site in order to obtain the module with the problems.
P13-2B The following is an excerpt from The Morning News, Wilmington, Delaware (August 3, 1977): “Investigators sift through the debris from blast in quest for the cause [that destroyed the new nitrous oxide plant]. A company spokesman said it appears more likely that the [fatal] blast was caused by another gas—ammonium nitrate—used to produce nitrous oxide.” An 83% (wt) ammonium nitrate and 17% water solution is fed at 200°F to the CSTR operated at a temperature of about 510°F. Molten ammonium nitrate decomposes directly to produce gaseous nitrous oxide and steam. It is believed that pressure fluctuations were observed in the system and, as a result, the molten ammonium nitrate feed to the reactor may have been shut off approximately 4 min prior to the explosion.
(a) Can you explain the cause of the blast?
(b) If the feed rate to the reactor just before shutoff was 310 lbm of solution per hour, what was the exact temperature in the reactor just prior to shutdown? Use the data to calculate the exact time it took for the reactor to explode after the feed was shut off to the reactor.
Assume that at the time the feed to the CSTR stopped, there was 500 lbm of ammonium nitrate in the reactor at a temperature of 520°F. The conversion in the reactor is virtually complete at about 99.99%. Additional data for this problem are given in Problem 12-5C. How would your answer change if 100 lbm of solution were in the reactor? 310 lbm? 800 lbm? What if T0 = 100°F? 500°F? How would you start up or shut down and control such a reaction?
Safety: Shut Down an Open-Ended Problem. Rather than shut off the total feed to the reactor, it should be diluted with pure water at a volumetric rate υw while reducing the ammonium nitrate reactant feed rate. Keep the same total volumetric feed υ0 rate and entering temperature. Choose a υw and plot the reactor temperature and composition as a function of time. At what time could you shut off the water feed safely?
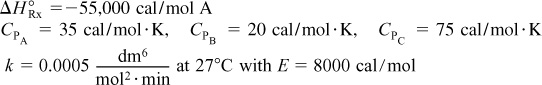
P13-3B The liquid-phase reaction in Problems P11-4A and P12-7A is to be carried out in a semibatch reactor. There are 500 mol of A initially in the reactor at 25°C. Species B is fed to the reactor at 50°C and a rate of 10 mol/min. The feed to the reactor is stopped after 500 mol of B has been fed.
(a) Plot and analyze the temperature Qr, Qg and conversion as a function of time when the reaction is carried out adiabatically. Calculate to t = 2 h.
(b) Plot and analyze the conversion as a function of time when a heat exchanger (UA = 100 cal/min · K) is placed in the reactor and the ambient temperature is constant at 50°C. Calculate to t = 3 h.
(c) Repeat part (b) for the case where the reverse reaction cannot be neglected.
New parameter values:
k = 0.01 (dm3/mol · min) at 300 K with E = 10 kcal/mol
V0 = 50 dm3, υ0 = 1 dm3/min, CA0 = CB0 = 10 mol/dm3
For the reverse reaction: kr = 0.1 min–1 at 300 K with Er = 16 kcal/mol
P13-4B Sophia and Nic are operating a batch reactor and the reaction is first-order, liquid-phase, and exothermic. An inert coolant is added to the reaction mixture to control the temperature. The temperature is kept constant by varying the flow rate of the coolant (see Figure P13-4B).
(a) Help them calculate the flow rate of the coolant 2 h after the start of the reaction. (Ans.: FC = 3.157 lb/s.)
(b) It is proposed that rather than feeding a coolant to the reactor, a solvent be added that can be easily boiled off, even at moderate temperatures. The solvent has a heat of vaporization of 1000 Btu/lb and initially there are 25 lb-mol of A placed in the tank. The initial volume of solvent and reactant is 300 ft3. Determine the solvent evaporation rate as a function of time. What is the rate at the end of 2 h?
Additional information:
Temperature of reaction: 100°F
Value of k at 100°F: 1.2 × 10⁻⁴ s–1
Temperature of coolant: 80°F
Heat capacity of all components: 0.5 Btu/lb · °F
Density of all components: 50 lb/ft3
![]() : –25,000 Btu/lb-mol
: –25,000 Btu/lb-mol
Initially:
Vessel contains only A (no B or C present)
CA0: 0.5 lb-mol/ft3
Initial volume: 50 ft3
W2014 CRE U of M MidTermII
is carried out adiabatically in a constant-volume batch reactor. The rate law is
Plot and analyze the conversion, temperature, and concentrations of the reacting species as a function of time.
Additional information:
P13-6B The elementary irreversible liquid-phase reaction
is to be carried out in a semibatch reactor in which B is fed to A. The volume of A in the reactor is 10 dm3, the initial concentration of A in the reactor is 5 mol/dm3, and the initial temperature in the reactor is 27°C. Species B is fed at a temperature of 52°C and a concentration of 4 M. It is desired to obtain at least 80% conversion of A in as short a time as possible, but at the same time the temperature of the reactor must not rise above 130°C. You should try to make approximately 120 mol of C in a 24-hour day, allowing for 30 minutes to empty and fill the reactor between each batch. The coolant flow rate through the reactor is 2000 mol/min. There is a heat exchanger in the reactor.
(a) What volumetric feed rate (dm3/min) do you recommend?
(b) How would your answer or strategy change if the maximum coolant rate dropped to 200 mol/min? To 20 mol/min?
Additional information:
CP(coolant) = 18 cal/mol·K
P13-7B The irreversible reaction liquid phase in Problems P11-4A and P12-7A
is to be carried out in a 10-dm3 batch reactor. Plot and analyze the temperature and the concentrations of A, B, and C as a function of time for the following cases:
(a) Adiabatic operation.
(b) Values of UA of 10,000, 40,000 and 100,000 J/min • K.
(c) Use UA = 40,000 J/min • K and different initial reactor temperatures.
An equal molar feed in A and B enters at 27°C, and the volumetric flow rate is 2 dm3/s and CA0 = 0.1 kmol/m3.
Additional information:
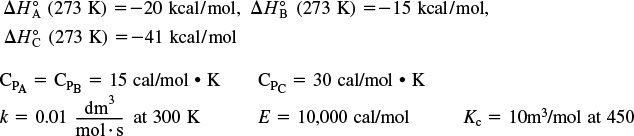
P13-8B The following reactions are taking place in a 2000-dm3 liquid-phase batch reactor under a pressure of 400 psig

The initial temperature is 450 K and the initial concentrations of A, B, and C are 1.0, 0.5, and 0.2 mol/dm3, respectively. The coolant flow rate was at its maximum value so that Ta1 = Ta2 = Ta = 400 K, so that the product, the exchange area, and the overall heat transfer coefficient, UA, is UA = 100 cal/s•K.
(a) If Qr > Qg at time t = 0, and there is no failure of the heat exchange system, is there any possibility that the reactor will run away? Explain.
(b) What is Qr at t = 0? (Ans.:Qr = 5,000 cal/s)
(c) What is Qg at t = 0? (Ans.:Qg = 5,000 cal/s)
(d) What is the initial rate of increase in temperature, (i.e., dT/dt) at t = 0?
![]()
(e) Suppose that the ambient temperature Ta is lowered from 400 K to 350 K; what is the initial rate of reactor temperature change?
![]()
Plot the temperatures and all the concentrations as a function of time up to t = 1000 s.
(f) A suggestion was made to add 50 moles of inerts at a temperature of 450 K. Will the addition of the inerts make runaway more likely or less likely? How? Show quantitatively.
As a first approximation, assume all heats of reaction are constant (i.e., ΔCPij ≅ 0). Specific reaction rates at 450 K are
P13-9B The reactions on the CRE Web site in Problem CD12GA2 are to be carried out in a semibatch reactor. How would you carry out this reaction (i.e., T0, υ0, Ti)? The molar concentrations of pure A and pure B are 5 and 4 mol/dm3, respectively. Plot and analyze the concentrations, temperatures, and the overall selectivity as a function of time for the conditions you chose.
• Additional Homework Problems
A number of homework problems that can be used for exams or supplementary problems or examples are found on the CRE Web site, www.umich.edu/~elements/5e/index.html.
Supplementary Reading
1. A number of solved problems for batch and semibatch reactors can be found in
WALAS, S. M., Chemical Reaction Engineering Handbook. Amsterdam: Gordon and Breach, 1995, pp. 386–392, 402, 460–462, and 469.
Safety
CROWL, DANIEL A. and JOSEPH F. LOUVAR, Chemical Process Safety: Fundamentals with Applications, 3rd ed. Upper Saddle River, NJ: Prentice Hall, 2001.
EDGAR, T. F., “From the Classical to the Postmodern Era,” Chem. Eng. Educ., 31, 12 (1997).
KLETZ, TREVOR A., “Bhopal Leaves a Lasting Legacy: The Disaster Taught Some Hard Lessons That the Chemical Industry Still Sometimes Forgets,” Chemical Processing, p. 15 (Dec. 2009).
Links
1. The SAChE Web site has a great discussion on reactor safety with examples (www.sache.org). You will need a username and password; both can be obtained from your department chair. Hit the 2003 Tab. Go to K Problems.
2. The reactor lab developed by Professor Herz and discussed in Chapters 4 and 5 could also be used here: www.reactorlab.net.

3. See the Center for Chemical Process Safety (CCPS) Web site, www.aiche.org/ccps/.