6. Isothermal Reactor Design: Moles and Molar Flow Rates
Don’t let your fears ...
Get in the way of your dreams
Anonymous
6.1 The Molar Flow Rate Balance Algorithm
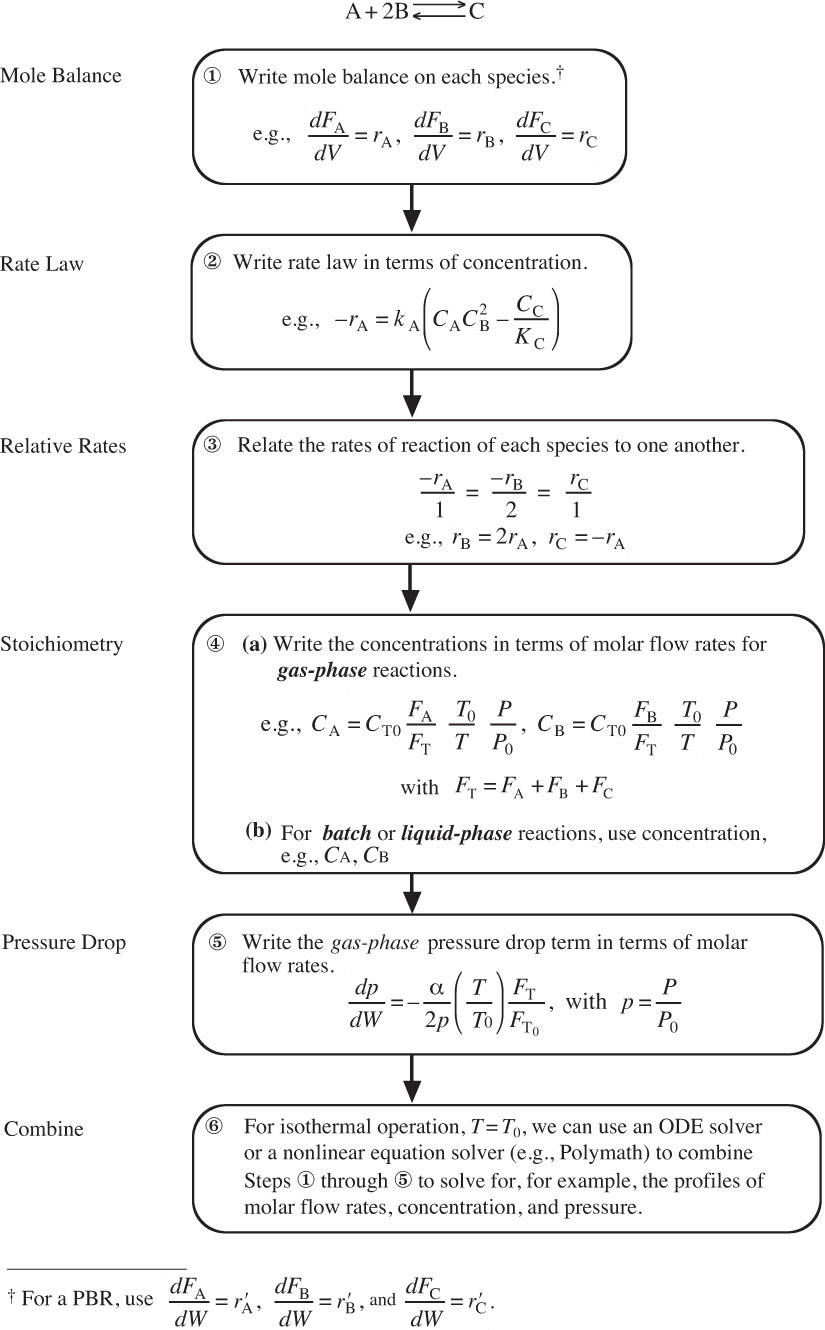
There are many instances when it is much more convenient to work in terms of the number of moles (NA, NB) or molar flow rates (FA, FB, etc.) rather than conversion. Membrane reactors and multiple reactions taking place in the gas phase are two such cases where molar flow rates are necessary rather than conversion. We now modify our algorithm by using concentrations for liquids and molar flow rates for gases as our dependent variables. The main difference between the conversion algorithm and the molar flow rate/concentration algorithm is that, in the conversion algorithm, we needed to write a mole balance on only one species, whereas in the molar flow rate and concentration algorithm, we must write a mole balance on each and every species. This algorithm is shown in Figure 6-1. First, we write the mole balances on all species present, as shown in Step ![]() . Next, we write the rate law, Step
. Next, we write the rate law, Step ![]() , and then we relate the mole balances to one another through the relative rates of reaction, as shown in Step
, and then we relate the mole balances to one another through the relative rates of reaction, as shown in Step ![]() . Steps
. Steps ![]() and
and ![]() are used to relate the concentrations in the rate law to the molar flow rates. In Step
are used to relate the concentrations in the rate law to the molar flow rates. In Step ![]() , all the steps are combined by the ODE solver (e.g., Polymath).
, all the steps are combined by the ODE solver (e.g., Polymath).
Used for:
• Multiple rxns
• Membranes
• Unsteady state
6.2 Mole Balances on CSTRs, PFRs, PBRs, and Batch Reactors
6.2.1 Liquid Phase
For liquid-phase reactions, the density remains constant and consequently there is no change in either the volume V or the volumetric flow rate υ = υ0 during the course of the reaction. Therefore, concentration is the preferred design variable. The mole balances derived in Chapter 1 (Table S-1) are now applied to each species for the generic reaction
The mole balances are then coupled to one another using the relative rates of reaction
Used to couple the mole balances
to arrive at Table 6-1, which gives the balance equations in terms of concentration for the four types of reactors we have been discussing. We see from Table 6-1 that we have only to specify the parameter values for the system (CA0, υ0, etc.) and for the rate-law parameters (e.g., kA, α, β) to solve the coupled ordinary differential equations for either BRs, PFRs, or PBRs, or to solve the coupled algebraic equations for a CSTR.


6.2.2 Gas Phase
The mole balances for gas-phase reactions are given in Table 6-2 in terms of the number of moles (batch) or molar flow rates for the generic rate law for the generic reaction, Equation (2-1). The molar flow rates for each species Fj are obtained from a mole balance on each species (i.e., A, B, C, and D), as given in Table 6-2. For example, for a plug-flow reactor
Must write a mole balance on each species
The generic power-law rate law for species A is
Rate Law
The rate law wrt A is coupled with the equation for relative rates,
Given the rate law for species A, we use Equation (3-1) to substitute for species j, rj, in Equation (1-11), the PFR mole balance.
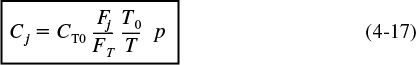
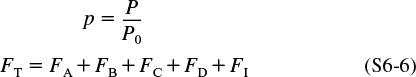
To relate concentrations to molar flow rates, recall Equation (4-17), with p = P/P0
Stoichiometry
The pressure-drop equation, Equation (5-28), for isothermal operation (T = T0) is
1. Mole balances:

We shall continue the algorithm using a PBR as an example.
2. Rates:
Rate Law
Relative Rates
then
Gas phase
3. Stoichiometry:
Concentrations

Total molar flow rate: FT = FA + FB + FC + FD + FI
4. Combine:
Appropriate reactor mole balance on each species
Concentration for each species
Pressure-drop equation
5. Evaluate:
1. Specify and enter parameter values: kA, CT0, α, β, T0, a, b, c, d
2. Specify and enter entering molar flow rates: FA0, FB0, FC0, FD0, and final volume, Vfinal
6. Use an ODE solver.
Many times we will let the ODE solver replace Step 4, Combine.
TABLE 6-2 ALGORITHM FOR GAS-PHASE REACTIONS
The total molar flow rate is given by the sum of the flow rates of the individual species

when species A, B, C, D, and inert I are the only ones present. Then
FT = FA + FB + FC + FD + FI
We now combine all the preceding information, as shown in Table 6-2.1
1 View the YouTube video made by the chemical reaction engineering students at the University of Alabama, entitled Find Your Rhythm. Videos can be accessed directly from the home page of the CRE Web site, www.umich.edu/~elements/5e/index.html.
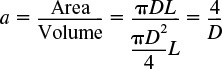
6.3 Application of the PFR Molar Flow Rate Algorithm to a Microreactor
Microreactors are emerging as a new technology in CRE. Microreactors are characterized by their high surface-area-to-volume ratios in their microstructured regions that contain tubes or channels. A typical channel width might be 100 μm with a length of 20,000 μm (2 cm). The resulting high surface-area-to-volume ratio (ca. 10,000 m2/m3) reduces or even eliminates heat and mass transfer resistances often found in larger reactors. Consequently, surfacecatalyzed reactions can be greatly facilitated, hot spots in highly exothermic reactions can be minimized, and in many cases highly exothermic reactions can be carried out isothermally. These features provide the opportunity for microreactors to be used to study the intrinsic kinetics of reactions. Another advantage of microreactors is their use in the production of toxic or explosive intermediates where a leak or microexplosion for a single unit will do minimal damage because of the small quantities of material involved. Other advantages include shorter residence times and narrower residence time distributions.
A photo of a micro reactor is shown in Figure P5-21B on page 203.
Advantages of microreactors
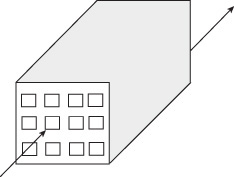
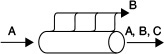
Figure 6-2 shows (a) a microreactor with heat exchanger and (b) a microplant with reactor, valves, and mixers. Heat, ![]() , is added or taken away by the fluid flowing perpendicular to the reaction channels, as shown in Figure 6-2(a). Production in microreactor systems can be increased simply by adding more units in parallel. For example, the catalyzed reaction
, is added or taken away by the fluid flowing perpendicular to the reaction channels, as shown in Figure 6-2(a). Production in microreactor systems can be increased simply by adding more units in parallel. For example, the catalyzed reaction
required only 32 microreaction systems in parallel to produce 2000 tons/yr of acetate!
Microreactors are also used for the production of specialty chemicals, combinatorial chemical screening, lab-on-a-chip, and chemical sensors. In modeling microreactors, we will assume they are either in plug flow for which the mole balance is
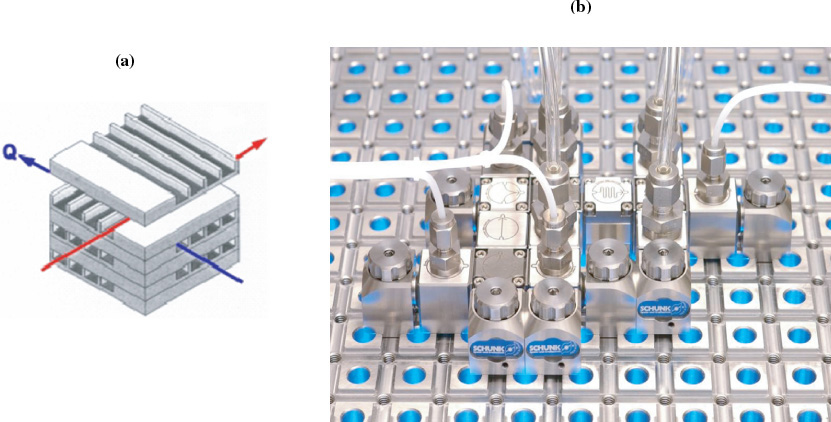
Figure 6-2 Microreactor (a) and microplant (b). (Photo courtesy of Ehrfeld, Hessel, and Löwe, Microreactors: New Technology for Modern Chemistry, Weinheim, Germany: Wiley-VCH, 2000.)
or in laminar flow, in which case we will use the segregation model discussed in Chapter 17. For the plug-flow case, the algorithm is described in Figure 6-1.
Example 6–1 Gas-Phase Reaction in a Microreactor—Molar Flow Rates
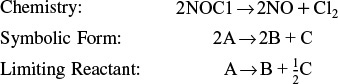
The gas-phase reaction
is carried out at 425°C and 1641 kPa (16.2 atm). Pure NOCl is to be fed, and the reaction follows an elementary rate law.2 It is desired to produce 20 tons of NO per year in a microreactor system using a bank of ten microreactors in parallel. Each microreactor has 100 channels with each channel 0.2 mm square and 250 mm in length.
2 J. B. Butt, Reaction Kinetics and Reactor Design, 2nd ed. (New York: Marcel Dekker, 2001), p. 153.
(a) Plot and analyze the molar flow rates as a function of volume down the length of the reactor. The volume of each channel is 10–5 dm3.
(b) What is the reactor volume necessary to achieve 85% conversion?
To produce 20 tons per year of NO at 85% conversion would require a feed rate of 0.0226 mol/s of NOCl, or 2.26 × 10⁻⁵ mol/s per channel. The rate constant is
Solution
For one channel

Find V.
Although this particular problem could be solved using conversion, we shall illustrate how it can also be solved using molar flow rates as the variable in the mole balance. Why do we do this? We do this to give practice using molar flow rates as the variables in order to help prepare the reader for the more complex problems where conversion cannot be used as a variable.
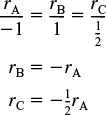
We first write the reaction in symbolic form and then divide by the stoichiometric coefficient of the limiting reactant, NOCl.
1. Mole balances on species A, B, and C:

2. Rates:
(a) Rate Law
(b) Relative Rates
3. Stoichiometry: Gas phase with T = T0 and P = P0, then ![]() Concentration Gas Phase
Concentration Gas Phase
Applying Equation (4-17) to species A, B, and C, for isothermal operation T = T0, and for no pressure drop, P = P0(P = 1), the concentrations are

4. Combine: The rate law in terms of molar flow rates is
combining all
5. Evaluate:
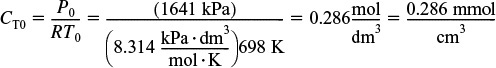
When using Polymath or another ODE solver, one does not have to actually combine the mole balances, rate laws, and stoichiometry, as was done in the Combine step previously in Chapter 5. The ODE solver will do that for you. Thanks, ODE solver! The Polymath program and output are shown in Table E6-1.1 and Figure E6-1.1. Note that explicit Equation #6 in the Polymath program calculates the reaction-rate constant k at the specified temperature of 425°C (i.e., 698 K).


TABLE E6-1.1 POLYMATH PROGRAM
Analysis: This gas-phase reaction in a PFR example could just as easily have been solved using conversion as a basis. However, membrane reactors and multiple reactions cannot be solved using conversion. You will note we just wrote out the equations in Steps 1 through 5 of our reaction algorithm (Table 6-2) and then typed them directly into our ODE solver, Polymath, to obtain the molar flow rate profiles shown in Figure E6-1.1. Notice the profiles change rapidly near the reactor entrance and then there is very little change after 6×10⁻⁶ dm3 down the reactor. Other interesting variables you will want to plot when you download this program from the Living Example Problem (i.e., LEP) file are the total molar flow rate, FT, the concentrations of the reacting species, CA, CB, and CC (for CB and CC you will need to type in two additional equations), and the rates –rA, rB and rC.
6.4 Membrane Reactors
Membrane reactors can be used to increase conversion when the reaction is thermodynamically limited, as well as to increase the selectivity when multiple reactions are occurring. Thermodynamically limited reactions are reactions where the equilibrium lies far to the left (i.e., reactant side) and as a result there is little conversion. If the reaction is exothermic, increasing the temperature will only drive the reaction further to the left, and decreasing the temperature will result in a reaction rate so slow that there is very little conversion. If the reaction is endothermic, increasing the temperature will move the reaction to the right to favor a higher conversion; however, for many reactions these higher temperatures cause the catalyst to become deactivated.
The term membrane reactor describes a number of different types of reactor configurations that contain a membrane. The membrane can either provide a barrier to certain components while being permeable to others, prevent certain components such as particulates from contacting the catalyst, or contain reactive sites and be a catalyst in itself. Like reactive distillation, the membrane reactor is another technique for driving reversible reactions to the right toward completion in order to achieve very high conversions. These high conversions can be achieved by having one of the reaction products diffuse out through a semipermeable membrane surrounding the reacting mixture. As a result, the reverse reaction will not be able to take place, and the reaction will continue to proceed to the right toward completion.
By having one of the products pass through the membrane, we drive the reaction toward completion.
Two of the main types of catalytic membrane reactors are shown in Figure 6-3. The reactor in Figure 6-3(b) is called an inert membrane reactor with catalyst pellets on the feed side (IMRCF). Here, the membrane is inert and serves as a barrier to the reactants and some of the products. The reactor in Figure 6-3(c) is a catalytic membrane reactor (CMR). The catalyst is deposited directly on the membrane, and only specific reaction products are able to exit the permeate side. As an example, consider the reversible reaction where

H2 diffuses through the membrane, while C6H6 does not.
the hydrogen molecule is small enough to diffuse through the small pores of the membrane, while C6H12 and C6H6 cannot. Consequently, the reaction continues to proceed to the right even for a small value of the equilibrium constant.

Figure 6-3 Membrane reactors. (a) Photo of ceramic reactors, (b) cross section of IMRCF, (c) cross section of CMR, (d) schematic of IMRCF for mole balance. (Photo courtesy of Golden Technologies Company, Inc.)
Hydrogen, species B, flows out through the sides of the reactor as it flows down the reactor with the other products that cannot leave until they exit the reactor.
In analyzing membrane reactors, we only need to make a small change to the algorithm shown in Figure 6-1. We shall choose the reactor volume rather than catalyst weight as our independent variable for this example. The catalyst weight, W, and reactor volume, V, are easily related through the bulk catalyst density, ρb (i.e., W = ρbV). The mole balances on the chemical species that stay within the reactor, namely A and C, are shown in Figure 6-3(d).

The mole balance on C is carried out in an identical manner to A, and the resulting equation is
However, the mole balance on B (H2) must be modified because hydrogen leaves through both the sides of the reactor and at the end of the reactor.
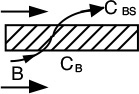
First, we shall perform mole balances on the volume element ΔV shown in Figure 6-3(d). The mole balance on hydrogen (B) is over a differential volume ΔV shown in Figure 6-3(d) and it yields
Balance on B in the catalytic bed:

Now there are two “OUT” terms for species B.
where RB is the molar rate of B leaving through the sides of the reactor per unit volume of reactor (mol/m3·s). Dividing by ΔV and taking the limit as ΔV → 0 gives
The rate of transport of B out through the membrane RB is the product of the molar flux of B normal to the membrane, WB (mol/m2/s), and the surface area per unit volume of reactor, a(m2/m3). The molar flux of B, WB in (mol/m2/s) out through the sides of the reactor is the product of the mass transfer coefficient, ![]() (m/s), and the concentration driving force across the membrane.
(m/s), and the concentration driving force across the membrane.
Here, ![]() is the overall mass transfer coefficient in m/s and CBS is the concentration of B in the sweep gas channel (mol/m3). The overall mass transfer coefficient accounts for all resistances to transport: the tube-side resistance of the membrane, the membrane itself, and on the shell-(sweep gas) side resistance. Further elaboration of the mass transfer coefficient and its correlations can be found in the literature and in Chapter 14. In general, this coefficient can be a function of the membrane and fluid properties, the fluid velocity, and the tube diameters.
is the overall mass transfer coefficient in m/s and CBS is the concentration of B in the sweep gas channel (mol/m3). The overall mass transfer coefficient accounts for all resistances to transport: the tube-side resistance of the membrane, the membrane itself, and on the shell-(sweep gas) side resistance. Further elaboration of the mass transfer coefficient and its correlations can be found in the literature and in Chapter 14. In general, this coefficient can be a function of the membrane and fluid properties, the fluid velocity, and the tube diameters.
To obtain the rate of removal of B per unit volume of reactor, RB (mol/m3/s), we need to multiply the flux through the membrane, WB(mol/m2·s), by the membrane surface area per volume of reactor, a(m2/m3); that is
The membrane surface area per unit volume of reactor is
Letting ![]() a and assuming the concentration in the sweep gas is essentially zero (i.e., CBS ≈ 0), we obtain
a and assuming the concentration in the sweep gas is essentially zero (i.e., CBS ≈ 0), we obtain
Rate of B out through the sides.
where the units of kC are s–1.
More detailed modeling of the transport and reaction steps in membrane reactors is beyond the scope of this text but can be found in Membrane Reactor Technology.3 The salient features, however, can be illustrated by the following example. When analyzing membrane reactors, we must use molar flow rates because expressing the molar flow rate of B in terms of conversion will not account for the amount of B that has left the reactor through the sides.
3 R. Govind and N. Itoh, eds., Membrane Reactor Technology, AIChE Symposium Series 85, no. 268 (1989). T. Sun and S. Khang, Ind. Eng. Chem. Res., 27, 1136 (1988).
According to the DOE, 10 trillion Btu/yr could be saved by using membrane reactors.
According to the Department of Energy (DOE), an energy saving of 10 trillion Btu per year could result from the use of catalytic membrane reactors as replacements for conventional reactors for dehydrogenation reactions such as the dehydrogenation of ethylbenzene to styrene

The dehydrogenation of propane is another reaction that has proven successful with a membrane reactor.4
4 J. Membrane Sci., 77, 221 (1993).
All the preceding elementary dehydrogenation reactions described above can be represented symbolically as
and will take place on the catalyst side of an IMRCF. The equilibrium constant for this reaction is quite small at 227°C (e.g., KC = 0.05 mol/dm3). The membrane is permeable to B (e.g., H2) but not to A and C. Pure gaseous A enters the reactor at 8.2 atm and 227°C (CT0 = 0.2 mol/dm3) at a molar flow rate of 10 mol/min.
The rate of diffusion of B out of the reactor per unit volume of reactor, RB, is proportional to the concentration of B (i.e., RB = kCCB).
(a) Perform differential mole balances on A, B, and C to arrive at a set of coupled differential equations to solve.
(b) Plot and analyze the molar flow rates of each species as a function of reactor volume.
(c) Calculate the conversion of A at V = 500 dm3.
Additional information: Even though this reaction is a gas–solid catalytic reaction, we will use the bulk catalyst density in order to write our balances in terms of reactor volume rather than catalyst weight (recall ![]() ). For the bulk catalyst density of ρb = 1.5 g/cm3 and a 2-cm inside-diameter tube containing the catalyst pellets, the specific reaction rate, k, and the transport coefficient, kC, are k = 0.7 min–1 and kC = 0.2 min–1, respectively.
). For the bulk catalyst density of ρb = 1.5 g/cm3 and a 2-cm inside-diameter tube containing the catalyst pellets, the specific reaction rate, k, and the transport coefficient, kC, are k = 0.7 min–1 and kC = 0.2 min–1, respectively.
Solution
We shall choose reactor volume rather than catalyst weight as our independent variable for this example. The catalyst weight, W, and reactor volume, V, are easily related through the bulk catalyst density, ρb, (i.e., W = ρbV). First, we shall perform mole balances on the volume element ΔV shown in Figure 6-3(d).
1. Mole balances:
Balance on A in the catalytic bed

Mole balance on each and every species
Dividing by ΔV and taking the limit as ΔV → 0 gives

Balance on B in the catalytic bed
The balance on B is given by Equation (6-3)
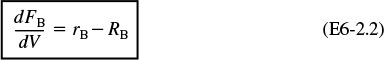
where RB is the molar flow of B out through the membrane per unit volume of the reactor.
The mole balance on C is carried out in an identical manner to A, and the resulting equation is

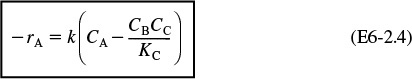
2. Rates:
Rate Law
Relative Rates
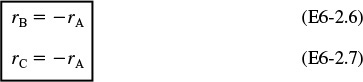
3. Transport out of the reactor: We apply Equation (6-5) for the case in which the concentration of B of the sweep side is zero, CBS = 0, to obtain
where kC is a transport coefficient. In this example, we shall assume that the resistance to species B out of the membrane is a constant and, consequently, kC is a constant.
4. Stoichiometry: Recalling Equation (4-17) for the case of constant temperature and pressure, we have for isothermal operation, T = T0, and no pressure drop, P = P0, (i.e., p = 1).
5. Combining and summarizing:
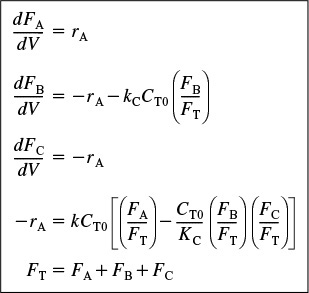
Summary of equations describing flow and reaction in a membrane reactor
6. Parameter evaluation:

7. Numerical solution: Equations (E6-2.1) through (E6-2.11) were solved using Polymath and MATLAB, another ODE solver. The profiles of the molar flow rates are shown here. Table E6-2.1 shows the Polymath programs, and Figure E6-2.1 shows the results of the numerical solution for the entering conditions.
V = 0: FA = FA0, FB = 0, FC = 0
Information on how to obtain and download the Polymath software can be found in Appendix E.


We note that FB goes through a maximum as a result of the competition between the rate of B being formed from A and the rate of B being removed through the sides of the reactor.
(c) From Figure E6-2.1, we see that the exit molar flow rate of A at 500 dm3 is 4 mol/min, for which the corresponding conversion is
Analysis: The molar flow rate of A drops rapidly until about 100 dm3, where the reaction approaches equilibrium. At this point the reaction will only proceed to the right at the rate at which B is removed through the sides of the membrane, as noted by the similar slopes of FA and FB in this plot. You will want to use Problem 6-2A(b) to show that if B is removed rapidly, FB will close to zero and the reaction behaves as if it is irreversible, and that if B is removed slowly, FB will be large throughout the reactor and the rate of reaction, –rA, will be small.
Use of Membrane Reactors to Enhance Selectivity. In addition to species leaving through the sides of the membrane reactor, species can also be fed to the reactor through the sides of the membrane. For example, for the reaction
A + B → C + D
species A will be fed only to the entrance, and species B will be fed only through the membrane as shown here.
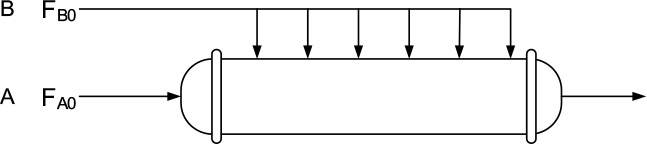
As we will see in Chapter 8, this arrangement is often used to improve selectivity when multiple reactions take place. Here, B is usually fed uniformly through the membrane along the length of the reactor. The balance on B is
where RB = FB0/Vt with FB0, representing the total molar feed rate of B through the sides and Vt the total reactor volume. The feed rate of B can be controlled by controlling the pressure drop across the reactor membrane.5 This arrangement will keep the concentration of A high and the concentration of B low to maximize the selectivity given by Equation (E8-2.2) for the reactions given in Section 8.6, e.g., Example 8-8.
5 The velocity of B through the membrane, UB, is given by Darcy’s law
UB = K(Ps – Pr)
where K is the membrane permeability, Ps is the shell-side pressure, and Pr the reactorside pressure
where, as before, a is the membrane surface area per unit volume, CB0 is the entering concentration of B, and Vt is the total reactor volume.
6.5 Unsteady-State Operation of Stirred Reactors
In Chapter 5 we discussed the unsteady operation of one type of reactor, the batch reactor. In this section, we discuss two other aspects of unsteady operation: startup of a CSTR and of semibatch reactors. First, the startup of a CSTR is examined to determine the time necessary to reach steady-state operation (see Figure 6-4(a)), and then semibatch reactors are discussed. In each of these cases, we are interested in predicting the concentration and conversion as a function of time. Closed-form analytical solutions to the differential equations arising from the mole balance of these reaction types can be obtained only for zero- and first-order reactions. ODE solvers must be used for other reaction orders.
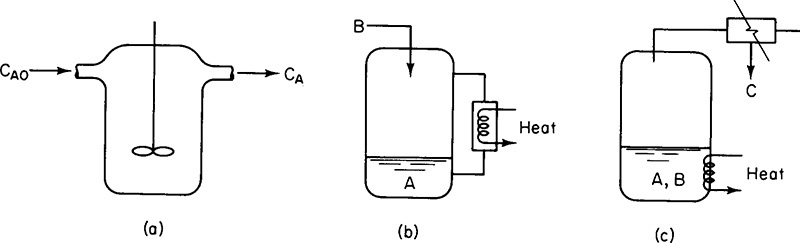
Figure 6-4 Semibatch reactors: (a) CSTR startup, (b) semibatch with cooling, and (c) reactive distillation. (Excerpted by special permission from Chem. Eng., 63 (10) 211 (Oct. 1956). Copyright © 1956 by McGraw-Hill, Inc., New York, NY 10020.)
An unsteady-state analysis can be used to determine the startup time for a CSTR (Figure 6-4(a)) and this analysis is given in the Expanded Material for Chapter 6 on the CRE Web site. Here, we show the time to steady state for a first-order reaction is approximately
For most first-order systems, the time to reach steady state is 3 to 4 space times.
There are two basic types of semibatch operations. In one type, one of the reactants in the reaction
A + B → C + D
(e.g., B) is slowly fed to a reactor containing the other reactant (e.g., A), which has already been charged to a reactor such as that shown in Figure 6-4(b). This type of reactor is generally used when unwanted side reactions occur at high concentrations of B (see Section 8.1) or when the reaction is highly exothermic (Chapter 11). In some reactions, the reactant B is a gas and is bubbled continuously through liquid reactant A. Examples of reactions used in this type of semibatch reactor operation include ammonolysis, chlorination, and hydrolysis. The other type of semibatch reactor is reactive distillation and is shown schematically in Figure 6-4(c). Here, reactants A and B are charged simultaneously and one of the products vaporizes and is withdrawn continuously. Removal of one of the products in this manner (e.g., C) shifts the equilibrium toward the right, increasing the final conversion above that which would be achieved had C not been removed. In addition, removal of one of the products further concentrates the reactant, thereby producing an increased rate of reaction and decreased processing time. This type of reaction operation is called reactive distillation. Examples of reactions carried out in this type of reactor include acetylation reactions and esterification reactions in which water is removed.
6.6 Semibatch Reactors
6.6.1 Motivation for Using a Semibatch Reactor
One of the best reasons to use semibatch reactors is to enhance selectivity in liquid-phase reactions. For example, consider the following two simultaneous reactions. One reaction produces the desired product D
with the rate law
and the other reaction produces an undesired product U
with the rate law
The instantaneous selectivity SD/U is the ratio of these two rates

We want SD/U as large as possible.
and guides us in how to produce the most amount of our desired product and the least amount of our undesired product (see Section 8.1). We see from the instantaneous selectivity that we can increase the formation of D and decrease the formation of U by keeping the concentration of A high and the concentration of B low. This result can be achieved through the use of the semibatch reactor, which is charged with pure A and to which B is fed slowly to A in the vat.
6.6.2 Semibatch Reactor Mole Balances
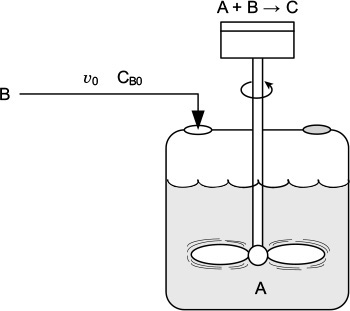
Of the two types of semibatch reactors, we focus attention primarily on the one with constant molar feed. A schematic diagram of this semibatch reactor is shown in Figure 6-5. We shall consider the elementary liquid-phase reaction
A + B → C
in which reactant B is slowly added to a well-mixed vat containing reactant A. A mole balance on species A yields

Mole balance on species A
Three variables can be used to formulate and solve semibatch reactor problems: the concentrations, Cj, the number of moles, Nj, and the conversion, X.
We shall use concentration as our preferred variable, leaving the analysis of semibatch reactors using the number of moles, Nj, and conversion X to the CRE Web site Summary Notes and Professional Reference Shelf for Chapter 6.
Recalling that the number of moles of A, NA, is just the product of the concentration of A, CA, and the volume, V, [i.e., (NA = CAV)], we can rewrite Equation (6-16) as
We note that since the reactor is being filled, the volume, V, varies with time. The reactor volume at any time t can be found from an overall mass balance of all species. The mass flow rate into the reactor, ![]() , is just the product of the liquid density, ρ0, and volumetric flow rate υ0. The mass of liquid inside the reactor, m, is just the product of the liquid density ρ and the volume of liquid V in the reactor, i.e., m = ρV. There is no mass flow out and no generation of mass.
, is just the product of the liquid density, ρ0, and volumetric flow rate υ0. The mass of liquid inside the reactor, m, is just the product of the liquid density ρ and the volume of liquid V in the reactor, i.e., m = ρV. There is no mass flow out and no generation of mass.
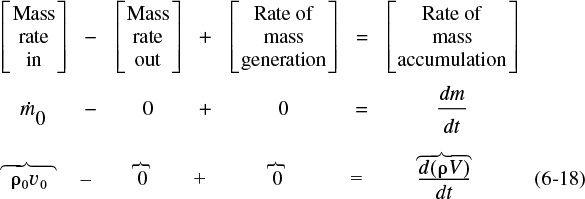
Overall mass balance
For a constant-density system, ρ0 = ρ, and
with the initial condition V = V0 at t = 0, integrating for the case of constant volumetric flow rate υ0 yields
Semibatch reactor volume as a function of time
Substituting Equation (6-19) into the right-hand side of Equation (6-17) and rearranging gives us
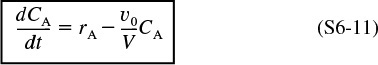
The balance on A, seen in Equation (6-17), can be rewritten as
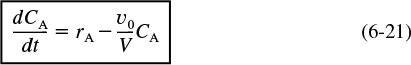
Mole balance on A
A mole balance on B that is fed to the reactor at a rate FB0 is

Rearranging gives
Substituting for NB in terms of concentration and reactor volume (NB = CBV), differentiating, and then using Equation (6-19) to substitute for (dV/dt), and FB0 = CB0 υ0, the mole balance on B given in Equation (6-23) becomes
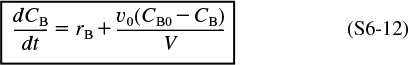
Rearranging gives
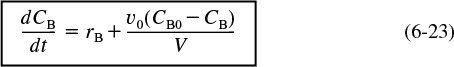
Mole balance on B
Similarly, for species C we have
Combining Equations (6-24) and (6-25) and rearranging we obtain
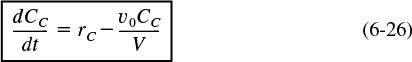
Mole balance on C
Following the same procedure for species D
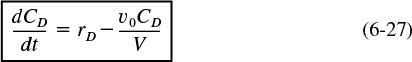
Mole balance on D
At time t = 0, the initial concentrations of B, C, and D in the vat are zero, CBi = CCi = CDi = 0. The concentration of B in the feed is CB0. If the reaction order is other than zero- or first-order, or if the reaction is nonisothermal, we must use numerical techniques to determine the concentrations and conversion as a function of time. Equations (6-21), (6-23), (6-26), and (6-27) are easily solved with an ODE solver.
Example 6–3 Isothermal Semibatch Reactor with Second-Order Reaction
The production of methyl bromide is an irreversible liquid-phase reaction that follows an elementary rate law. The reaction
CNBr + CH3NH2 → CH3Br + NCNH2
is carried out isothermally in a semibatch reactor. An aqueous solution of methyl amine (B) at a concentration of 0.025 mol/dm3 is to be fed at a volumetric rate of 0.05 dm3/s to an aqueous solution of bromine cyanide (A) contained in a glass-lined reactor. The initial volume of liquid in the vat is to be 5 dm3 with a bromine-cyanide concentration of 0.05 mol/dm3. The specific reaction rate constant is
k = 2.2 dm3/s · mol
Solve for the concentrations of bromine cyanide (A), methyl amine (B), methyl bromide (C), and cyanamide (D), and the rate of reaction as a function of time, and then analyze your results.
Solution
Symbolically, we write the reaction as
A + B → C + D
1. Mole Balances:
Mole Balance on every species
2. Rates:
(a) Rate Law (Elementary)
(b) Relative Rates
Rates Law Relative
3. Combine:
Before going to the stoichiometry step, normally Step 3, let’s combine the mole balances from Equations (6-21), (6-23), (6-26), and (6-27), the rate law Equation (E6-3.1), and the relative rates Equation (E6-3.2), to arrive at the following forms of the mole balances on A, B, C, and D solely in terms of concentrations
Combined mole balances and rate laws on A, B, C, and D
4. Stoichiometry:
The volume of liquid in the reactor at any time t is
These coupled equations are easily solved with an ODE solver such as Polymath.
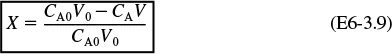
We could also calculate the conversion of A:
Substituting for NA0 and NA
5. Evaluate:
The initial conditions are t = 0, CA0 = 0.05 mol/dm3, CB = CC, = CD = 0, and V0 = 5 dm3.
Equations (E6-3.2) through (E6-3.9) are easily solved with the aid of an ODE solver such as Polymath (Table E6-3.1).
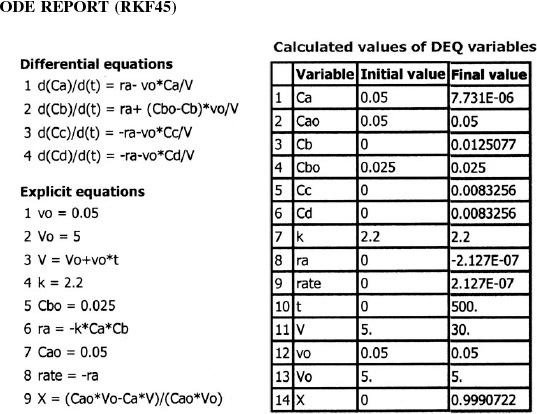

The concentrations of bromine cyanide (A), methyl amine (B), and methyl bromide (C) are shown as a function of time in Figure E6-3.1, and the rate is shown in Figure E6-3.2.
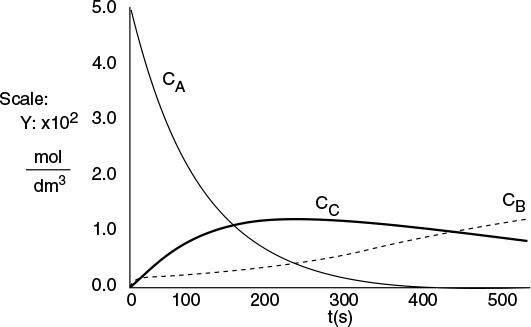
Why does the concentration of CH3Br (C) go through a maximum wrt time?
We note that the concentration of methyl bromide (C), which is identical to the concentration of cynanamide (D) goes through a maximum. The maximum occurs because once all of A has been consumed, then no more C will be formed and the continual flow of B into the reactor will thus dilute the moles of C produced and hence the concentration of C.

Analysis: Let’s look at the trends. The concentration of A falls close to zero at about 250 seconds, as does the reaction rate. Consequently, very little C and D are formed after this time, and what has been formed begins to be diluted as B continues to be added to the reactor and stops just before it overflows. Now what do you think of the time to carry out this reaction? It’s about 5 minutes, hardly enough time to turn the valves on and off. Take-away lessons: While this example showed how to analyze a semibatch reactor, you would not use a semibatch reactor to carry out this reaction at this temperature because the times are too short. Instead, you would use a tubular reactor with B fed through the sides or a number of CSTRs in series with A fed to the first reactor and small amounts of B fed to each of the following reactors. We will discuss this further in Chapter. 8.
Equilibrium Conversion. For reversible reactions carried out in a semibatch reactor, the maximum attainable conversion (i.e., the equilibrium conversion) will change as the reaction proceeds because more reactant is continuously added to the reactor. This addition shifts the equilibrium continually to the right toward more product.
An outline of what is given on the CRE Web site follows:
At Equilibrium
Using the number of moles in terms of conversion

Substituting
Solving for Xe
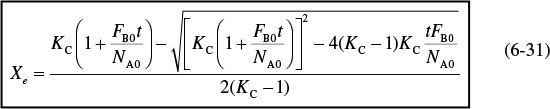
One notes the equilibrium conversion, Xe, changes with time. Further discussion on this point and calculation of the equilibrium conversion can be found in Professional Reference Shelf R6.1, in the example problem on the CRE Web site.
Closure. Chapters 5 and 6 present the heart of chemical reaction engineering for isothermal reactors. After completing these chapters, the reader should be able to apply the algorithm building blocks
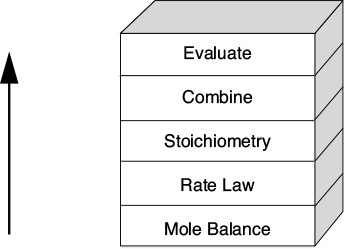
The CRE algorithm
to any of the reactors discussed in this chapter: batch reactor, CSTR, PFR, PBR, membrane reactor, and semibatch reactor. The reader should be able to account for pressure drop and describe the effects of the system variables. The reader should also be able to use either conversions (Chapter 5) or concentration and molar flow rates (Chapter 6) to solve chemical reaction engineering problems.
When using measures other than conversion for reactor design, the mole balances are written for each species in the reacting mixture:
Mole balances on each and every species
The mole balances are then coupled through their relative rates of reaction. If
Rate Law
for aA + bB → cC + dD, then
Relative Rates
Concentration can also be expressed in terms of the number of moles (batch) and in terms of molar flow rates).
Stoichiometry

2. For membrane reactors, the mole balances for the reaction
when reactant A and product C do not diffuse out the membrane
Mole Balance
with
Tansport Law
and kc is the overall mass transfer coefficient.
3. For semibatch reactors, reactant B is fed continuously to a vat initially containing only A
Mole Balances
ODE Solver Algorithm
When using an ordinary differential equation (ODE) solver such as Polymath or MATLAB, it is usually easier to leave the mole balances, rate laws, and concentrations as separate equations, rather than combining them into a single equation as we did to obtain an analytical solution. Writing the equations separately leaves it to the computer to combine them and produce a solution. The formulations for a packedbed reactor with pressure drop and a semibatch reactor are given below for two elementary reactions carried out isothermally.
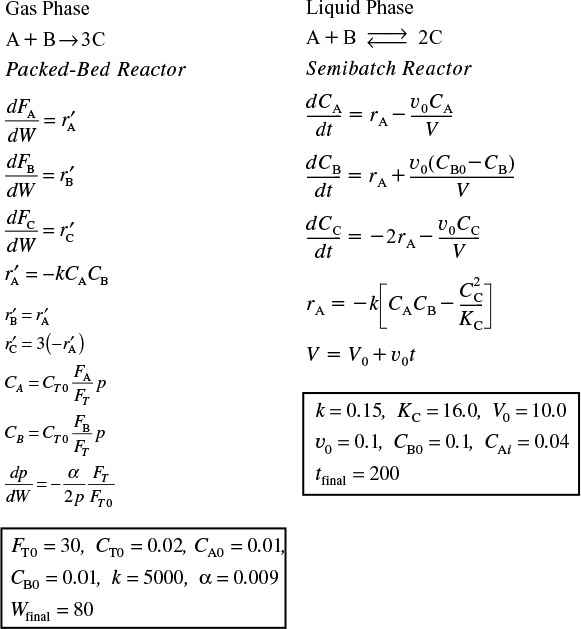
The Polymath solutions to the above equations are given on the CRE Web site in the Chapter 6 Summary Notes under “Link” PBR ODE Solver.
1. Start-Up of a CSTR
2. Puzzle Problem “What’s Wrong with this Solution?”
3. Additional Homework Problems
• Learning Resources
1. Summary Notes
2. Modules and Games
A. Wetlands Web Module
B. Tic-Tac Interactive Game
• Living Example Problems
Example 6-1 Gas-Phase Reaction in Microreactor—Molar Flow Rate
Example 6-2 Membrane Reactor
Example 6-3 Isothermal Semibatch Reactor
• Professional Reference Shelf
R6.1. Unsteady CSTRs and Semibatch Reactors
R6.1A Startup of a CSTR
R6.1B Semibatch Reactor Balances in Terms of Number of Moles
R6.1C Semibatch Reactor Balance in Terms of Conversion
R6.1D Equilibrium Conv ersion
R6.2. The Practical Side
A number of practical guidelines for operating chemical reactors are given.
R6.3. Aerosol Reactors
Aerosol reactors are used to synthesize nano-size particles. Owing to their size, shape, and high specific surface area, nanoparticles can be used in a number of applications such as pigments in cosmetics, membranes, photocatalytic reactors, catalysts and ceramics, and catalytic reactors.
We use the production of aluminum particles as an example of an aerosol plug-flow reactor (APFR) operation. A stream of argon gas saturated with Al vapor is cooled.
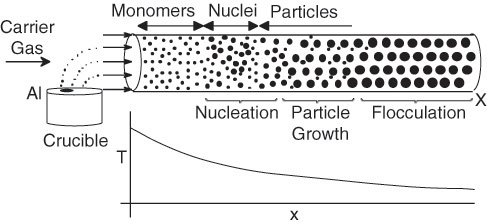
Aerosol reactor and temperature profile.
As the gas is cooled, it becomes supersaturated, leading to the nucleation of particles. This nucleation is a result of molecules colliding and agglomerating until a critical nucleus size is reached and a particle is formed. As these particles move down the reactor, the supersaturated gas molecules condense on the particles, causing them to grow in size and then to flocculate. In the development on the CRE Web site in the Web Modules category, we will model the formation and growth of aluminum nanoparticles in an AFPR.
Questions and Problems
The subscript to each of the problem numbers indicates the level of difficulty: A, least difficult; D, most difficult.

In each of the following questions and problems, rather than just drawing a box around your answer, write a sentence or two describing how you solved the problem, the assumptions you made, the reasonableness of your answer, what you learned, and any other facts that you want to include. You may wish to refer to W. Strunk and E. B. White, The Elements of Style, 4th ed. (New York: Macmillan, 2000) and Joseph M. Williams, Style: Ten Lessons in Clarity & Grace, 6th ed. (Glenview, IL: Scott, Foresman, 1999) to enhance the quality of your sentences. See the preface for additional generic parts (x), (y), and (z) to the home problems.
Before solving the problems, state or sketch qualitatively the expected results or trends.
Questions
Q6-1A Read through all the problems at the end of this chapter. Make up and solve an original problem based on the material in this chapter. (a) Use real data and reactions for further instructions. (b) Make up a reaction and data. (c) Use an example from everyday life (e.g., cooking spaghetti; see P5-1A).
Problems
P6-1B What if... you were asked to explore the example problems in this chapter to learn the effects of varying the different parameters? This sensitivity analysis can be carried out by downloading the examples from the CRE Web site. For each of the example problems you investigate, write a paragraph describing your findings.
(a) Example 6-1. Download the Living Example Problem 6-1 from the CRE Web site. (1) What would be the conversion if the pressure were doubled and the temperature were decreased by 20°C? (2) Compare Figure E6-1.1 profiles with those for a reversible reaction with KC = 0.02 mol/dm3 and describe the differences in the profiles. (3) How would your profiles change for the case of an irreversible reaction with pressure drop when αp = 99 × 103 dm–3 for each tube?
(b) Example 6-2. Download the Living Example Problem 6-2 from the CRE Web site. You might find it easiest to answer most of the following questions using Wolfram. (1) Starting with all values of KC, k, CT0, and kC in the middle range (KC = 0.25, k = 2.1, CT0 = 0.52, and kC = 1.06), vary each parameter individually and describe what you find. Note and explain any maximum or minimum values of your plots down the length (i.e., volume = 500dm3) of your reactor. Hint: Go to the extremes of the range. (2) Repeat (1) but set KC at its maximum value and then vary k and kC, and describe what you find. (3) Use Polymath to find the parameter values at which RB is a maximum and the concentrations/flow rates are at the maximum. (4) Vary ratios of parameters such as (k/kC) and (k τCA0/KC) [Note: τ = 400 min] and write a paragraph describing what you find. What ratio of parameters has the greatest effect on the conversion X = (FA0–FA0)/FA0? (5) Write a summary paragraph of all the trends and your results. (6) Make up a question/problem on membrane reactors with a solution in which Wolfram must be used to obtain the answer. Hint: See Preface Table P-4, page xxviii. Also comment on what types of questions would you ask when using Wolfram.
(c) Example 6-3. Download the Living Example Problem 6-3 from the CRE Web site. The temperature is to be lowered by 35°C so that the reaction-rate constant is now one-tenth its original value. (1) If the concentration of B is to be maintained at 0.01 mol/dm3 or below, what is the maximum feed rate of B?(2) How would your answer change if the concentration of A were tripled? (3) Redo this problem when the reaction is reversible with KC = 0.1 and compare with the irreversible case. (Only a couple of changes in the Polymath program are necessary.)
(d) Web Module on Wetlands on the CRE Web site. Download the Polymath program and vary a number of parameters such as rainfall, evaporation rate, atrazine concentration, and liquid flow rate, and write a paragraph describing what you find. This topic is a hot Ch.E. research area.
(e) Web Module on Aerosol Reactors on the CRE Web site. Download the Polymath program and (1) vary the parameters, such as cooling rate and flow rate, and describe their effect on each of the regimes: nucleation, growth, and flocculation. Write a paragraph describing what you find. (2) It is proposed to replace the carrier gas by helium.
(i) Compare your plots (He versus Ar) of the number of Al particles as a function of time. Explain the shape of the plots.
(ii) How does the final value of dp compare with that when the carrier gas was argon? Explain.
(iii) Compare the time at which the rate of nucleation reaches a peak in the two cases (carrier gas = Ar and He). Discuss the comparison.
Data for a He molecule: mass = 6.64×10⁻²⁷ kg, volume = 1.33×10⁻²⁹ m3, surface area = 2.72 × 10⁻¹⁹m2, bulk density = 0.164 kg/m3, at normal temperature (25°C) and pressure (1 atm).
(f) The Work Self-Tests on the Web. Write a question for this problem that involves critical thinking and explain why it involves critical thinking. See examples on the CRE Web site, Summary Notes for Chapter 6.
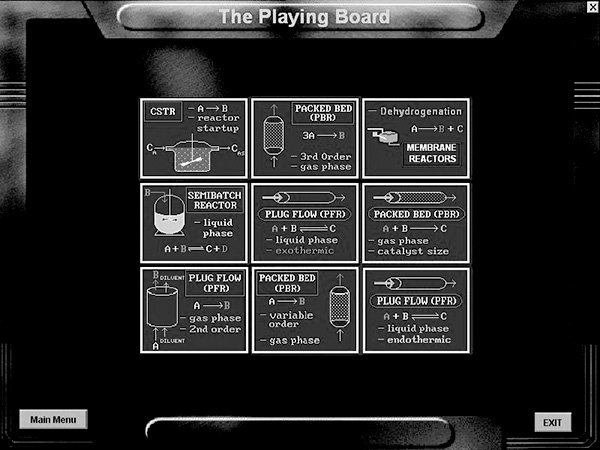
P6-2B Download the Interactive Computer Games (ICG) from the CRE Web site. Play the game and then record your performance number, which indicates your mastery of the material. Your instructor has the key to decode your performance number. Knowledge of all sections is necessary to pit your wit against the computer adversary in playing a game of Tic-Tac-Toe.
Performance number: _________________________
P6-3C The second-order liquid phase reaction
is carried out in a batch reactor at 35°C. The specific reaction-rate constant is 0.0445 dm3/mol/min. Reactor 1 is charged with 1,000 dm3, where the concentration of each reactant after mixing is 2M.
(a) What is the conversion after 10, 50, and 100 minutes?
Now, consider the case when, after filling reactor 1, the drain at the bottom of reactor 1 is left open and it drains into reactor 2, mounted below it, at a volumetric rate of 10 dm3/min.

(b) What will be the conversion and concentration of each species in reactor 1 after 10, 50, and 80 minutes in the reactor that is being drained? (Ans.: At t = 10 min then X = 0.47)
(c) What is the conversion and concentration of each species in reactor 2 that is filling up with the liquid from reactor 1 after 10 and after 50 minutes? (Ans.: At t = 50 min then X = 0.82)
(d) At the end of 50 minutes, the contents of the two reactors are added together. What is the overall conversion after mixing?
(e) Apply one or more of the six ideas in Preface Table P-4, page xxviii, to this problem.
P6-4B The elementary gas-phase reaction
(CH3)3COOC(CH3)3 → C2H6 + 2CH3COCH3
A → B + 2C
is carried out isothermally at 400 K in a flow reactor with no pressure drop. The specific reaction rate at 50°C is 10–4 min–1 (from pericosity data) and the activation energy is 85 kJ/mol. Pure di-tert-butyl peroxide enters the reactor at 10 atm and 127°C and a molar flow rate of 2.5 mol/min, i.e., FA = 2.5 mol/min.
(a) Use the algorithm for molar flow rates to formulate and solve the problem. Plot FA, FB, FC, and then X as a function of plug-flow reactor volume and space time to achieve 90% conversion.
(b) Calculate the plug-flow volume and space time for a CSTR for 90% conversion.
P6-5B For the reaction and data in P6-4B, we now consider the case when the reaction is reversible with KC = 0.025 dm6/mol2 and the reaction is carried out at 300 K in a membrane reactor where C2H6 is diffusing out. The membrane transport coefficient is kC = 0.08 s–1.
(a) What is the equilibrium conversion and what is the exit conversion in a conventional PFR? (Ans.: Xeq = 0.52, X = 0.47)
(b) Plot and analyze the conversion and molar flow rates in the membrane reactor as a function of reactor volume up to the point where 80% conversion of di-tert-butyl peroxide is achieved. Note any maxima in the flow rates.
(c) Apply one or more of the six ideas in Preface Table P-4, page xxviii, to this problem.
P6-6C (Membrane reactor) The first-order, gas-phase, reversible reaction
is taking place in a membrane reactor. Pure A enters the reactor, and B diffuses out through the membrane. Unfortunately, a small amount of the reactant A also diffuses through the membrane.
(a) Plot and analyze the flow rates of A, B, and C and the conversion X down the reactor, as well as the flow rates of A and B through the membrane.
(b) Next, compare the conversion profiles in a conventional PFR with those of a membrane reactor from part (a). What generalizations can you make?
(c) Would the conversion of A be greater or smaller if C were diffusing out instead of B?
(d) Discuss qualitatively how your curves would change if the temperature were increased significantly or decreased significantly for an exothermic reaction. Repeat the discussion for an endothermic reaction.
Additional information:
k = 10 min–1
KC = 0.01 mol2/dm6
kCA = 1 min–1
kCB = 40 min–1
FA0 = 100 mol/min
υ0 = 100 dm3/min
Vreactor = 20 dm3
P6-7B Fuel Cells Rationale. With the focus on alternative clean-energy sources, we are moving toward an increased use of fuel cells to operate appliances ranging from computers to automobiles. For example, the hydrogen/oxygen fuel cell produces clean energy as the products are water and electricity, which may lead to a hydrogen-based economy instead of a petroleum-based economy.
A large component in the processing train for fuel cells is the water-gas shift membrane reactor. (M. Gummala, N. Gupla, B. Olsomer, and Z. Dardas, Paper 103c, 2003, AIChE National Meeting, New Orleans, LA.)

Here, CO and water are fed to the membrane reactor containing the catalyst. Hydrogen can diffuse out the sides of the membrane, while CO, H2O, and CO2 cannot. Based on the following information, plot the concentrations and molar flow rates of each of the reacting species down the length of the membrane reactor. Assume the following: The volumetric feed is 10 dm3/min at 10 atm, and the equimolar feed of CO and water vapor with CT0 = 0.4 mol/dm3.
The equilibrium constant is Ke = 1.44, with k = 1.37 dm6/mol kg-cat · min, and the mass transfer coefficient kH2 = 0.1 dm3/kg-cat · min (Hint: First calculate the entering molar flow rate of CO and then relate FA and X.)
(a) What is the membrane reactor volume necessary to achieve 85% conversion of CO?
(b) Sophia wants you to compare the MR with a conventional PFR. What will you tell her?
(c) For that same membrane reactor volume, Nicolas wants to know what would be the conversion of CO if the feed rate were doubled?
P6-8C The production of ethylene glycol from ethylene chlorohydrin and sodium bicarbonate
CH2OHCH2Cl + NaHCO3 → (CH2OH)2 + NaCl + CO2↑
is carried out in a semibatch reactor. A 1.5-molar solution of ethylene chlorohydrin is fed at a rate of 0.1 mole/minute to 1500 dm3 of a 0.75-molar solution of sodium bicarbonate. The reaction is elementary and carried out isothermally at 30°C where the specific reaction rate is 5.1 dm3/mol/h. Higher temperatures produce unwanted side reactions. The reactor can hold a maximum of 2500 dm3 of liquid. Assume constant density.
(a) Plot and analyze the conversion, reaction rate, concentration of reactants and products, and number of moles of glycol formed as a function of time.
(b) Suppose you could vary the flow rate between 0.01 and 200 mol/min. What flow rate and holding time would you choose to make the greatest number of moles of ethylene glycol in 24 hours, keeping in mind the downtimes for cleaning, filling, etc., shown in Table 5-3?
(c) Suppose the ethylene chlorohydrin is fed at a rate of 0.15 mol/min until the reactor is full and then shut in. Plot the conversion as a function of time.
(d) Discuss what you learned from this problem and what you believe to be the point of this problem.
P6-9C The following elementary reaction is to be carried out in the liquid phase
The initial concentrations are 0.2 M in NaOH and 0.25 M in CH3COOC2H5 with k = 5.2 × 10⁻⁵ dm3/mol-s at 20°C with E = 42,810 J/mol. Design a set of operating conditions (e.g., υ0, T, . . .) to produce 200 mol/day of ethanol in a semibatch reactor and not operate above 37°C and below a concentration of NaOH of 0.02 molar.6 The semibatch reactor you have available is 1.5 m in diameter and 2.5 m tall. The reactor down time is (tc + te + tf) = 3h.
6 Manual of Chemical Engineering Laboratory, University of Nancy, Nancy, France, 1994 ([email protected]; www.sysbio.del/AICHE).
P6-10B Go to Professor Herz’s Reactor Lab Web site at www.reactorlab.net. From the menu at the top of the page, select Download and then click on the English version link. Provide the required information and then download, install, and open the software. Select Division D2, Lab L2 and there the labeled PFR of The Reactor Lab concerning a packed-bed reactor (labeled PFR) in which a gas with the physical properties of airflows over spherical catalyst pellets. Perform experiments here to get a feeling for how pressure drop varies with input parameters such as reactor diameter, pellet diameter, gas-flow rate, and temperature. In order to get significant pressure drop, you may need to change some of the input values substantially from those shown when you enter the lab. If you get a notice that you can’t get the desired flow, then you need to increase the inlet pressure.
P6-11B Pure butanol is to be fed into a semibatch reactor containing pure ethyl acetate to produce butyl acetate and ethanol. The reaction
is elementary and reversible. The reaction is carried out isothermally at 300 K. At this temperature, the equilibrium constant is 1.08 and the specific reaction rate is 9 × 10⁻⁵ dm3/mol·s. Initially, there is 200 dm3 of ethyl acetate in the vat, and butanol is fed at a volumetric rate of 0.05 dm3/s. The feed and initial concentrations of butanol and ethyl acetate are 10.93 mol/dm3 and 7.72 mol/dm3, respectively.
(a) Plot and analyze the equilibrium conversion of ethyl acetate as a function of time.
(b) Plot and analyze the conversion of ethyl acetate, the rate of reaction, and the concentration of butanol as a function of time.
(c) Rework part (b), assuming that ethanol evaporates (reactive distillation) as soon as it forms. (This is a graduate level question.)
(d) Use Polymath or some other ODE solver to learn the sensitivity of conversion to various combinations of parameters (e.g., vary FB0, NA0, υ0).
(e) Apply one or more of the six ideas in Preface Table P-4, page xxviii, to this problem.
(f) Write a question that requires critical thinking and then explain why your question requires critical thinking. (Hint: See Preface Section I.)
P6-12C Use the reaction data in P6-11B and the molar flow rate algorithm to carry out the following problems:
(a) Calculate the CSTR reactor volume to achieve 80% of the equilibrium conversion for an equal molar feed and for a volumetric feed of 0.05 dm3/s.
(b) Safety. Now consider the case where we want to shut down the reactor by feeding water at a volumetric rate of 0.05 dm3/s. How long will it take to reduce the rate to 1% of the rate in the CSTR under the conditions of part (a)?
P6-13C An isothermal reversible reaction ![]() is carried out in an aqueous solution. The reaction is firstorder in both directions. The forward rate constant is 0.4 h–1 and the equilibrium constant is 4.0. The feed to the plant contains 100 kg/m3 of A and enters at the rate of 12 m3/h. Reactor effluents pass to a separator, where B is completely recovered. The reactor is a stirred tank of volume 60 m3. A fraction, f1, of the unreacted effluent is recycled as a solution containing 100 kg/m3 of A and the remainder is discarded. Product B is worth $2 per kilogram and operating costs are $50 per cubic meter of solution entering the separator. What value offmaximizes the operational profit of the plant? What fraction A fed to the plant is converted at the optimum? Source: H. S. Shankar, IIT Mumbai.
is carried out in an aqueous solution. The reaction is firstorder in both directions. The forward rate constant is 0.4 h–1 and the equilibrium constant is 4.0. The feed to the plant contains 100 kg/m3 of A and enters at the rate of 12 m3/h. Reactor effluents pass to a separator, where B is completely recovered. The reactor is a stirred tank of volume 60 m3. A fraction, f1, of the unreacted effluent is recycled as a solution containing 100 kg/m3 of A and the remainder is discarded. Product B is worth $2 per kilogram and operating costs are $50 per cubic meter of solution entering the separator. What value offmaximizes the operational profit of the plant? What fraction A fed to the plant is converted at the optimum? Source: H. S. Shankar, IIT Mumbai.
Supplementary Reading
ANTHONY, MAXWELL, presidential inauguration address, “The economic future of Jofostan and the chemical reaction industry and one’s ability to deal with multiple reactions.” Riça, Jofostan, January 1, 2017.
KEILLOR, GARRISON and TIM RUSSELL, Dusty and Lefty: The Lives of the Cowboys (Audio CD). St. Paul, MN: Highbridge Audio, 2006.
FROMENT, G. F., and K. B. BISCHOFF, Chemical Reactor Analysis and Design, 2nd ed. New York: Wiley, 1990.
Recent information on reactor design can usually be found in the following journals: Chemical Engineering Science, Chemical Engineering Communications, Industrial and Engineering Chemistry Research, Canadian Journal of Chemical Engineering, Jofostan Journal of Chemical Engineering, AIChE Journal, and Chemical Engineering Progress.