
Chapter 8
Joining Processes
Amber Shrivastava1, Manuela Krones2 and Frank E. Pfefferkorn1*
1Department of Mechanical Engineering, University of Wisconsin-Madison, Madison, WI, USA
2Department of Factory Planning and Factory Management, Technische Universität Chemnitz, Chemnitz, Germany
*Corresponding author: [email protected]
Abstract
Sustainability is a relevant objective for the manufacturing industry, which means to produce goods and services in a way that is cost-effective and preserves the environment. Therefore, it is important to analyze the energy consumption of manufacturing processes and equipment. The objective of this chapter is to provide an approach for the analyses of sustainability and energy efficiency of joining processes and facilities. First of all, the concept of sustainability is explained in general and illustrated by using key performance indicators. Then, data sources are described that may be used for sustainability and energy efficiency analyses. In addition, approaches to influence the sustainability of joining equipment, joining processes, and joining facilities are discussed. The energy consumption of joining equipment is composed of base, idle, and joining energy. The parameters that influence the joining energy depend on the type of joining process. This is discussed in detail for fusion arc welding, oxy-acetylene gas welding, torch brazing, mechanical fastening, and adhesive bonding. The section on joining facilities emphasizes the indirect energy consumption that is caused by joining, for example due to air ventilation. Finally, two case studies, on submerged arc welding and friction stir welding discuss in detail the method for quantifying the amount of energy consumed during the welding process.
Keywords: Sustainability, energy efficiency, manufacturing, joining, welding, fusion welding, friction stir welding
8.1 Introduction
The concept of sustainable development was characterized by a report of the World Commission on Environment and Development in 1987, the so-called “Brundtland report” [1]. In this report, sustainable development is understood as a “development, which meets the needs of current generations without compromising the ability of future generations to meet their own needs.” This includes satisfying the basic needs for all people, which also requires economic growth. However, economic activities have led to changes in the earth’s ecosystem. In order to achieve a sustainable development, it is necessary to harmonize economic and technological processes with the exploitation of resources. Following this understanding, the realization of sustainable development is often referred to as the ‘Triple Bottom Line,’ i.e., pursuing ecological, economic, and social objectives in the right balance.
Traditionally, manufacturing is defined as a process by which resources like energy, water, and raw material are consumed and finished goods and waste products are generated. A better way to define manufacturing may be the transforming of resources to meet human needs. The worldwide demand for products is increasing, resulting in greater production, which leads to higher resource consumption. If the resources are consumed at rates higher than the rates at which they are replenished in nature, the result is fewer resources available for future use; hence, the processes cannot be considered sustainable. Also, in most cases, the waste products generated from the manufacturing process have a detrimental impact on the environment. Sustainable manufacturing is defined by the U.S. Environmental Protection Agency “as the creation of manufactured products that use processes that minimize negative environmental impacts, conserve energy and natural resources, are safe for employees, communities, and consumers and are economically sound” [2]. Therefore, goods and services should be produced in such a way that they result in net economic growth without damaging the environment or future social and economic structures.
Energy is one of the resources that is consumed during manufacturing. It is required at almost every step of a manufacturing cycle. The industrial sector has the largest share of energy consumption1 in the United States (32%), followed by the transportation sector (28%), residential sector (22%), and commercial sector (18%) [3]. In 2008, a study showed that U.S. industry has a high potential to reduce energy use by investing in economically advantageous efficiency measures. The consulting firm McKinsey identified that the primary energy consumption in the U.S. industrial sector can be reduced by 18% before 2020 as compared to the baseline in 2008 [4]. Strategies and measures to increase energy efficiency need to be discussed and made available in order to exploit these potentials. Figure 8.1(a) shows that the main energy sources used in manufacturing are natural gas, electricity, coal and coke, and other sources (e.g., steam, asphalt in the petroleum industry, etc.). This distribution is due to the variety of sectors within the manufacturing industry. Figure 8.1(b) focuses on the energy consumption in semi-final and final metal production since these sectors have a high relevance to joining processes. In these industries, the main energy sources are electricity (50%) and natural gas (48%). Whereas, natural gas is mainly utilized in thermal processes (e.g., furnaces, heat treatment, etc.), electricity is the main source for manufacturing processes (e.g., cutting, welding, forming, etc.). Therefore, it needs to be emphasized when aiming to achieve sustainable joining processes.
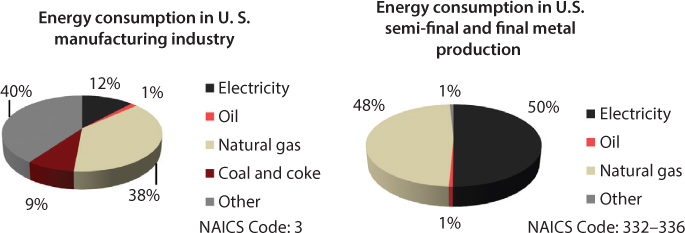
Figure 8.1 (a) Distribution of energy consumption in U. S. manufacturing industry by energy carrier, (b) Distribution of energy consumption in U.S. semi-final and final metal production by energy carrier [5].
Reducing the energy consumption in manufacturing processes can be achieved by accounting for the amount of energy required for each step of a manufacturing cycle and avoiding any wastage. Energy consumption is also reduced by opting for processes with higher energy efficiency for individual steps in a cycle. Reduction in energy consumption lowers the cost of operation and overall production cost. It also saves valuable non-renewable energy sources. This reduces negative impact to the environment from the process and conserves energy and natural resources leading to energy-efficient manufacturing.
Joining may be defined as the process of bringing two or more surfaces into intimate contact in order to establish continuity across the resulting interface. Joining processes play a prominent role in modern manufacturing since virtually all products are fabricated from multiple components/parts. Mechanical fastening methods like bolting, riveting, stapling; and adhesive bonding; fusion arc welding methods like shielded metal arc welding (SMAW), gas-tungsten arc welding (GTAW), gas-metal arc welding (GMAW), flux-core arc welding (FCAW), plasma arc welding (PAW), submerged arc welding (SAW), and electro-slag welding (ESW); focused energy beam welding methods such as laser welding and electron beam welding; gas flame welding, brazing, soldering; and solid-state welding methods like friction stir welding (FSW), friction stir spot welding (FSSW), diffusion bonding, ultrasonic welding, friction welding, explosion welding, and magnetic pulse welding, are among the most commonly used joining processes for manufacturing. All of these processes consume energy in one form or another. Pneumatic devices for mechanical fastening methods consume mechanical energy stored in air under pressure. All arc welding methods, soldering, and friction stir welding use electricity as the source of energy. Chemical energy stored in gas mixtures is consumed during gas welding processes. Welding is an enabling technology for manufacturing, construction, and mining industries that accounts for approximately one-third of the total U.S. Gross Domestic Product [6]. These industries spent $34.1 billion on welding in 2000 [6]. This chapter mainly focuses on sustainability and energy metrics for welding processes.
8.2 Sustainability in Joining
The concept of sustainability was introduced in the previous section and is now discussed considering the metrics to evaluate it. In general, the quantitative evaluation of sustainability enables comparing systems or processes, identifying potentials within systems, and confirming the usefulness of realized improvement measures.
Although sustainability regards economic, environmental, and social goals, the environmental perspective is often focused on. The metrics can be differentiated between absolute and relative indicators. Absolute indicators contain an environmental or energetic objective (e.g., consumption of electrical energy in kWh). Relative indicators set the energetic objective in relation to non-energy-related objectives. An example for a relative indicator is the specific energy consumption, which describes the ratio between energy consumption and units of production.
The main advantage of indicators is to provide information in a concentrated manner. The use of a large set of indicators may lead to decreasing clarity. Hence, effort is put into aggregating information in one indicator, such as the cumulative energy demand [7] or the carbon footprint [8]. It is important to notice that the latter indicators are – in contrast to the specific energy consumption – based on a life cycle approach. A life cycle approach helps to address the environmental impacts of a product throughout its life cycle from raw material acquisition through production, use, and disposal.
Applied to joining processes, a life cycle assessment would need to consider other related processes besides the joining process, such as the cleaning of a workpiece prior to joining or the finishing afterwards. In this context, up-stream processes refer to steps prior to production (e.g., extraction of raw material, electricity production, etc.), whereas downstream processes include subsequent steps (e.g., recycling, etc.). Possible indicators to describe the sustainability metrics of the joining process are discussed next.
Sustainability indicators are usually expressed as a ratio of energy- and non-energy-related figures in order to ensure comparability. The following energy-related objectives are applicable:
- energy consumption (e.g., electricity, gas, etc.)
- resource consumption (e.g., raw material input, etc.)
- environmental impacts (e.g., greenhouse gas emissions, etc.)
The definition of system boundaries is important when accounting for the energy or resource input into a process. On the one hand, only the energy that is needed for the actual joining process can be considered. On the other hand, it is also possible to include the energy consumption of peripheral components, such as necessary cooling systems. This aspect will be discussed in more detail in Section 8.8.
The non-energy-related objectives for joining processes can be chosen from:
- process time
- process-related parameters (e.g., wire feed speed, etc.)
- part-related parameters (e.g., weld length, etc.)
Table 8.1 shows general combinations of energy- and non-energy-related objectives in order to describe sustainability indicators for welding. The average electrical power is used to describe the power level of welding equipment in different operating states. The specific energy consumption is a common indicator for the comparison between different processes or different parameters for the same process. Furthermore, the volume-related specific energy consumption is used as a theoretical value, deduced from the heat capacity of a material, to estimate the minimum energy required for a process. Whereas the consideration of energy consumption relates to the economics of the process, the environmental view is evaluated by using the specific environmental impact. The environmental impact can be calculated by multiplying the energy consumption with the environmental impact that is caused by the up-stream processes for generating this energy (e.g., was a hydroelectric power plant or natural gas fired power plant used to generate the electricity). This indicator also allows us to aggregate effects that are caused by the use of different resources (e.g., electricity and shielding gas).
Table 8.1 Selected sustainability indicators for joining processes.
| Ratio between ↓ and→ | Process time | Weld length | Volume of molten material |
| Energy consumption | Average electrical power [W] | Specific energy consumption [J/m] | Specific energy consumption [J/mm3] |
| Environmental impact | – | Specific environmental impact [g CO2/m] | Specific environmental impact [g CO2/mm3] |
The energy consumption discussed so far only accounts for the input into the joining processes. However, this is higher than the energy input into the workpiece since there are different causes for energy losses, which are depicted in Figure 8.2.
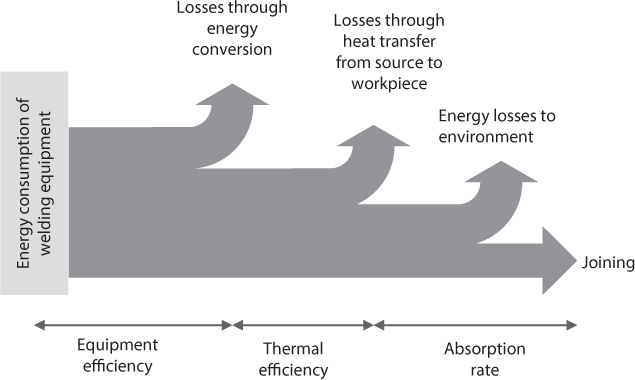
Figure 8.2 Qualitative energy flow for a joining process (adapted from [9]).
The source of energy is either electricity or gas, which needs to be converted at first (e.g., voltage transformation) within a welder. For this step, losses occur within the welding equipment. This is described by the equipment efficiency as the ratio between the generated joining energy and the consumed net energy [10]. Afterwards, the energy is transferred to the work-piece, e.g., by means of the welding arc. The thermal efficiency describes the ratio between the heat input into the workpiece and the generated joining energy. Reference values for the thermal efficiencies of different processes are given in Table 8.2. Finally, heat losses from the workpiece occur that refer to the absorption rate (e.g., heat flow into surrounding, fumes, etc.). The energy losses in these different stages can be influenced by process selection, welding equipment, process parameters, and workpiece characteristics.
Table 8.2 Reference values for thermal efficiencies of joining processes [11].
| Joining process | Thermal efficiency |
| Submerged Arc Welding (SAW) | 100 % |
| Manual Arc Welding | 80–90 % |
| Gas Metal Arc Welding (GMAW) | 70–90 % |
| Gas Tungsten Arc Welding (GTAW) | 60–70 % |
In terms of the material usage, the indicator of deposition efficiency is useful. It describes the rate of the filler material that is deposited into the weld pool [12].
8.3 Taxonomy
DIN 8580 provides a taxonomic classification for manufacturing processes, where joining processes are one category [13]. DIN 8580 classifies joining processes into further sub-categories, where the first level of sub-categorization is based on the method of cohesion between two parts. As per DIN 8580, assembling, filling, press fitting, joining by primary shaping, joining by forming, welding, soldering, gluing, and textile joining are sub-categories of joining processes. The second level of categorization depends on the type of sub-category, i.e., press joining is further classified based on the energy carrier used to create the joint. However, in this chapter, joining processes are classified into four categories: fusion welding, oxy-fuel gas welding, solid state welding, and mechanical joining methods (Figure 8.3). This categorization highlights the mechanisms and forms of energy involved during these processes.
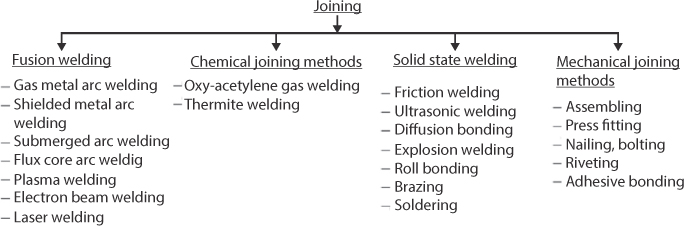
Figure 8.3 Classification of joining processes used in this chapter.
Fusion welding encompasses welding methods in which the base materials/workpieces melt and re-solidify to make the joint. Electricity is the main source of energy for these processes. Filler metals may or may not be used in fusion welding methods. In arc-welding, the required heat is obtained from electrical energy. The process involves either a consumable or a non-consumable electrode. An AC or a DC power supply produces an arc between the tip of the electrode and the workpiece to be welded. The basic components for fusion welding methods may include a welding head with wire feed mechanism incorporating a high torque DC geared motor, a power source, and a flux delivery and recovery system. In non-consumable electrode welding processes, the electrode is typically a tungsten electrode. Due to the involvement of high temperatures, an externally supplied shielding gas is necessary to prevent oxidation of the weld zone. Fusion arc welding with a non-consumable electrode is discussed as a representative process for this category in later sections.
Chemical joining methods is the group of joining processes that utilize the chemical energy of reactants to produce heat. This heat is used to melt the base materials/workpieces at the joint. For example, oxygen and acetylene react to produce heat during oxy-acetylene gas welding. The equipment for this process consists of a welding torch that is connected to high-pressure gas cylinders by hoses and equipped with pressure gauges and regulators. This process can be mechanized/automated; however, oxy-acetylene gas welding is mostly carried out manually. This makes this process relatively slow. Oxy-acetylene gas welding is discussed as a representative process for this category in later sections.
In solid state welding, the joint is created without melting the base metal. In brazing and soldering, filler metal is placed between the surfaces to be joined and the temperature is raised sufficiently to melt the filler metal but not the base metal as in the fusion welding methods. The equipment that is used for brazing varies as per the method used to heat the workpiece and melt the filler rod. For example, the heat source in torch brazing is oxy-fuel gas and the equipment is essentially the same as for oxy-fuel gas welding processes. The heat source in infrared brazing is a high intensity quartz lamp. Resistance brazing uses the heat generated by the dissipation of electrical energy due to the electrical resistance of the components and electrodes as the source of heat. Soldering uses similar filler metals as brazing and involves even lower temperatures. Brazing is discussed as a representative process for this category in later sections. The other solid state welding processes listed in Figure 8.3 use a combination of heat (without exceeding the solidus temperature), pressure, plastic deformation, and diffusion to create joints. Friction stir welding is a representative solid state welding technique that is discussed in a case study in Section 8.9.
Mechanical joining characterizes methods in which most of the energy that is consumed during the process is mechanical energy. Mechanical fastening involves using various fasteners like nuts and bolts, riveting, adhesive bonding, seaming and crimping, etc. The basic component for mechanical joining methods is a pneumatic, hydraulic, or electrical power unit and high speed feeding and dispensing mechanism. Mechanical fastening with nuts and bolts and adhesive bonding are discussed as representative processes for this category in later sections. In general, heating is not instrumental in mechanical joining methods. One exception is the creating of press fits by heating one component such that it expands enough to create a slip fit during assembly and then creates a press fit upon cooling.
8.4 Data Sources
A qualitative consideration on the sustainability of joining has been introduced in general in Section 8.2. However, more detailed analyses are necessary in order to achieve quantitative results for specific cases. A quantitative assessment can be performed by using different data sources, such as publicly available data, estimations, and measurements. Depending on the type of the data source, a forecast of energy consumption during process planning is possible.
Energy consumption estimates can be calculated by using physical parameters combined with data of the equipment manufacturer and values based on experience. As an example, the thermal energy required for a workpiece can be estimated by using the specific thermal capacity of the workpiece material. Then, the necessary input energy can be estimated from the reference values on process efficiency (Table 8.2 in Section 8.2). This approach is demonstrated for different joining processes in the later sections.
The manufacturer of welding equipment provides information about the equipment efficiency, i.e., the ratio between the welding power output and the input from the electricity supply, and the idle power. Using the parameters of the welding task, the power can be estimated. The use of further resources may be estimated based on the parameters of the welding task. For example, the geometry of the weld seam essentially defines the required amount of filler wire.
An initiative that supports estimating the energy consumption of manufacturing processes is the unit process life cycle inventory methodology that was developed within the project “Cooperative Effort on Process Emissions in Manufacturing” (CO2PE!) [14]. The goal of this initiative is to provide a worldwide life cycle inventory database on manufacturing processes in order to document and analyze, but also give guidelines on how to reduce the environmental effects that are related to these processes. This data can then be used to estimate energy use and mass losses in manufacturing [15].
A way to acquire more accurate data of a welding process is to perform measurements of the energy and resource consumption. In general, measurements can be conducted with permanently installed or portable power meters. The choice of measurement device depends on the variation of the welding process parameters that may lead to a variation in the energy consumption. In most cases, portable (field) measurements are suitable in order to analyze the process.
The main values to be measured for welding processes are the electricity consumption and the use of consumables, such as the shielding gas and the filler metal. Table 8.3 gives an overview of measuring devices.
Table 8.3 Devices for measuring the energy consumption of welding.
| Measured value | Measuring devices |
| Electricity consumption | Plug-in energy meter Current probes Power meters |
| Compressed air and gas consumption | Pressure gauges Flow counter Flow meters |
| Filler metal consumption | Spool counter Length measurement |
For measuring 1-phase welding equipment, simple plug-in energy meters can be used in order to measure the total electrical work; however, the maximum amperage for these devices is quite low and might not be enough for welding equipment. For 3-phase welding equipment, instantaneous current and instantaneous voltage can be measured over time with two different methods. For the first method, current and voltage probes can be used for the measurements. Current probes are usually clamped around an electrical conductor, i.e., around a conductor for each of the phases and voltage probes are directly connected to the 3-phase supply terminals. The product of instantaneous current and instantaneous voltage for each phase is integrated over time to provide the energy consumption per phase. Total energy consumed during the process is calculated by adding the energy consumption for all the three phases [16]. More accurate results are achieved by using a power meter. It is favorable to use power meters with a logging functionality in order to record the measured data. Figure 8.4 shows examples for different measuring devices that measure the electricity consumption.
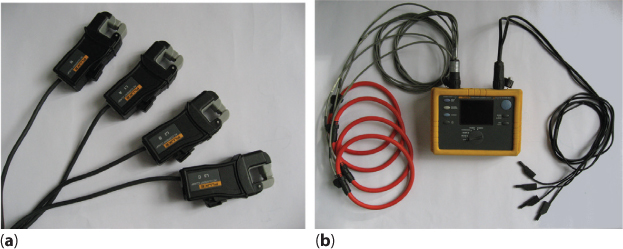
Figure 8.4 Photographs of devices for measuring electricity: (a) Fluke I5S 5A AC current probes, and (b) Fluke 1735 Three-Phase power logger (photographed at Technische Universität Chemnitz).
The gas consumption is measured at the input to the welding equipment either from a gas cylinder or a centralized gas supply system. Pressure gauges are usually part of the gas distribution system in order to set the right pressure parameters. The gas consumption is commonly measured with flow counters or flow meters. Similar to electricity, flow counters account for the total volume, whereas flow meters measure the volumetric flow rate. However, in many cases the term “flow meter” is used for both. Depending on the physical principle that is used, a connection of the measurement section with the pipe is necessary. For example, thermal flow meters introduce heat into the gas flow and measure the amount of heat that is dissipated due to the gas flow velocity. Ultrasonic measurement devices, on the other hand, may be clamped on a pipe since they measure the transfer speed of sound within the flowing gas.
The consumption of the filler metal can be measured by keeping track of the length of material that is used for creating the weld. Usually, the wire feed rate is part of the welding parameter set and is determined with a read-out. If the electrode is continuously fed from a wire spool, there might be a counter at the spool that can be used as well.
Besides the energy consumption for the actual welding processes, the up-stream energy that is embodied in the materials and resources used should be considered for a holistic perspective on sustainability (see Section 8.2). Data on the environmental effects of primary materials production is provided by different organizations, including the World Steel Association [17], the Aluminum Organization [18], and the U. S. National Renewable Energy Laboratory [19]. Besides that, there are a number of commercial software packages for life cycle assessment that include databases on the environmental effects of raw material production. The most widely used database of this kind is “ecoinvent,” which is published by the Swiss Centre for Life Cycle Inventories [20].
8.5 Efficiency of Joining Equipment
Energy is consumed at different rates (i.e., power) during various steps of a joining process. Figure 8.5 shows a representative schematic of the power levels involved during a joining process. These power levels are:

Figure 8.5 Representative schematic of power levels associated with energy consumption for a joining process.
Base Power: The joining process begins with properly fitting and securing the two or more workpieces to be joined together and ends with removing them from the fixture. In these steps, the equipment is at the level of base power, Pbase. When the welding equipment is switched on there are a number of auxiliary systems that are activated (e.g., lights, displays, computer panel, way lube, pumps, etc.) and stay on throughout the process. The time spent at this level is known as base time, tbase which may include the time to load and unload workpieces besides the idle time, tidle. The product of base power, Pbase (Watts = Joules/second) and base time, tbase (seconds) results in the base energy, EB in Joules (also known as standby energy).
Idle Power: Idle Power, Pidle, is used to move the joining mechanism to and from the joining location without joining occurring. For example, the weld electrode wire and flux in fusion arc welding methods, the tool in friction stir welding, nut-bolts, rivets, nails, and adhesive in mechanical fastening methods, etc., approach the workpiece. The time spent at this level is known as idle time, tidle, which may include the approach, retraction and cleaning time depending upon the operation cycle besides the joining time, tjoining. The product of idle power, Pidle and idle time, tidle results in the idle energy, EI.
Joining Power: Joining power, Pjoining, is consumed when joining commences and moves along the designated path. The time spent at this level is known as joining time, tjoining. This time is also known as welding or arc-on time.
The product of joining power, Pjoining. and joining time, tjoining. results in the tip energy/joining energy, EJ.
The total energy for an operation cycle, ET, is given by the sum of basic, idle and joining energies and is expressed as below,
(8.1)
The theoretical minimum amount of energy, EM, needed to create a joint is the component that directly contributes to creating a bond. For example, in a fusion welding process it is the sum of the sensible and latent heat needed to melt the material in the weld nugget, and does not include any energy dissipated into the bulk of the workpiece or lost as ultraviolet light. EM, is included in EJ. The process efficiency is related to the total energy consumed by the process and can be defined as,
(8.2)

The efficiency of the joining step or joining efficiency can be given by,
(8.3)

The calculation of the minimum energy required for a joining process depends on the type of joining process. The determination of minimum energy and joining efficiency is discussed in the next section. It can be noticed from Eqs. (8.1) and (8.2) that the calculation of process efficiency also requires the knowledge of base and idle energies. Base energy and idle energy are mainly dependent on the equipment used for the joining process and may vary for similar machines from different makers. However, this variation is often small, and base and ideal energies can be approximated as a certain percentage of the maximum rated power of the machine. This is further explained with the help of examples in the next section.
8.6 Efficiency of Joining Processes
In Section 8.3, a new classification of joining processes was introduced. This section deals with the estimation of efficiency of joining processes belonging to these categories. A workpiece undergoing a joining process may, or may not, require fixturing depending on its geometry. Depending on the type of joining process, the workpiece may also need some pre-processes. The joining process is carried out after that, which is followed by post processing as per the requirements. Jigs and fixtures, pre-processing, energy metrics for the representative process and post processing are discussed below for each joining process category.
8.6.1 Fusion Welding
Jigs and fixtures
Fixturing is necessary to hold parts in alignment during the joining process. Ideally, the parts would be self-fixturing by virtue of gravity. If the part cannot be designed to be self-fixturing, then external fixturing must be designed. The type of fixturing also depends on the process. Backing plates made from different metals dissipate heat at different rates, thereby affecting the heat transfer during the welding process. Therefore, different backing plates (e.g., steel, copper, etc.) can be used depending on the metal to be welded and on the workpiece thickness. Backing plates also act as physical barriers and prevent leakage of melt pool at the bottom of the groove.
Pre-Processing
Depending upon the initial state of the workpiece and method to be used for joining, the workpiece may require pre-processing. For example, arc welding methods usually require surface cleaning. For some of the welding configurations, chamfering may be required. Figure 8.6 shows the edge preparation for the corner joint configurations. Workpiece edges are prepared by cutting processes like sawing, flame cutting, punch-press blanking, etc. Spacer bars may be required to prevent melt-through when very large root openings are used on double-grooved joints (Figure 8.7). A wide gap may be unavoidable for practical reasons, e.g., when there are difficulties in pulling the parts together for desired fit-up [21].

Figure 8.6 Edge preparation for corner joint configurations [22].

Figure 8.7 Welding edge preparations for wide root openings. (a), (b), and (c) Backing bars. (d) Spacer bar [21].
Energy metrics for a representative fusion arc welding process with a non-consumable electrode (e.g., gas tungsten arc welding) are explained next.
Energy metrics for fusion arc welding processes (non-consumable electrode)
Figure 8.8 shows the flow diagram for a representative fusion arc welding process. Electricity is used as the main energy source in the process. Feed wire, and either shielding gas or flux also enter the process. The feed wire melts and gets consumed in the weld formation. Shielding gas is used to provide an inert atmosphere for welding and leaves the process as emissions. Flux avoids rapid oxidation of base metal at elevated temperatures. It melts during the process and forms slag which is discarded as waste. The amounts of feed wire, shielding gas and flux are estimated by multiplying their respective consumption rates by welding/arc-on time.
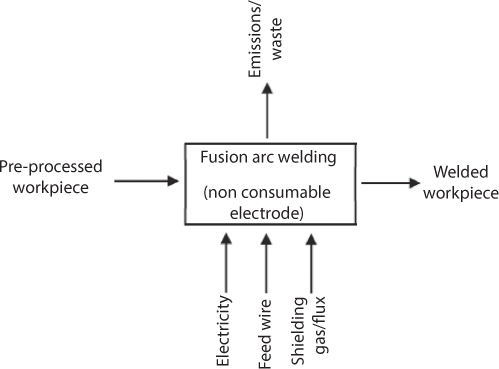
Figure 8.8 Flow diagram for fusion arc welding process.
For arc welding processes with non-consumable electrodes, the amount of energy consumed in the joining process is given by,
where, EJ is joining energy in joules, V is the voltage applied, I is the current, t is the arc-on time, PB is the base power in Watts and PI is the idle power in Watts. It should be noted that base and idle power for the equipment should be known before hand. The minimum amount of energy required to melt the base metal and filler rod (feed wire) is given by,
(8.5)
where, v is the welding speed, U is the specific energy required for melting, and A is the cross section of the weld. Table 8.4 shows the approximate specific energies required to melt a unit volume of commonly welded metals. Therefore, joining efficiency is given by the expression,
(8.6)

Table 8.4 Specific melting energy for some commonly welded metals [23].
| Material | Specific energy, U | |
J/mm3 |
BTU/in3 |
|
| Aluminum alloys | 2.9 |
41 |
| Cast irons | 7.8 |
112 |
| Copper | 6.1 |
87 |
| Bronze | 4.2 |
59 |
| Magnesium | 2.9 |
42 |
| Nickel | 9.8 |
142 |
| Steels | 9.1-10.3 |
128-146 |
| Stainless steels | 9.3-9.6 |
133-137 |
| Titanium | 14.3 |
204 |
Post-Processing
Some joining processes need post processing. For example, post-weld heat treatment (PWHT) is defined as any heat treatment after welding. PWHT increases the resistance to brittle fracture and reduces residual stresses. PWHT may also result in hardness reduction and material strength enhancement. It also reduces hydrogen induced cracking (HIC). Mechanical or flame straightening is another post process which is used to straighten long structures like railings and racks that may warp or bend due to residual stresses induced by welding. Surface finishing operations like grinding and polishing may be required to achieve the surface finish as per the specifications of the application.
Pre- and post-processing steps also consume energy. The amount of energy consumed depends on the type of pre- and post-process. This makes it difficult to predict the energy consumed in these processes without conducting some measurements. Although, in a manufacturing line these pre- and post-processes can be treated as separate unit processes before and after the joining process.
8.6.2 Chemical Joining Methods
Oxy-acetylene gas welding is presented as the representative process for chemical joining methods. Fixturing, pre-processing and post-processing requirements of oxy fuel gas welding methods are similar to fusion welding methods.
Energy metrics for oxy-acetylene gas welding
The most common gas welding process uses acetylene and oxygen; the process is known as oxy-acetylene gas welding. Figure 8.9 shows the flow diagram for an oxy-acetylene welding process. The energy that is released during the chemical reaction of acetylene and oxygen is used as the energy source in the process. The products of this reaction are gaseous in state and are released as emissions. Filler rod also enters the process. It liquefies and becomes part of the melt pool. Filler rods come in standard lengths and diameters. Therefore, the mass of filler rod that is consumed can be estimated by the knowledge of number of filler rods consumed and density of the filler rod material.

Figure 8.9 Flow diagram for oxy-acetylene gas welding process.
The energy release is generated from a pair of chemical reactions,

Therefore, the combustion of one mol of acetylene gas (C2H2) releases 1260 kJ of energy. The amount of gas consumed in grams is accounted for by the pressure gauge readings or weight of the cylinder. One mol of acetylene gas weighs 26 grams. Therefore, the amount of energy consumed in the joining is given by,

Where, EJ is joining energy in joules, and m is the mass of the gas consumed in grams. The minimum amount of energy required to melt the base metal and filler rod is given by,
(8.8)
Where, EM is the minimum amount of energy required for the weld in joules, l is the length of the weld in mm, A is the cross sectional area of the weld in mm2, and U is the specific energy required for melting in J/mm3. Therefore, the ratio of EJ and EM gives the joining efficiency and can be expressed as,
(8.9)

Table 8.4 shows the approximate specific energies required to melt a unit volume of commonly welded metals. The cross sectional area of the weld, A, can be determined by one of two methods: (1) an experimental setup can be used, i.e., by making weld cross sections and measuring the area of welded zone; (2) the area can be approximated to be rectangle, circle or trapezoid, etc. and multiplied by the depth of the workpiece as the major dimension of the geometry. The second method is used in the examples discussed in Section 8.9.
8.6.3 Solid-State Welding
Solid-state welding encompasses a wide variety of metal joining processes like brazing, soldering and friction stir welding, etc. Torch brazing is regarded as the representative method for the sub category. Fixturing, pre-processing, energy metrics and post-processing for torch brazing are explained in this section. Friction stir welding is addressed in detail with an example in Section 8.9.
Jigs and fixtures
Fixtures for torch brazing should be lightweight and have as little contact as possible with the parts to be brazed in order to prevent the fixture from acting as a heat sink. Regardless of the process or base metal, the differences in the coefficient of thermal expansion (CTE) between the base metal and the fixture material must be considered, in order to prevent warpage or damage to the brazed part. CTE differences can also be used advantageously to pull parts into place during the heating process.
Pre-Processing
For brazing, parts must be free from grease, dirt, oxides, and other contaminants that inhibit the filler metal to wet and flow on the surface of the base metal. Therefore, all processing fluids and mill scale must be removed. It is important to match the cleaning method to the type of contaminant to be removed (that is, water based for water-based coolants, and solvents or alkaline degreasers for oily residues). Mechanical cleaning is preferred for removing heavy scales.
Energy metrics for torch brazing
Figure 8.10 shows a flow diagram for torch brazing. Like oxy-acetylene welding process, chemical energy from acetylene and oxygen is used as the energy source and the products of the reaction are released as emissions. Filler metal and flux also enter the process. Filler metal melts and creates the joint. Like filler rods, filler metal also comes in standard lengths and diameters. Therefore, the mass of filler metal consumed can be estimated by the knowledge of number of filler rods consumed and density of the filler rod material.
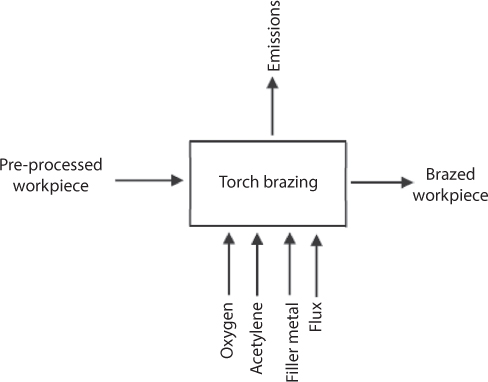
Figure 8.10 Flow diagram for torch brazing.
In torch brazing, oxy-acetylene flame is used as the source of heat. Therefore, the energy consumed in joining is given by Equation (8.7). The minimum amount of energy required to increase the temperature of the base metal and filler metal and melting of filler metal is given by,
Where mb is mass of base metal, cb is specific heat of the base metal, mf is the mass of filler metal undergoing melting, cf is specific heat of filler metal, Lf is the latent heat of filler metal and ΔT is the difference in the room temperature and the brazing temperature. Table 8.5 shows the typical filler metals and brazing temperatures for brazing various metals and alloys.
Table 8.5 Filler metals and brazing temperatures for brazing various metals and alloys.
| Base metal | Filler metal | Brazing temperature (°C) |
| Aluminum and its alloys | Aluminum-silicon | 570–620 |
| Magnesium alloys | Magnesium-aluminum | 580–625 |
| Copper and its alloys | Copper-phosphorus | 700–925 |
| Ferrous and non-ferrous (except Al and Mg) | Silver and copper alloys, copper-phosphorus | 620–1150 |
| Iron-, nickel-, and cobalt-based alloys | Gold | 900–1100 |
| Stainless steels, nickeland cobalt-based alloys | Nickel-silver | 925–1200 |
The brazing temperature can be better estimated by measuring the temperature during the process. The mass of the filler metal undergoing melting can be determined by accounting for the total amount of filler metal consumed. EM can be calculated for different brazing methods by Equation (8.10). Equation (8.4) can be used for the determination of EJ for brazing methods that utilize electrical energy to create heat. As such, brazed workpieces do not need any post processing. Brazed workpieces may undergo cleaning and painting depending upon their use and application.
8.6.4 Mechanical Joining Methods
Most of the processes in this grouping consume mechanical energy during the process. Joining by nuts and bolts, riveting, nailing, and adhesives are some of the examples of the processes included in this group. Mechanical fastening and adhesive bonding are addressed as representative processes for this group in this section.
8.6.4.1 Mechanical Fastening Jigs and Fixtures
Fixturing requirements for mechanical fastening usually depend on the weight of the parts involved. In most of the cases, no fixturing is required for relatively light parts. On the other hand, relatively heavy parts may need some sort of guides like guiding bolts or dowel pins to align the parts in the right position before being joined by nuts and bolts.
Pre-Processing
Holes are drilled in the workpieces to accommodate the bolts. However, drilling holes can also be considered as a separate operation. Also, energy is consumed in manufacturing of nuts and bolts. This can also be accounted as a separate process or group of manufacturing processes.
Energy metrics for mechanical fastening
Figure 8.11 shows a flow diagram for mechanical fastening joining process using nuts and bolts. During the process, energy is consumed in placing the bolts in the holes and fastening the nuts. In an automated or semi-automated manufacturing setup, this can be accomplished by using hydraulic, pneumatic or electric actuators. Therefore, the energy consumed in this step is the product of the power requirement of the actuating mechanism and the time required for the fastening operation. This method does not require any post processing in general.
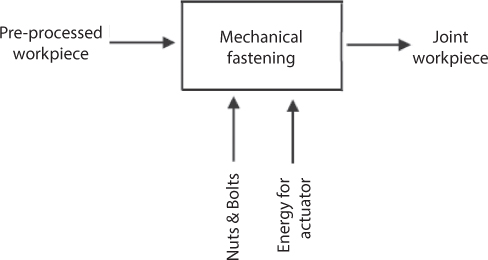
Figure 8.11 Flow diagram for mechanical fastening by nut-bolts.
8.6.4.2 Adhesive Bonding
Jigs and Fixtures
Fixturing may be needed to orient the parts and hold them in place as the adhesive sets. However, this can be achieved by gravity depending on the geometry of parts.
Pre-Processing
Surfaces to be joined are required to be prepared in most of the cases. This may include creating a specified surface texture, application of primer, chemical cleaning, etc. Energy is also required in manufacturing of adhesive. These steps can be considered as separate processes.
Energy metrics for adhesive bonding
Application of adhesive to the joining surfaces can be automatic in fast paced manufacturing environments. The energy consumed during the process depends on the power rating of the equipment used for the purpose. Some of the adhesive requires curing at elevated temperatures. Therefore, the workpiece requires heating. Energy required for thermal curing depends on the power rating of the heater and duration of the curing. Figure 8.12 shows a flow diagram for the adhesive bonding process. This method does not require any post processing in general.
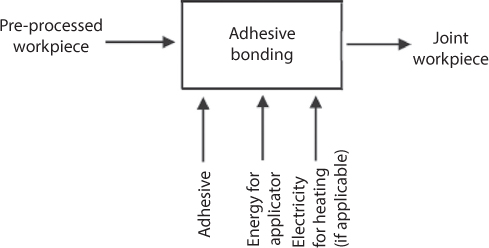
Figure 8.12 Flow diagram for the adhesive bonding process.
8.7 Process Selection
Table 8.6 compares commonly used joining methods. No method is best in all the categories. Therefore, the selection of a proper joining method for an application depends on the metal to be joined, joint design, joint requirements, cost, and energy consumption associated with it. Although mechanical fastening methods like riveting, fastening, adhesive bonding, seaming, and crimping require less energy and are easy to inspect, they are not the best choice when strength and ease of maintenance are considered. Therefore, such joining methods are preferred for parts that are required to be dismantled regularly for maintenance and inspection. On the other hand, arc welding, resistance welding, and friction stir welding processes offer maximum strength, design flexibility, and cost effectiveness for mass production. These processes create a permanent joint, which makes the inspection of the joint very difficult. Methods that facilitate the inspection of such joints like radiography, magnetic, and ultrasonic techniques are relatively costly. Friction stir welding is the most energy efficient method among the processes that create permanent joints. However, the initial investment in equipment for friction stir welding is relatively high.
Table 8.6 Comparison of commonly used joining methods [24].
| Method | Strength | Weld configurations | Small parts | Large parts | Tolerances | Reliability | Ease of maintenance | Ease of inspection | Cost | Energy |
| Arc Welding | 1 |
1 |
3 |
1 |
3 |
1 |
2 |
2 |
2 |
3 |
| Resistance Welding | 1 |
2 |
1 |
1 |
3 |
3 |
3 |
3 |
1 |
3 |
| Brazing | 1 |
1 |
1 |
1 |
3 |
1 |
3 |
2 |
3 |
3 |
| Bolts and nuts | 1 |
2 |
3 |
1 |
2 |
1 |
1 |
1 |
3 |
1 |
| Riveting | 1 |
2 |
3 |
1 |
1 |
1 |
3 |
1 |
2 |
1 |
| Fasteners | 2 |
2 |
3 |
1 |
2 |
2 |
2 |
1 |
3 |
1 |
| Seaming and Crimping | 2 |
3 |
1 |
3 |
3 |
1 |
3 |
1 |
1 |
2 |
| Adhesive bonding | 3 |
1 |
1 |
2 |
3 |
2 |
3 |
3 |
2 |
1 |
| Friction stir welding | 1 |
3 |
1 |
1 |
2 |
1 |
1 |
2 |
3 |
1 |
Note: 1 = very good; 2 = good; 3 = poor. For cost and energy, 1 is the lowest.
8.8 Efficiency of Joining Facilities
The previous sections have discussed the energy efficiency of joining equipment and processes. However, these also affect the energy efficiency of the entire facility in which the processes take place. Thus, there is a need for tools and methods to analyze factory systems regarding their energy efficiency.
The structure of a factory is subdivided into hierarchical organization levels and peripheral areas [25]. The hierarchical organization distinguishes between the levels of workstation, workstation group, section, division, and plant. The peripheral order of a factory distinguishes between three peripheries – besides the main manufacturing process – according to their extent of connection to the production program [25]: Systems in the first periphery are directly connected to the product (e.g., quality assurance), whereas the systems in the second periphery are only directly connected to the main process systems (e.g., maintenance). The systems of the third periphery are mainly independent of the main process and its systems (e.g., sanitary facilities).
Structuring a factory according to its peripheries supports the identification of relationships between the systems. In terms of energy efficiency, it allows determining the side-effects of changes within processes. Figure 8.13 shows an example of the peripheral structure of a welding shop. The main process is welding and the necessary pre- and post-processes (e.g., grooving). The electricity consumption of these processes was discussed in previous sections. Further improvement opportunities to reduce energy consumption can be found, for example, in the control of the shielding gas flow [26]. Processes directly connected to the product include logistics (e.g., handling, transport, buffer, etc.) and inspection. In automated welding shops, the parts handling is often done by robotic systems. Energy efficiency measures for robots include, for example, the choice of the trajectory of movement. Processes connected to the equipment comprise maintenance of the welding equipment and the supply and disposal of necessary resources. Energy efficiency measures for these technical building services can be applied in energy generation, storage, and distribution. For example, the supply of gas or compressed air often involves pressure losses in the pipe system. Therefore, the choice between a centralized or decentralized gas supply affects the energy efficiency of the welding shop. The supply of fresh air and the treatment of exhaust air is another important peripheral system in welding shops due to the generation of welding fumes. The energy consumption of these systems highly depends on the volumetric flow rate and the required air quality. A reduction of volumetric flow rate can, for example, be achieved by a proper arrangement of the welding equipment or by using localized exhaust systems.
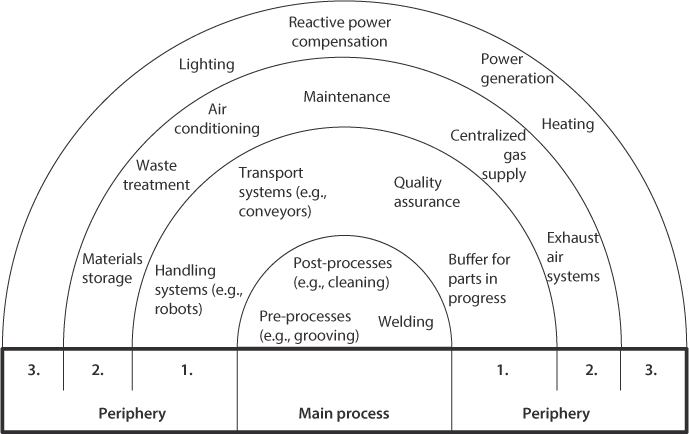
Figure 8.13 Peripheral structure of a welding shop (adapted from [25]).
The structure of the energy consumption among the peripheries gives insights into the individual shares and thus, helps to identify areas that have high shares of the energy consumption, and hence, might be focused on in terms of energy efficiency. Although the main process may be considered as the most important one for traditional objectives, such as lead time and product quality, this is not necessarily true for energy consumption. An example of the energy consumption structure within an automotive car body construction shop found that the peripheral systems were consuming 50% of the total energy, and the ventilation systems alone were responsible for 25% [27]. Other possibilities for creating transparency on the energy consumption within a factory are visualizing the energy flow in combination with the factory layout [28] and using the energy value-stream analysis [29].
The identification of energy efficiency measures in welding facilities can be supported by using general principles for these measures. Figure 8.14 shows a general model for energy efficiency measures in a factory. However, this only provides general recommendations. A more systematic approach is described by methods that support the identification of energy efficiency measures in factory systems. [30].

Figure 8.14 General model for energy efficiency measures in factories [31].
The application of this model supports the identification of energy efficiency measures, which will be demonstrated by some examples.
A substitution of energy sources is often discussed for the use of compressed air since this is considered to be one of the most expensive energy carriers in industry. The reason for this is that there are high energy losses associated with the generation and distribution of compressed air, which may lead to an overall efficiency as low as 10% [32]. For example, pneumatic welding tongs may be replaced by electrical welding tongs in automotive industry [33].
Energy recovery measures are mainly used for thermal energy. For example, the temperature of the exhaust air can be used in heat exchangers to heat the cold incoming air for the air conditioning systems or preheat parts heading into a furnace.
The efficiency of equipment was discussed in the previous sections. However, on a factory scale, not only the active power of equipment needs to be considered but also the apparent power. Depending on the contract with the energy supplier, charges may apply in case the reactive power exceeds a certain level since the supplier needs to take actions to compensate for the reactive power. The ratio of real power to apparent power is defined as the power factor, whereof welding equipment may have a power factor as low as 35% to 60% [34]. However, modern welding equipment with inverter-based power supply may increase the power factor [35].
The reduction of process losses does not only apply to the manufacturing process, but also to the peripheral systems as discussed before. One example is to reduce the pressure losses in centralized gas-supply systems due to bottlenecks or loose fittings in pipes.
8.9 Case Studies
Case studies are presented for the metrics of energy consumption for Submerged Arc Welding (SAW) and Friction Stir Welding (FSW) processes. Different power and energy levels at which energy is consumed during the processes are discussed. The total energy consumption and mass loss during the process for the workpieces is estimated.
8.9.1 Submerged Arc Welding (SAW)
Submerged arc welding (SAW) is a fusion welding process [36, 37]. The base metal is melted by establishing an arc between the consumable wire electrode and the base metal. The arc is shielded by molten slag and granular flux during the process. The flux is supplied from a hopper. Flux hides the arc (e.g., ultraviolet light emissions) and no smoke is produced during the process, which results in improved working conditions as compared to other arc welding processes. Figure 8.15 shows a schematic of the SAW process. SAW is primarily used for welding steel plates and is often automated.

Figure 8.15 SAW - equipment diagram [38].
Tip Energy/Joining Energy (Weld Energy)
The fillet weld represents about 80% of all weld joints [39]. The cross sectional area, A, for a fillet weld can be approximated as an equilateral triangle of leg distance a. The cross sectional area, A is given by
The leg distance, a, is determined with respect to the thickest workpiece being joined. Table 8.7 provides the weld leg length for a range of work-piece thicknesses. If the leg distance is larger than the thickness of the thinnest piece, then the thinnest piece dimension is used.
Table 8.7 Minimum fillet leg distance based on the larger workpiece thickness being joined [24, 40].
| Thickness of thicker workpiece being welded, inch (mm) | Minimum leg of fillet weld, inch (mm) |
| ≤6 (≤0.25) | 3 (0.125) |
| 6 – 13 (0.25 – 0.5) | 5 (0.1875) |
| 13 –19 (0.5 – 0.75) | 6 (0.25) |
| 19 – 38 (0.75 – 1.5) | 8 (0.3125) |
| 38 – 57 (1.5 – 2.25) | 10 (0.375) |
| 57 – 152 (2.25 – 6) | 13 (0.5) |
| 152 ≥ (6≥) | 16 (0.682) |
The square groove butt weld is the second most common weld configuration. The weld cross section, A, for square groove butt weld is given by the gap width, d, multiplied by the thickness of the metal, T.
(8.12)
where, d is the gap width and T is the thickness of the metal. The gap width, d, is based on the metal thickness and is the same as the fillet leg length of Table 8.7. For known weld length, Lw, the mass of the welded region, Mweld is given by Equation (8.13). The density of electrode metal, ρ is mentioned in Table 8.8.
Table 8.8 Density of electrode metals used in submerged arc welding.
| Welding wire density, Miller Electric Manufacturing [40] | |||||
| Material | Inches/pound |
Diameter of wire, in |
Volume of wire, cu in per inch of wire |
Density, lb/cu in |
Density, kg/cu m |
| Mild steel | 519 |
0.09375 |
0.0069 |
0.28 |
7750 |
| Aluminum | 1510 |
0.09375 |
0.0069 |
0.10 |
2768 |
| Aluminum bronze | 538 |
0.09375 |
0.0069 |
0.27 |
7474 |
| Copper | 455 |
0.09375 |
0.0069 |
0.32 |
8858 |
| Copper-nickel | 482 |
0.09375 |
0.0069 |
0.30 |
8304 |
| Magnesium | 2350 |
0.09375 |
0.0069 |
0.06 |
1661 |
| Nickel | 460 |
0.09375 |
0.0069 |
0.31 |
8581 |
| Silicon bronze | 480 |
0.09375 |
0.0069 |
0.30 |
8304 |
| Stainless steel 300 | 510 |
0.09375 |
0.0069 |
0.28 |
7750 |
| Stainless steel 400 | 528 |
0.09375 |
0.0069 |
0.27 |
7474 |
The minimum amount of energy required for submerged arc welding is estimated by accounting for the amount of energy required to heat and melt the electrode material and the flux. The welding process occurs at a temperature of approximately 1,800°C, which is 225 °C superheat above the melting point of the mild steel electrode. Using 265 J/g for latent heat of fusion, 0.65 J/g/°C for specific heat capacity of the solid and 0.61 J/g/°C for specific heat capacity of liquid mild steel, the energy required is approximately 1.4 MJ/kg for mild steel electrode material. In submerged arc welding, flux is consumed at a rate of approximately 1 kg per 1 kg of weld metal deposited. An additional 1 kg of flux is put in place, which is not consumed and is subsequently recovered using a vacuum system and reused as flux [41]. The minimum amount of energy required to heat and melt the flux is approximately 2.0 MJ/kg [23]. Therefore, the minimum amount of energy required to heat and melt the electrode material and flux totals to 3.4 MJ/kg. The vacuum system requires approximately 0.0065 MJ/kg of flux [42]. The efficiency for submerged arc welding equipment for this case study was 45% [23]. Therefore, a minimum energy requirement of 3.4 MJ/kg of weld material corresponds to 7.5 MJ electricity/kg (3.4/0.45 MJ/kg) of weld material. Therefore, the Joining energy, EJ is given by
Total Energy
For the case study, it was established that 70% of the total energy was spent during welding, 20% was spent idling and 10% of total energy was spent as base energy [23]. Therefore, the Total energy, ET is given by

Idle Energy
The Idle energy, EI is given by
(8.16)
Base Energy
The base energy, EB is given by
Mass Loss in Submerged Arc Welding
The slag formed from the flux during SAW is discarded and thereby qualifies as Mass loss or Waste. As stated previously, approximately 1 kg of flux is converted to slag for every 1 kg of electrode material deposited during the weld. Therefore, the Mass loss, Mloss is given by
Example
50 separate fillet welds were carried out on 9.5 mm (0.375 inch) thick steel with ESAB 300S SAW equipment. The total length of the welds was 1.8 m (70 inch).
Joining Energy
From Table 8.7, the fillet leg, a of 4.8 mm (0.1875 inch) corresponds to the plate thickness of 9.5 mm. The fillet cross sectional area, A is given by Eq. 8.11.
The weld length, Lw is 1.8 m and from Table 8.4, the density of a mild steel weld electrode, ρ is 7750 kg/m3. Therefore, the mass of the welded region, Mweld is given by Eq 8.13.
The Joining energy, EJ is given by Eq. 8.14.
Total energy
The Total energy, ET is given by Eq. 8.15.

Mass Loss
The Mass loss, Mloss is given by Eq. 8.18.
8.9.2 Friction Stir Welding (FSW)
FSW is a solid state joining process, in which two or more components are plastically deformed and mechanically intermixed under mechanical pressure at elevated temperatures but do not exceed the solidus temperature of the base metal [43, 44]. FSW has found widespread use for welding relatively low melting temperature alloys of aluminum as well as magnesium. Figure 8.16 shows a schematic of the FSW process. The process involves a non-consumable rotating tool with specifically designed probe and shoulder. Figure 8.17 shows an image of an FSW tool. The tool is plunged with a downward force into the workpiece. Once the pin is completely inserted in the workpiece and the shoulder makes contact with the workpiece surface, the tool is traversed along the weld seam (butt welding) or along a defined path (lap welding). At the end of the weld, the tool is retracted. Figure 8.18 shows the measured (wall plug) power for a representative friction stir weld in 5.4 mm thick 7075-T6 aluminum on a 3-axis CNC mill. The power levels and associated times can be generalized for the purpose of energy estimation as shown in Figure 8.19.
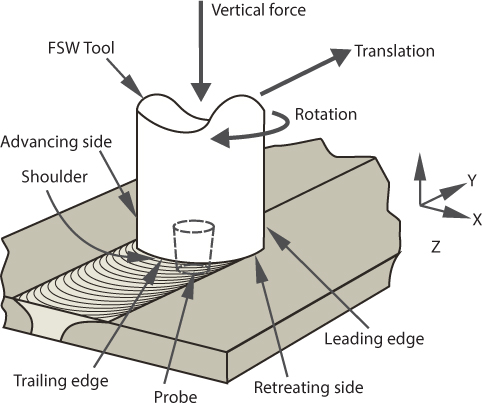
Figure 8.16 Schematic of Friction Stir Welding (UW-Madison).
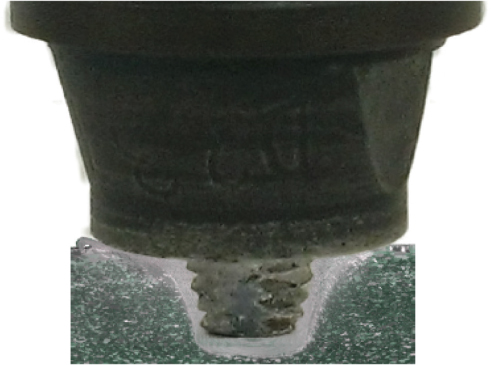
Figure 8.17 Photograph of FSW tool superimposed on image of weld cross-section (images by UW-Madison).

Figure 8.18 Power characteristics for a representative friction stir weld.
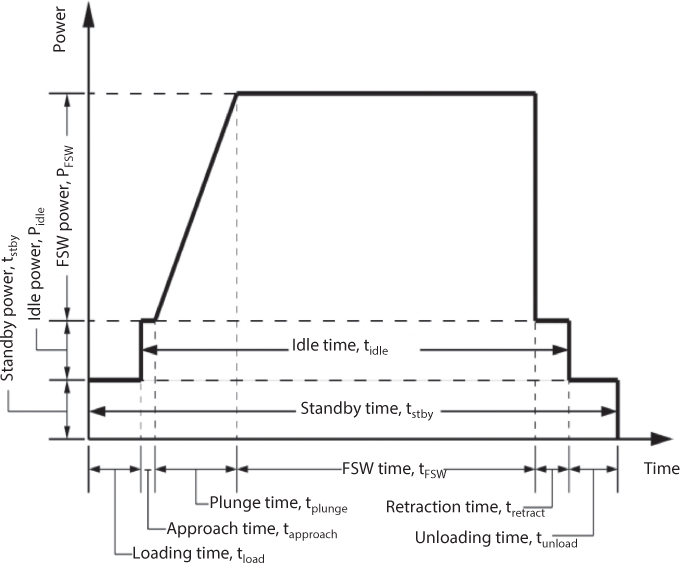
Figure 8.19 Schematic of energy consumed in FSW
Joining Energy (FSW Energy)
The Joining energy, EJ for the process of FSW is given by
(8.19)
where, Lw is weld length, UFSW is specific FSW energy and TWA is the tool working area. TWA is given by

where, hp is height of the FSW tool probe and ds is the shoulder diameter and dp is the probe diameter at the tip. UFSW based on TWA for 5083-H116, 6061-T6, 7075-T6 aluminum alloys are given in Table 8.9.
The joining time, tjoining is given by
(8.21)

Where Lw is weld length in mm and fw is weld feed rate in mm/sec.
Table 8.9 Specific Weld Energy based on TWA [45].
| Alloy | UFSW at fw = 2.5mm/sec (J/mm3) |
| 5083-H116 | 13.86 ± 5% |
| 6061-T6 | 16.1 ± 5% |
| 7075-T6 | 12.85 ± 5% |
Plunge Energy
Before the friction stir welding actually starts, the FSW tool has to engage with the workpiece. When the tool contacts the workpiece, the power level reaches the highest value and the power consumed during this phase is plunge power. Therefore, plunge energy is calculated by

Where EPlunge is plunge energy in joules, PFSW is FSW power in watts and tPlunge is plunge time in seconds and is given by

Where dPlunge is plunge depth in mm and fPlunge is plunge feed rate in mm/sec. The FSW power is given by
Idle Energy
The idle energy, EI is given by
It can be noticed from Figure 8.19 that the idle time (tIdle) is the sum of the approach time tapproach, plunge time tPlunge, joining time tFSW and retraction time tretraction. Therefore, the idle time, tIdle is calculated as follows,
The FSW tool moves from the home position to the approach point at rapid traverse rate. This distance will vary depending upon the size of the machine and the pieces being welded. Once the FSW tool has reached its first offset position, the feed rate changes to fPlunge, and then to fw, once the plunge period is complete. During the welding process, the total travel of the tool can be longer than the weld length in order to avoid an exit hole: by running the tool onto a wedge or run-off tab. After reaching the end point (be it in the weld or on a run-off tab), the tool retracts back to an offset position at rapid traverse rate. It can be noticed that idle power, pIdle mainly depends on the machine tool used for the process. Therefore, it is represented as a percentage of the rated maximum power of the machine tool. It is estimated to be approximately 7.5% of rated (max) power of the machine tool [23].
Base Energy
The base energy, EB is given by
The average base power Pbase is estimated to be about 5% of rated (max) power of the machine tool [23]. The base time is given by
Example
A bead-on-plate weld was carried out on a 5083-H116 plate with dimensions of 76 mm × 203 mm and 6.35 mm thickness. Table 8.10 shows the welding parameters and the dimensions of the FSW tool.
Table 8.10 Friction stir welding parameters and tool dimensions.
| Weld length(Lw) | 150 mm |
| Plunge depth (dplunge) | 5.4 mm |
| Spindle speed | 900 rpm |
| Feed rate (Traverse) (fw) | 150 mm/min |
| Feed rate (Plunge) (fplunge) | 30 mm/min |
| Travel angle | 3 degrees |
| Offset distance (doffset) | 3.2 mm |
| Approach distance (dapproach) | 175 mm |
| Retraction distance (dRetraction) | 180 mm |
| Rapid traverse rate (fRapid) | 200 ipm = 5080 mm/min |
| Machine Tool rated (max) Power | 5200 W |
| Tool Dimensions | |
| Shoulder diameter (ds) | 15 mm |
| Pin diameter (dp) | 5 mm |
| Pin height (hp) | 5.4 mm |
Joining Energy (FSW Energy)
The tool working area is calculated using Eq. (8.20),

The Joining Energy, EJ is calculated using Eq. (8.17) for which specific weld energy for 5083-H116 aluminum alloy is taken from Table 8.9 and weld length from Table 8.10.
Therefore,
Plunge Energy
Plunge time is given by Eq. (8.23).
And FSW power is given by Eq. (8.24)

Therefore, as per Eq. 8.22, plunge energy is given by

Idle Energy
The approach time is calculated as,

The retraction time is calculated as below,

According to Eq. (8.26), idle time is given by

As mentioned before, the idle power is 7.5% of rated (max) power of machine tool. As given in machining parameters, the rated (max) power of the machine tool was 5200 W. Therefore, the idle power is
From Eq. (8.25), the Idle energy, EI is,
Base Energy
The total base time, tbase consists of loading and unloading. The weight of one plate was calculated to be 0.58 lb. Upon welding, the net weight would double to 1.16 lb. A work holding device with 6 clamps was used. Referring to [46], this leads to a loading time of 34.9 seconds and the same amount of time for unloading. Therefore from Eq. (8.28), the base time is,
As mentioned earlier, the base power is estimated with 5% of rated (max) power of machine tool. As given in machining parameters, the rated (max) power of the machine tool was 5200 W. Therefore, the base power is
Using Eq. (8.27), the base energy is,
Total Energy
The Total energy, ET for welding can be determined by,
Reference
1. United Nations, Our Common Future – Report of the World Commission on Environment and Development, http://www.un-documents.net/our-common-future.pdf, 1987.
2. U. S. Environmental Protection Agency, Sustainable Manufacturing, https://www.epa.gov/sustainability/sustainable-manufacturing, 2015.
3. U. S. Energy Information Administration, Energy Consumption by Sector, http://www.eia.gov/totalenergy/data/monthly/pdf/sec2_3.pdf, 2014.
4. McKinsey & Company, Unlocking Energy Efficiency in the U.S. Economy, http://www.iacforum.org:8080/iac/pdf/US_energy_efficiency_exc_summary.pdf, 2009.
5. U. S. Energy Information Administration, Manufacturing Energy Consumption Survey (MECS) 2010 – Table 1.1 First Use of Energy for all Purposes (Fuel and Nonfuel), https://www.eia.gov/consumption/manufacturing/data/2010/pdf/Table1_1.pdf, 2013.
6. Miller, C., Crawford, M. H., French, R., Jr., F. S., Welding-Related Expenditures, Investments, and Productivity Measurement in U.S. Manufacturing, Construction, and Mining Industries, http://files.aws.org/research/HIM.pdf, 2002.
7. Association of German Engineers (VDI), VDI-Guideline 4600 Cumulative Energy Demand (CED) – Terms, Definitions, Methods of Calculation, 2012.
8. International Organization for Standardization, ISO 14040 Environmental Management – Life Cycle Assessment – Principles and Framework, 2009.
9. Mose, C., Weinert, N., Process Chain Evaluation for an Overall Optimization of Energy Efficiency in Manufacturing – The Welding Case. Robot. CIM-Int. Manuf., 34, 44–51, 2015.
10. Hälsig, A., Mayr, P., Energy Accounting of Joining Processes [original title: Energetische Bilanzierung von Fügeverfahren], in: Proceedings of the 1st and 2nd Workshop of the Cross-sectional Group 1 ‘Energy-related Technologic and Economic Evaluation’ of the Cluster of Excellence eniPROD, Neugebauer, R.; Götze, U.; Drossel, W.-G. (Eds.), pp. 283–298, Wissenschaftliche Scripten, Chemnitz, 2013.
11. Matthes, K.-J., Welding Technology [original title: Schweißtechnik - Schweißen mit Metallischen Konstruktionswerkstoffen], 5th ed., Carl Hanser, Munich, 2012.
12. Purslow, M. A., Reducing the Ecological Impact of Arc Welding. Weld. J., 91, 24–27, 2012.
13. German Institute for Standardization, DIN 8580 Manufacturing Processes – Terms and Definitions, Division, 2003.
14. Kellens, K., Dewulf, W., Overcash, M., Hauschild, M. Z., Duflou, J. R., Methodology for Systematic Analysis and Improvement of Manufacturing Unit Process Life-cycle Inventory (UPLCI) - CO2PE! Initiative (Cooperative Effort on Process Emissions in Manufacturing). Part 1: Methodology Description. Int. J. Life Cycle Assess., 17, 69–78, 2012.
15. Wichita State University, Manufacturing Unit Process Life-cycle Inventory Heuristics, http://cratel.wichita.edu/uplci/, 2014.
16. Fink, D. G., Beaty, H. W., Standard Handbook for Electrical Engineers, 11th ed., McGraw-Hill, New York, 1978.
17. World Steel Association, Life Cycle Inventory Data, https://www.worldsteel.org/steel-by-topic/life-cycle-assessment/about-the-lci.html, 2016.
18. The Aluminum Association, The Environmental Footprint of Semi-Finished Aluminum Products in North America, http://www.aluminum.org/sites/default/files/LCA_Report_Aluminum_Association_12_13.pdf, 2013.
19. National Renewable Energy Laboratory (NREL): U. S. Life Cycle Inventory Database, http://www.nrel.gov/lci/, 2012.
20. Centre for Life Cycle Inventories: The ecoinvent Database, http://www.ecoinvent.org/, 2016.
21. ASM International, ASM Handbooks Online – Edge Preparations, http://products.asminternational.org/hbk/index.jsp, 2016.
22. MEADinfo – Mechanical engineers information hub, Weld Types and Edge Preparations, http://www.meadinfo.org/2009/04/weld-types-edge-preparations.html, 2015.
23. Kalpakjian, S., Schmid, S. R., Manufacturing Processes for Engineering Materials, 5th ed., Pearson Education, NJ, 2007.
24. Kalpakjian, S., Schmid, S. R., Manufacturing Engineering and Technology, 4th ed., Prentice Hall, NJ, 2000.
25. Schenk, M., Wirth, S., Müller, E., Factory Planning Manual – Situation-Driven Production Facility Planning, Springer, Berlin, Heidelberg, 2010.
26. Uttrachi, J., MIG Shielding Gas Control and Optimization, http://www.netwelding.com/shielding_gas_control_download.pdf, 2016.
27. Engelmann, J., Methods and Tools for Planning and Designing Energy-efficient Factories [original title: Methoden und Werkzeuge zur Planung und Gestaltung energieeffizienter Fabriken], PhD thesis, Chemnitz, Germany, 2009.
28. Hopf, H., Müller, E., Modeling of Energy-Efficient Factories with Flow System Theory, in: Advances in Production Management Systems. Sustainable Production and Service Supply Chains, Prabhu, V., Taisch, M., Kiritsis, D. (Eds.), pp. 135-142, Springer, Berlin, Heidelberg, 2013.
29. Müller, E., Stock, T., Schillig, R., A Method to Generate Energy Value-streams in Production and Logistics in Respect of Time and Energy Consumption. Prod. Engineer., 8, 243-251, 2014.
30. Krones, M., A Method to Identify Energy Efficiency Measures for Factory Systems Based on Qualitative Modeling, Springer Vieweg, Wiesbaden, 2017.
31. Müller, E., Löffler, T., Energy Efficiency at Manufacturing Plants – a Planning Approach, in: Proceedings of the 43rd CIRP International Conference on Manufacturing Systems, 2010.
32. U. S. Department of Energy, Energy Efficiency and Renewable Energy, Energy Tips – Compressed Air, Determine the Cost of Compressed Air for Your Plant, https://www.energystar.gov/ia/business/industry/compressed_air1.pdf, 2004.
33. Audi, Corporate Responsibility Report, http://www.audi.com/content/dam/com/EN/corporate-responsibility/audi_corporate_responsibility_report_2012_en.pdf, 2012.
34. ABB, Technical Application Papers No. 8 Power Factor Correction and Harmonic Filtering in Electrical Plants, https://library.e.abb.com/public/4704e67320c08992c1257870002e4700GSDC007107G0202.pdf, 2010.
35. Galvery, W. L., Marlow, F. B., Welding Essentials – Questions and Answers, 2nd ed., Industrial Press, South Norwalk, CT, 2006.
36. Overcash M., Twomey J., Kalla D., Unit Process Life Cycle Inventory for Product Manufacturing Operations, in: Proceedings of the ASME International Manufacturing Science and Engineering Conference, 2009.
37. Isaacs J., Twomey J., Overcash M., Unit Process Life Cycle Inventory: a Project in Environmentally Benign Design and Manufacturing, in: MIT Workshop on Manufacturing, 2009.
38. ESAB, Submerged Arc Welding, www.esab.co.kr/Web-App/Upload/2012/04/05/SUBMERGEDARCWELDING.pdf, 2012.
39. Cozens, M., Fillet Welded Joints – a Review of the Practicalities, http://www.twi-global.com/technical-knowledge/job-knowledge/fillet-welded-joints-a-review-of-the-practicalities-066/, 2003.
40. AWS, Structural Welding Code, AWS D1.1-Rev 2-77, 2009.
41. Stewart, J., The Welder’s Handbook, Reston Publishing, Reston, VA, 1981.
42. Gardner Denver, Flux Recovery Selection Guide, https://www.red-d-arc.com/pdf/Invincible%20Manual%20682.pdf, 2009.
43. Mishra, R. S., Ma, Z. Y., Friction Stir Welding and Processing. Mater Sci Engineering, 50, 1–78, 2005.
44. Mishra, R. S., Introduction, in: Friction Stir Welding and Processing, Mishra, R. S., Mahoney, M. (Eds.), pp. 1–5, 2007.
45. D’Cunha, K., Predicting Energy Consumption during Friction Stir Welding. MSME Thesis, University of Wisconsin-Madison, 2011.
46. Fridriksson, L., Non-productive Time in Conventional Metal Cutting, Report No. 3, Design for Manufacturability Program, 1979.