
Chapter 3
Materials Processing
Karl R. Haapala1*, Sundar V. Atre1,3, Ravi Enneti2, Ian C. Garretson1,4 and Hao Zhang1,5
1School of Mechanical, Industrial, and Manufacturing Engineering, Oregon State University, Corvallis, USA
2Global Tungsten and Powders Corp., Towanda, PA, USA
3Department of Mechanical Engineering, J.B. Speed School of Engineering, University of Louisville, Louisville, KY, USA
4Department of Mechanical and Aerospace Engineering, University of California, Davis, USA
5School of Integrated Science, James Madison University, Harrisonburg, VA, USA
*Corresponding author: [email protected]
Abstract
The last two centuries have witnessed an explosion in the types of materials available for engineering applications. These materials have led to transformative advancements, for example in civil infrastructure, medical devices, military technology, consumer products, and communications. To enable the transformation of materials technology from research and development to industrial applications, materials processing technology has required concurrent technological advancements. Many innovations in research and development have focused on improving quality, yields, and material utilization, while also reducing processing time and production costs; yet material processing remains one of the most impactful and energy intensive phases of the product life cycle. Current research, development, and industry practice is focused on opportunities to improve the energy efficiency of material processing through novel materials, processes, and equipment, as well as systemic changes such as facility operations, supply chains, and material recovery and recycling systems. This chapter provides an overview of the steel, aluminum, titanium, and polymer industries and describes their related materials processing technologies. In addition, emerging technologies and practices that are targeting improved energy efficiency of material production will be discussed.
Keywords: Materials processing, energy efficiency, steel, aluminum, titanium, polymer
3.1 Steel
Steel is the material of choice for many elements of manufacturing, construction, transportation, and various consumer products. As a critical industry to the economy, the value of goods produced by the U.S. iron and steel industry and ferrous foundries was estimated at $103 billion in 2011 [1]. This accounted for 5.6% of global crude steel production and provided over 86 million tons of crude steel in 2011 [2]. Global steel output has continuously increased, with 716 Mt produced in 1980 and 1527 Mt in 2011 (Figure 3.1).
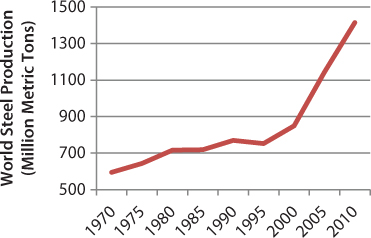
Figure 3.1 World crude steel production, 1970 to 2010 [2].
Steel production is energy intensive. In 2006, the industry used 1.48 quadrillion Btu (1560 PJ) of primary energy [3], amounting to $6.69 billion in energy costs for heat and power [4]. As one of the largest energy consumers in the manufacturing sector, the iron and steel industry relies heavily on coal and natural gas for fuel. Energy efficiency improvements, however, led to a 50% reduction of energy use per unit of crude steel production from 1975 to 2004 (Figure 3.2).
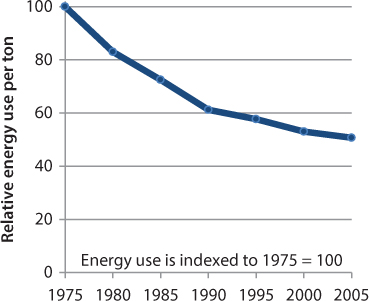
Figure 3.2 Total energy consumption of crude steel production for North America, Europe, and Japan, 1975 to 2005 [5].
Environmental impact remains a concern. It is estimated that if steel business continues as usual, CO2 emissions are estimated to increase by about 3.5 Gt in 2050 from about 2.0 Gt in 2008 [6]. Thus, technologies must continue to advance to increase the energy and materials efficiency of the production of steel. The main primary production routes are basic oxygen furnace (BOF), open hearth furnace (OHF), and electric arc furnace (EAF), which are discussed in greater detail below.
3.1.1 Steelmaking Technology
The basic oxygen process (BOP) converts carbon-rich molten pig iron into steel. It was developed in 1948 by Robert Durrer and commercialized five years later by Austrian VOEST and ÖAMG [7]. Modern furnaces take a charge of iron of up to 350 tons. The basic oxygen furnace (BOF) has a cycle time of about 25 to 45 minutes to produce a heat of steel [8]. Steel scrap, which is selected based on its chemical composition, is fed into the pear-shaped charge furnace. Next, the molten iron, or hot metal, which has been produced in a blast furnace, and fluxing agents, usually lime and dolomite, are added to the charge furnace. Usually the metallic charge contains 70% to 80% hot metal and 20% to 30% scrap [9]. The vessel is then set upright, and a water-cooled lance that blows 99% pure oxygen is lowered into it. This ignites the carbon dissolved in the steel and forms carbon monoxide and carbon dioxide, causing the temperature to rise to about 1700°C. The steel is further refined by adding alloying materials to give the steel special properties required by the customer. Slag is formed in the process, which absorbs impurities of steelmaking, and is poured off and cooled after the steel is tapped, or removed [10].
The oxygen hearth furnace (OHF) process has a similar sequence to the BOF and a cycle time of about 4 to 10 hours for each heat cycle [8]. OHF is not commonly used in the United States and Europe. The OHF accommodates less flexible combinations of scrap and molten iron (commonly 50/50), and melting is assisted with gas burners. Pig iron and any added scrap are charged into a rectangular, covered hearth where burning fuel gas passes over the materials, providing heat to promote the chemical reactions. The flue gas, which is preheated to an elevated temperature, is introduced through ports at each end of the furnace. The carbon, silicon, and manganese in the bath are oxidized both by the oxygen in the furnace atmosphere and that contained in the iron ore fed into the bath, all three of which could be reduced to as low a limit as was possible in the Bessemer process [11]. The open hearth process became the dominant process in the United States in 1800s, but fell out of use in the early 1990s [12]. The last open hearth melt shop closed at Geneva Steel Corporation at Provo, Utah in 1991. Worldwide, there are only a relative few open hearths still producing steel [11].
An electric arc furnace (EAF) heats charged material by means of an electric arc and lanced oxygen. The first electric arc furnaces were developed by Paul Heroult of France, with a commercial plant established in the United States in 1907. EAFs often utilize a 100% scrap charge to make carbon steel, in 1.5 to 5 hours, or alloy steel, in 5 to 10 hours [8]. Use of scrap greatly reduces the energy required to make steel when compared with primary steelmaking from ores. Also, the EAF can be rapidly started and stopped, allowing a steel mill to vary production according to the demand. An EAF consists of a refractory-lined vessel, usually water-cooled in larger sizes. It is covered with a retractable roof, through which one or more graphite electrodes enter the furnace [13]. The process for a small steel foundry EAF consists of the following five steps: 1) material is charged into furnace (e.g., scrap, pig iron, and lime), 2) the furnace is powered on to melt the material, 3) oxygen is added to oxidize the elements, 4) the melt is refined either through a single slag or double slag process, and 5) adjustments are made to the composition when the steel is tapped into the ladle [14]. Several environmental issues must be addressed in using EAFs, such as enclosures to reduce high sound levels, dust collectors for furnace off-gases, slag production and management, cooling water demand, heavy truck traffic for scrap, material handling, and product, and environmental effects of electricity generation.
3.2 Aluminum
Aluminum (Al) is a lightweight, soft, corrosion resistant, and nonmagnetic metal. It is commonly used in electrical wiring due to its high conductivity. It is used in structural applications for its strength and low weight. When compared to structural steel, aluminum can achieve equivalent strength at one-third of the weight. It is used in a variety of applications including construction, automotive, aircraft, containers, packaging, and machinery. It is used widely because it is abundant, the third most common element in the earth’s crust. The electrolysis process is straightforward and electricity remains relatively inexpensive today. Aluminum requires about 14 MJ/kg to produce [15].
3.2.1 Aluminum Alloying
Aluminum has a face-center cubic (FCC) crystal structure, which gives it a low melting temperature and ductility at a low temperature [16]. Pure aluminum is actually the second most malleable metal; gold is the first. Aluminum can be strengthened by alloying with other metals, common alloying elements are copper, magnesium, manganese, silicon, and zinc. Two common methods for alloying are solid solution and precipitation strengthening. Some specialty aluminum alloys have been named because they have outstanding characteristics, e.g., duralumin, magnalium, magnox, and silumin. Like titanium, a majority of aluminum alloys are corrosion resistant; an inert oxide layer will readily form on oxygen exposed surfaces.
Aluminum occurs naturally in over 150 different minerals, but nearly all aluminum metal is produced from the mineral bauxite. Bauxite is formed by the weathering of aluminous rocks (nearly all rocks contain aluminum), and occurs naturally in the temperate and tropic regions of the globe as a monohydrate (AlO(OH)) and a trihydrate (Al(OH)3), respectively. Because of bauxite’s high abundance, it is mined in over 40 different countries. Some of the main producers of bauxite are Australia, China, Brazil, India, New Guinea, Jamaica, the CIS, and Suriname. Alumina (Al2O3), or aluminum oxide, occurs naturally as the mineral corundum. When different impurities are present in this transparent crystal, it is commonly recognized as the gems ruby and sapphire. Bauxite is mined and then refined into alumina using the Bayer process. Alumina is subsequently processed into aluminum by the Hall-Heroult process. Cryolite (Na3AlF6) is a rare, naturally occurring mineral found in Greenland that is required for the production of aluminum; because of its rarity, it is produced synthetically from bauxite using the Bayer process, described in Section 3.2.5.
3.2.2 History of Aluminum Processing
The name for aluminum is derived from the Latin name alumen for alum (KAl(SO4)2).12H2O, which was used in ancient Greece and Rome as an astringent to stop bleeding [17]. Sir Humphry Davy is credited for naming the metal aluminum in 1807, but was unable to create pure aluminum. Hans Christan Oersted was the first to attain metallic aluminum in 1825 by reacting aluminum chloride (AlCl3) with potassium amalgamate. Frederic Wohler improved Oersterd’s process between 1827 and 1845 by using metallic potassium. In 1854 Henri Sainte-Claire Deville improved Wohler’s process by using sodium, and began the first commercial plant in Paris. All of these processes were chemical processes that required heating of an aluminum compound with another compound (K or Na); each inventor had attempted to create an electrolytic process, but electricity was too expensive at the time.
In 1886 both Charles Martin Hall (Ohio) and Paul L. T. Heroult (France) independently invented and patented the electrolytic reduction process commercially used today. The Hall-Heroult process involves the electrolysis of alumina that is dissolved in molten cryolite. Interestingly, before the Hall-Heroult process was invented, aluminum was more valuable than gold and was used by Louis III as cutlery. Discovery of the mineral bauxite and processing invention was independent to that of aluminum. Bauxite was first discovered in Les Baux, France in 1821 by the geologist Pierre Berthier. But it was not until 1888 that Karal Joseph Bayer first patented a process to refine bauxite into alumina, which is now known as the Bayer process. Today the Bayer process is coupled with the Hall-Heroult process in modern, low energy, aluminum refinement and processing.
3.2.3 Aluminum in Commerce
There are two resources for aluminum production, which are bauxite and recycled aluminum. The process using bauxite is called primary production and that using recycled scrap metal is called secondary production. Much less energy required is to process secondary production. Only 26 MJ is required to produce one kilogram of secondary aluminum [15], which is much less than the 211 MJ/kg for primary production. Aluminum scrap metal is designated as either new scrap or old scrap. New scrap is recycled from smelting or manufacturing processes, e.g., chips, and old scrap is recycled from end-of-life products. The largest source of recycled aluminum is beverage containers, which are subsequently used for the sole production of more beverage containers, using 15 MJ/kg [15]. In 2011, the United States recovered about three million tons of aluminum: 54% was new scrap, while 46% was old scrap [18]. A historical graph of the recovered materials and increasing use of recycled aluminum in secondary production can be seen in Figure 3.3.
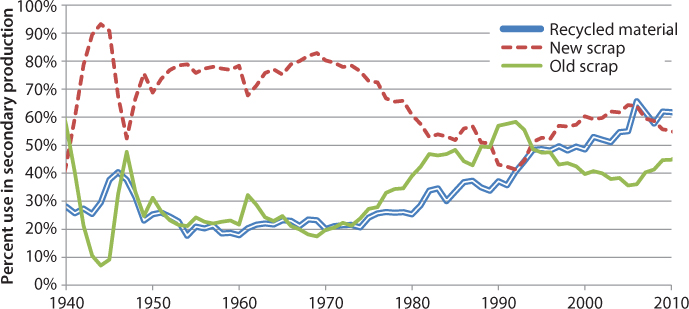
Figure 3.3 Secondary aluminum production in the United States, 1940–2010 [18].
The figure shows the fraction of aluminum produced from recycled origin in the United States over the past seventy years. The new scrap and old scrap are seen to directly offset each other. The fraction of recycled material content used in aluminum production slowly increased, from 28% in 1940 to 61% in 2010. This slow but significant increase shows the increasing reliance on recycled material. At the same time, however, overall aluminum production has increased exponentially globally and decreased slightly in the United States, as shown in Figure 3.4.

Figure 3.4 Global and United States production of aluminum, 1930–2012 [18].
Production of aluminum was stagnant until World War I, when it was utilized for the production of aircraft and automobiles [19]. Aluminum production again spiked during World War II, and in 1941 global production surpassed one million tons. In 1973, U.S. production passed five million tons, and, in 1999, U.S. production reached a peak of seven and a half million tons. In 2011, the United States produced just over five million tons of aluminum and global production passed 44 million tons. Production decreases in 2001 and 2009 can be correlated to the Asian financial crisis and the global financial crisis, respectively. These crises had little effect on aluminum price, however, as seen in Figure 3.5.

Figure 3.5 Market share and price of aluminum for the United States, 1940-2010 [18].
In the early twentieth century aluminum was priced at $14,000 per ton, which is high in comparison to today [19]. As prices declined, demand during World War I caused the price to spike up to $20,000 per ton. Later, in 1940, a price drop was intentionally caused by metal producers to promote competition with other metals, e.g., copper and steel. Increasing global demand (Figure 3.5) and closed production facilities caused the price per ton to nearly double from $1,830 in 1986 to $3,350 in 1988. Demand increase from Brazil, China, India, and Russia caused prices to rise until 2008, when the global financial crisis caused prices to plummet precipitously. After the crisis, investors with long-term contracts with primary producers through the London Metal Exchange (LEM) caused prices to normalize.
Figure 3.6 shows the aluminum end-use profiles between 1975 and 2003 [20]. Aluminum is used in a wide array of industries. Transportation accounts for automotive and aircraft, among other uses; containers include aluminum cans; consumer durables make up consumer goods; and electrical is mostly electrical wire. In 1975, the United States consumed 3.5 million tons and by 2003 consumption increased to 6.1 million tons. In 1975, 25% of aluminum was used for construction, 22% was for containers and packaging, and 19% was used for transportation. In 2003, construction use dropped to 16%, containers and packaging increased by 1%, and transportation had jumped up to 36%.
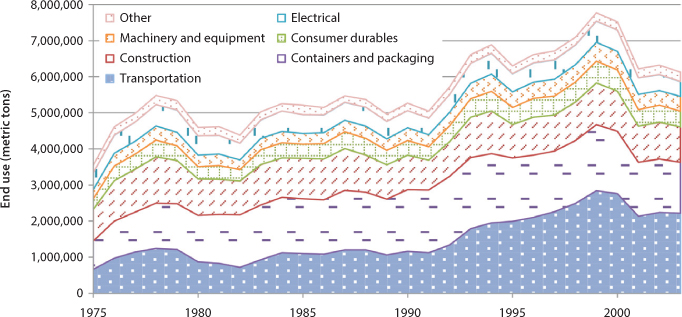
Figure 3.6 End uses of aluminum, 1975-2003 [20].
Since the global financial crisis of 2008, the aluminum industry has restabilized. The industry employed a total of 30,000 workers as of 2011, which was down from 39,600 in 2007 [1]. Globally, 2011 saw the reopening of many smelting plants from their closing in 2008 and 2009, including five companies operating ten primary aluminum smelters in the United States.
3.2.4 Aluminum Processing
Aluminum processing is differentiated between two sources, mined ore and recycled metal, which are named primary and secondary aluminum, respectively [15]. In primary aluminum production, bauxite is mined and undergoes Bayer processing to produce alumina at a refinery. Alumina is then sent to a Hall-Heroult processing facility, which produces aluminum using electrolysis. The electrolysis process requires electrically conductive carbon anodes and cathodes to guarantee chemical reaction. After electrolysis, the aluminum is smelted into stock shapes, i.e., blooms and billets. Primary aluminum production, from bauxite mining through ingot production, requires 13.8 MJ/kg of energy to produce one ton of aluminum [15]. Secondary aluminum is produced by recycling scrap material by heating it above the melting point of aluminum, but below that of iron, which would separate out the materials. The energy requirement to produce one kilogram of secondary aluminum can be approximated as that of ingot formation in primary production, about 156 kJ/kg, because all of the other processing steps have previously been accomplished [15]. Other metals can be utilized as by-products from primary metal production, e.g., gallium.
3.2.5 Bayer Process
The Bayer process includes the production of bauxite (AlO(OH)) or (Al(OH)3) into alumina (Al2O3). Some considerations that go into plant design and location include mineral grade, composition, location of the ore deposit, energy cost, infrastructure, demand, and environmental and corporate policies [21]. While there can be high variability between one plant and another, six common process steps to Bayer refineries are bauxite mining; raw mineral preparation; digestion; clarification, washing, and waste disposal; precipitation; and calcination.
Industrial average energy consumption for Bayer refineries is 156 kJ/kg of aluminum, which is not to be confused with producing one kilogram of alumina [15]. Prior to the Bayer process, mined bauxite is generally crushed to decrease particulate size, and washed to remove unwanted materials. In digestion, the bauxite, which is a mixture of minerals from the previous wash step, is dissolved in a solution of sodium hydroxide to selectively extract the aluminum bearing minerals as sodium aluminate (Al(OH)4). Because bauxite occurs as a monohydrate (gibbsitic, AlO(OH)) and a trihydrate (boehmitic and disporic, Al(OH)3), two different reactions describe the first step of the process, as can be seen below.

This step usually occurs in a steel pressure vessel, and conditions within the vessel are dependent of bauxite composition [21]. The temperatures and pressures required for gibbsitic bauxite are 140 °C and low pressure, while those for boehmitic and disporic bauxite 200–250 °C and upwards of 34 atm. More important is the concentration of the caustic solution, sodium hydroxide, which is commonly expressed in g/L of sodium oxide (Na2O). For gibbsitic and boehmitic bauxite, the concentration of the caustic solution is 120–135 g/L Na2O, while diasporic bauxite requires a much stronger 200–300 g/L Na2O. Note that these minerals are commonly found together, making this process challenging. The resulting solution is known as aluminum liquor or Bayer liquor, and is termed green liquor when the solution is saturated with aluminum and spent liquor when the solution is unsaturated.
Caustic degradation occurs during this first step while the liquor is exposed to the atmosphere and carbon dioxide reacts with it to form sodium carbonate (Na2CO3) [21]. Causticization is carried out to reverse this process by reacting hydrated lime (Ca(OH)2) with the sodium carbonate to yield sodium hydroxide, and is done during a by-product washing step. Other by-products are formed during the reaction process within the pressure vessel. These residue solids are made insoluble by high temperatures and long holding times and have high silica content.
Clarification is the process step to separate the residue solids from the green liquor by allowing particulates to settle out of the solution near the boiling point [21]. Clarification usually occurs in a racking thickener, which is a large circular container with a rotating arm to collect settled solids in a central outlet, and liquid is skimmed off the top. Flocculants are usually added to increase the amount of material that settles out. The liquor is further filtered to increase purity, and is then cooled to yield supersaturated concentration.
Prior to disposal, the waste (underflow) is washed or filtered to recover the remaining sodium hydroxide and recycle it back into the process. The waste is named red mud for its iron oxide content and high viscosity, and is the primary material waste to aluminum production. Red mud is produced at roughly a rate of two tons per ton of alumina [22], and at a yearly production rate of 70 million tons of red mud globally [23].
In precipitation, aluminum trihydroxide crystals (Al(OH)3) are obtained from the aluminum liquor [21]. This is a reverse of the digestion step, but results in high purity particles because the liquor has been purified and concentrated to supersaturated levels. To initiate precipitation at rapid rates, the Bayer liquor is seeded with fine gibbsite, which is produced previously from the same process [21]. Control of the process challenging because the interaction between process variables (e.g., specific precipitation rate (SPR), residence time, liquor concentrations, impurities, seeding, temperature) is not fully understood. Modern plants use ten or more internally agitated tanks placed in series to achieve continuous, gravity powered flow. The resulting liquor-seed slurry is then classified into an array of course to fine particle sizes using either hydroclassifiers or cyclones by elutriation. Fine particles are saved to be recycled as seed, and the course particles are washed in tanks using vacuum filter and are sent to be calcined.
Calcination, the final alumina processing step, is performed at 1100°C in either a fluid bed or a rotary kiln. This process changes the composition and crystal structure of the alumina, but retains the particle shape and size. Particles range in size from 20μm to 200μm. After calcination, the alumina is returned to room temperature [21]. Steam and impurities must be removed. Evaporation is used to remove steam, which is collected, and in high efficiency plants is used as a heat source; this recovery of energy from the steam can enable fuel efficiencies up to 85% and is integral to the aluminum industry.
3.2.6 Preparation of Carbon
One half a kilogram of carbon anode is consumed for each kilogram of aluminum produced [24]. Carbon ash from the electrolysis process can contaminate aluminum, and thus highly pure carbon is desired. Impurities such as vanadium or phosphorus are detrimental to electrolysis, and will consume valuable energy. Coke residue from petroleum refining is chosen as a highly pure source of carbon. This coke is usually produced at 500 °C, and is calcined at 1200°C to remove impurities and increase density. Calcined coke is then blended with recycled anodes and coal-tar (to hold it together), pressed into blocks, and then baked at 1000-1200°C. The anodes are manufactured with blind holes into which highly conductive steel stubs are inserted and secured with molten cast iron.
Carbon is also used as a lining for the cathode, which is the steel container itself (also called a pot). The blocks are produced in the same manner as above except that the blocks are mortared together and do not have steel leads. Either anthracite, graphite, or coke can be used to produce the cathode blocks, because purity is less important. This is because cathode consumption is much less than the anode, at 20–40 g/kg of produced aluminum. The energy requirement to produce a carbon anode is 88 kJ/kg of aluminum [15]. The energy requirement to produce anode per kilogram of aluminum can be estimated based on the usage rates of the anode within the electrolysis reaction; this is needed because the anode is produced in much larger amounts than to produce the aluminum.
3.2.7 Hall-Heroult Electrolytic Process
The Hall-Heroult process is the production of alumina (Al2O3) into pure aluminum (Al) by electrolysis. The set of reactions, described below, are the most energy intensive to the process requiring 11.4 MJ per kilogram of aluminum produced. First, alumina is dissolved into a molten cryolite bath at 920–980 °C, which is actually at a eutectic point of alumina (Al2O3, 10.5%wt) - cryolite (Na3AlF6) (Kirk-Othmer 2004a). One of the following catalysts is also added, which gives the temperature range above: calcium fluoride (CaF2, 4–8%wt), aluminum fluoride (AlF3, 5–13%wt), lithium fluoride (LiF, 0–7%wt), and magnesium fluoride (MgF2, 0–5%wt). Although not completely understood, the electrolysis reaction next described is accepted by most investigators. Cryolite (Na3AlF6) will ionize into sodium (Na) and (AlF6).
Next, the dissolution of alumina into cryolite is described by the equation below.
Electrolysis is carried out by ion transportation [21]. Aluminum is deposited, but, interestingly, sodium ions (Na+) initially carry the charge. It is surmised that the charge is transferred from the sodium to hexafluoraluminate ions, with fluoride ions neutralizing the sodium ions.
Finally, aluminate-oxyfluoride ions react with the carbon anode to yield carbon dioxide, which removes oxygen. Oxygen atoms on the left side of equation below are more difficult to remove than the first.

The combination of the sets of equations above yield the equation below, which describes the reaction of alumina with the carbon (C) anode to create pure aluminum and carbon dioxide.
In sum, the equations above estimate the actual reactions that take place during the electrolysis process, and what is actually known is represented by the final equation above, and that additional cryolite is not needed once the reaction begins because it is produced as a by-product during electrolysis [21].
3.3 Titanium
Titanium (Ti) is lightweight, strong, nonmagnetic, corrosion resistant, and the ninth most abundant element occurring in the earth’s crust. In terms of structural elements, it is the fourth most abundant. Thus, the question is raised: Why is titanium only used in seemingly specialized or high cost applications (e.g., jets, spinal screws, golf clubs, chemical plants, nuclear waste storage, and jewelry)? The main reason is that processing to refine the ore from its natural state into 99.9% pure Ti is highly energy intensive; in fact, it can take 361 MJ to produce one kilogram of titanium [25]. Interestingly, a majority of titanium production is for pigments [26]; the color is called titanium white or perfect white. Titanium dioxide (TiO2) has a very high refractive index that causes it to be brilliant white; thus, it is used to provide whiteness to book paper.
3.3.1 Titanium Alloying
Titanium alloys are generally classified as either corrosion resistant or structural, and are identified by their phase, alpha or beta. Titanium is alloyed to improve the crystal structure of either phase; the alpha phase is a hexagonal close-pack (HCP) structure, while the beta phase is a body centered cubic (BCC) structure. Different alloying elements will reinforce different structures, and often structural alloys will comprise both phases. Special application titanium alloys can have upwards of six alloying elements.
Corrosion-resistant alloys are often alloyed with oxygen as an interstitial solid solution; oxygen readily diffuses into titanium at room temperature and creates an oxide coating, causing the metal to become inert. Palladium, ruthenium, and aluminum are also alloyed with alpha phase titanium as substitutional solid solutions. Positive qualities of alpha phase alloys include high corrosion resistance, weldability, processing, and fabrication, but notably have very low strength. These alloys are generally used for tubing, heat exchangers, valves, and containers, and account for about 25% of the titanium alloy product market, as shown in Figure 3.7 [27]. The structural alloy Ti-6Al-4V (6% Al, 4% V) accounts for 60% of the total market, and miscellaneous structural alloys make up the remaining 15% [27]. Structural alloys are often alloyed with molybdenum, vanadium, niobium, iron, and chromium to form substitutional solid solutions. Most structural alloys have a mixture of both beta phase and alpha phase solid solution elements, and are referred to as near alpha, alpha+beta, beta, and titanium aluminide. The mechanical properties for a structural alloy are usually optimized for a specific application.

Figure 3.7 Global market share of titanium alloys [27].
Titanium naturally occurs in more than seventeen different minerals, but only the high content titanium dioxide minerals (rutile, ilmenite, and leucoxene) are mined [1]. The percentage of TiO2 in parentheses below is the stochiometric equivalent of TiO2 after refinement. Rutile (tetragonal TiO2, 93–96% TiO2) can be found in beach sands, and is mined in Australia, Sierra Leone, South Africa, and Ukraine. Ilmenite (FeTiO3, 40–70% TiO2) is found in hard rock and sand (appearing as black streaks), and is mined in Australia, Canada, China, India, Mozambique, Norway, South Africa, Ukraine, the United States, and Vietnam. Leucoxene (70–90% TiO2) is an alteration of ilmenite caused by weathering but is not recognized as its own mineral species; more weathering will cause higher equivalent purity.
Other Ti mineral deposits (e.g., anatase, brookite, and titanite) exist in other countries, but these have not yet been exploited due to the high purity of the current commercialized minerals [28]. High TiO2 content slag can be considered a source of titanium, but it is not a mineral. It is a product from smelting ilmenite and is an intermediary between the raw mineral and synthetic rutile, and is mentioned here because it is a significant import for the United States titanium industry.
3.3.2 History of Titanium Processing
Titanium was first discovered by William Gregor, a chemist, mineralogist, and clergyman, in Great Britain in 1791. Within a sample of magnetic (ferrous) black sand, he found a nonmagnetic, white substance (rutile), which he termed menachite [29]. Around the same time, an Austrian mineralogist and mining engineer, Franz Joseph Muller, found a similar, unidentifiable substance. Titanium was later identified in 1795 by Martin Heinrigh Klaproth, a now well renowned analytical chemist. While in Hungary, he discovered an unknown metal within rutile which he named titanium, after the Titans of Greek mythology [30]. He later detected titanium in ilmenite and titanite, and demonstrated that his titanium was identical to the metal found in manaccanite.
Pure (99%) titanium sponge was first produced in 1910 by Matthew A. Hunter in the United States, using a process now known as the Hunter process, which is described in greater detail in Section 3.3.7. Commercialization of titanium pigment began around 1916 (using the chloride process described below), but commercial processing of pure titanium began only after the Kroll process was developed in 1932 by William J. Kroll, a metallurgist from Luxembourg. Kroll’s process was much like Hunter’s process, but used magnesium instead of sodium to achieve pure titanium. The significance of the Kroll process lies in the ability to recycle the by-products for further use. The Hunter process outputs aqueous NaCl (brine) and is discarded after every use, whereas the Kroll process outputs MgCl2, which can be recycled into Mg and Cl2 through electrolysis, and greatly reduces the material waste [31]. In-depth description of titanium processing will be covered later in this chapter.
3.3.3 Titanium in Commerce
Today, the titanium metal industry is growing as new technologies and applications are being developed for the metal. If we compare the United States importation of all titanium raw materials (i.e., natural rutile, synthetic rutile, ilmenite, and slag) to the consumption of titanium sponge, which is used for casting titanium ingots required for all Ti metal products, we can see that the titanium metal industry (5%) is minuscule as compared to the pigment industry (95%) in Figure 3.8. Now, if we compare the average cost of rutile and slag, about $645/ton and $458/ton, respectively, to the average cost for sponge, which is about $9,930/ton, we can infer why titanium is not abundantly used. The costs associated in refining the raw mineral into pure metal are very high.

Figure 3.8 Titanium sponge consumption compared to mineral importation, 1928–2011 [28, 32, 33].
When we inspect the titanium metals industry, the aviation industry dominates the market. Production of titanium sponge began in 1948 and was driven by both military and commercial aerospace industries, as seen in Figure 3.9. Though aircraft manufacturers purchased 80% of all sponge in 1975, however, this fraction has gradually decreased to 60% in 2011 [34]. This change reflects the slowly decreasing cost of producing sponge, and the increasing application of titanium in specialized applications (e.g., golf clubs, MRI machines, and medical implants).

Figure 3.9 End uses of titanium sponge metal, 1975-2004 [34].
Although the percentage of titanium sponge destined for aircraft has fallen over the years, the fluctuation in consumption has historically been dependent on both the military and commercial aerospace industries [19]. Although the titanium industry displays a growth trend, the industry has fluctuated significantly. The events provided in Figure 3.10 are significant to the downswings of titanium consumption, and could give reason as to why more growth has not occurred. Interestingly, the sponge price remains fairly stable as compared to sponge use. The aviation industry has helped to stabilize titanium sponge price due to long term contracts between metal suppliers and parts manufacturers, but titanium sponge prices tend to lag behind market conditions due to annual supply negotiations (sponge consumption), which can be correlated to aircraft orders.

Figure 3.10 Titanium sponge price and consumption, along with several major global events, 1941-2011 [19, 35].
3.3.4 Titanium Processing Methods
The processing of titanium from minerals is quite energy intensive, and historically has required several processing steps to yield a desired purity. The pure titanium made by the processes below is called titanium sponge. After pure titanium sponge is made, it is further refined to make ingots; titanium ingots are usually large cylinders, as they take the shape of the furnace used. Ingots are then processed into intermediate stock shapes, e.g., blooms, slabs, and billets by rolling. The intermediate shapes can then be processed into final shapes, e.g., bars, rods, or sheets, by rolling, or aircraft parts by machining.
The stages of titanium processing produce raw minerals, synthetic rutile (TiO2), titanium sponge, alloyed ingot, intermediate stock, and finished product. First, the raw minerals must be processed into high purity titanium oxide, which is called synthetic rutile; it is synthetic because it cannot be found naturally at the purity required. The sulfate and chloride processes below are used to refine raw ore into synthetic rutile, and are chosen based on the TiO2 content of the raw mineral. The Hunter and Kroll processes are used to make titanium sponge from synthetic rutile. Finally, the processes discussed below under the emerging technologies section are being researched as higher efficiency commercial processes than existing technologies.
3.3.5 Sulfate Process
Low TiO2 content minerals (e.g., ilmenite) must be processed into synthetic rutile using the sulfate process [27]. First, the ilmenite is treated with sulfuric acid at 180 °C, which results in titanyl sulfate (TiSO4) and must be separated from other products (e.g., iron sulfate and water) and cooled to room temperature. The titanyl sulfate is then heated to 90 °C, which hydrolyzes into titanyl hydroxide (TiO(OH)2). Finally, the titanyl hydroxide is calcined (heated below melting temperature in the absence of air) to 1000 °C to produce TiO2. This high purity TiO2 can then be processed to pure titanium using either the Hunter or Kroll process described below.
3.3.6 Chloride Process
High TiO2 content minerals (e.g., rutile) must also be processed into synthetic rutile, but will use the chloride process (Kirk-Othmer 2004b). The high TiO2 minerals will first be chlorinated in the presence of coke, or another carbon source, at 1000 °C; the reaction results in titanium tetrachloride (TiCl4), other chlorides, and carbon monoxide (CO). The TiCl4 is then distilled to a high purity, and separated from the other chlorides. The titanium chloride is then oxidized at near 1000 °C to yield pure TiO2, and the chlorine can be recycled. The TiO2 produced here can be used for pigments. In the Hunter and Kroll processes below, the titanium tetrachloride is not oxidized, but is reduced.
3.3.7 Hunter Process and Kroll Process
Production of pure titanium metal is done through a process of chlorinating rutile (TiO2) in the presence of a carbon source (e.g., coke), which results in titanium tetrachloride (TiCl4.) [36]. The TiCl4 is then distilled to high purity. Finally, it is reduced to titanium sponge by either the Hunter process or the Kroll process.
The Hunter process (sodium reduction process) reduces titanium tetrachloride by heating it to 800°C in the presence of sodium (Na). The by-product is sodium chloride (NaCl), which is removed. This process results in higher purity titanium but is more costly, and correspondingly less efficient, than the Kroll process and is only used for special applications, e.g., electronics.
The Kroll process (magnesium reduction process) reduces titanium tetrachloride by heating it to 900 °C with excess liquid magnesium (Mg) in an inert reactor with an inert atmosphere (He or Ar) [27]. The reaction results in pure titanium sponge and magnesium chloride (MgCl2). The titanium sponge is then purified, removing magnesium and titanium chloride products (e.g., MgCl, TiCl3, and TiCl2), which can be done using an acid bath, vacuum distillation, or an argon sweep. The MgCl2 can be recycled into magnesium metal and chlorine gas using electrolysis. The recovery of magnesium in the Kroll process uses a third less energy as compared to the recovery of sodium in the Hunter process [31]. The Kroll process is the main commercial process used to produce pure titanium metal.
3.3.8 Remelting Processes
Several more steps are needed to yield usable stock after producing the pure sponge, which greatly affects the amount of energy required to process the titanium, and can double the cost of titanium [31]. These steps include remelting, conditioning, rolling, and annealing, and often have to be repeated. The processing of ingots into stock creates an oxidized surface layer, which has to be removed, and increases cost and decreases utilization. There have been efforts to improve the Kroll process in the last 60 years; some notable improvements introduced below include vacuum arc remelting (VAR), cold hearth melting, and electroslag remelting (ESR).
VAR is now the conventional method for titanium ingot production. It involves creating a titanium electrode that is melted in a furnace and then solidified in a copper crucible. Often, the process has to be repeated several times to increase alloy strength and composition uniformity. High costs are incurred from electrode preparation, multiple melting sequences, and repeated conditioning. The cold hearth process involves remelting the titanium in a series of copper crucibles, with the final stage being cooled. It can produce a continuously cast ingot, slab, billet, or bloom. This process can reduce the amount of remelting required for VAR and improve scrap utilization; but it does not yield an equivalent strength metal to VAR. ESR, like VAR, requires an electrode, but this electrode is dipped into molten slag rather than directly melted. As the titanium electrode melts it first falls through the molten slag, which purifies it, before solidifying in a copper crucible at the bottom of the furnace. This method can result in improved compositional uniformity, and can produce rectangular slabs like cold hearth.
3.3.9 Emerging Titanium Processing Technologies
In 2004, the U.S. Department of Energy analyzed a multitude of emerging titanium processes to identify new energy reducing technologies [37], as shown in Table 3.1. As these technologies are still under development, or are protected by trade secrets, the specific energy savings as compared to the Kroll Process is still unknown; some are estimated to be of equivalent energy usage (e.g., the Armstrong Process), while some powder processes project possible 50% reduction in energy usage through elimination of processing steps. Norgate, Rajakumar, and Trang [25] estimate the FCC Cambridge process and the CSIRO process are to use 317 MJ and 321 MJ to produce one kilogram of titanium, respectively, but stress that these should not be used for calculations.
Table 3.1 Emerging titanium processing technologies (Kraft 2004).
| Organization (process name) | Process | Product types |
| Cambridge University (FFC Cambridge Process) | TiO2 electrochemical reduction using molten CaCl2 | Powder, Sponge |
| Cristal Metals (Armstrong Process) | TiCl4 vapor reduction using Na liquid | Powder |
| CSIR; South Africa | TiCl4 reduction using H2 | Sponge |
| CSIRO; Australia (Plasma Powder Process) | TiCl4 plasma reduction using Ar and H2 | Powder |
| GTT s.r.l. (Ginatta Process) | TiCl4 vapor electrochemical reduction using molten halide electrolyte | Liquid, Slab |
| Idaho Research Foundation | TiCl4 liquid mechanochemical reduction using MgH2 or CaH2 powder | Powder |
| Idaho Titanium Technologies | TiCl4 plasma reduction using H2 | TiH2 Powder |
| Kyoto University (OS Process) | TiO2 calciothermic reduction using Ca, CaO, or CaCl2 solutions, and C anode | Powder, Sponge |
| MER Corp. | TiO2 electrolytic reduction using Mg | Powder, Flake, Slab |
| MIR Chem | TiO2 reduction using I2 | Particles |
| Quebec Iron and Titanium | Ti slag electrolytic reduction using C anode, and CaF2 electrolyte | Liquid |
| University of Tokyo (EMR/MSE Process) | TiO2 electrolytic reduction using Ca-Ni alloy, C anode, and CaCl2 solvent | Powder |
| University of Tokyo (Preform Reduction Process) | TiO2 reduction using Ca vapor and CaO or CaCl2 flux | Powder |
| Vartech Inc. | TiCl4 vapor reduction using AlCl3 gas | Ti-Al Powder |
It is interesting to note that the MER Corp. process uses the same chemistry as the Kroll process, but the reactants are produced in situ, meaning the refinement and smelting processes occur in one chamber with the reactants flowing cyclically. It is not known if the MER Corp. process would reduce the required energy to produce titanium metal as compared to the conventional Kroll process. Other issues arise in industrial research and development of new processes. Although there are great energy saving possibilities with the development of powder processing, possible issues include residual contamination of alloys from binder (causing less than desired characteristics), pyrophoric (spontaneously combusts when exposed to air), and a low developed market. A goal for the titanium industry is to develop a process similar to the Bayer (refinement) and Hall-Heroult (electrolytic reduction) processes for aluminum; a solvent similar to cryolite, but usable for TiO2 has not emerged, however.
3.4 Polymers
Polymers are long-chain molecules typically synthesized from petroleum derivatives and have molecular weights ranging from 104 to 106 g/mol [38]. The global production of polymers has rapidly grown during the last 50 years, as seen in Figure 3.11, and was reported to be nearly 290 million metric tones in 2012, with corresponding annual sales of about US $400 billion [39].
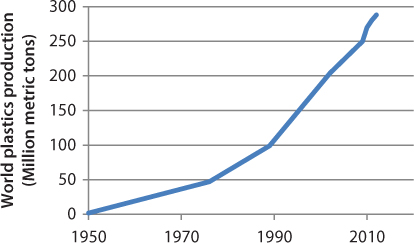
Figure 3.11 Global production of plastics, 1950–2012 [39].
There is a regional dependence on the manufacturing of polymer products based on the type of polymer. Figure 3.12 shows the percentage consumption of major polymers in the U.S. in 2012 [40]. Common recyclable thermoplastics, e.g., polyethylene (PE), polypropylene (PP), polyvinyl chloride (PVC), and polystyrene (PS), accounted for over 70% of production, on a mass basis.
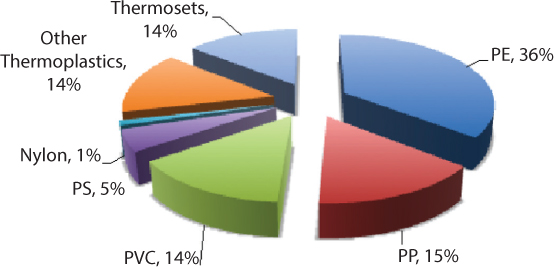
Figure 3.12 Polymer products manufactured in the United States, 2012 [40].
Polymers can be produced using a number of processes, as shown in Figure 3.13. It can be seen that injection molding, extrusion, and blow molding account for nearly 80% of production for manufactured polymer products [41]. The various processes are useful for making specific shapes and production quantities, and other factors. Figure 3.14 provides a relative comparison of polymer manufacturing processes based on five metrics. In the figure a higher number is indicative of relatively superior performance [42].

Figure 3.13 Fabrication processes used in manufacturing polymer products [41].
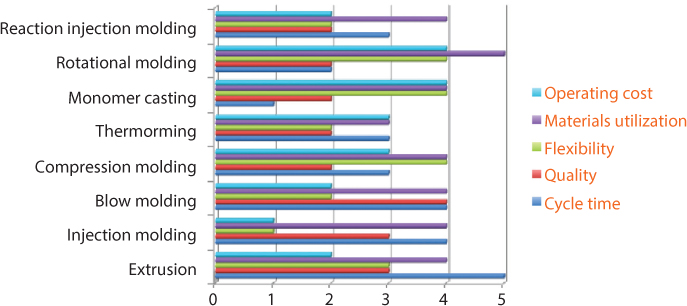
Figure 3.14 Comparison of common polymer manufacturing processes [42].
The annual energy consumption during the manufacturing of polymer resins and products is estimated to be 1.1 quadrillion Btu (1160 PJ) in the U.S. and represents 6% of the overall energy consumption by the manufacturing sector [43]. Advantageously, however, polymers offer considerable energy savings in automotive and aerospace applications due to their lighter weight compared to steel and aluminum. Polymers are used in thermal and electrical insulation and are critical components in renewable energy production, e.g., wind turbines and solar panels. Therefore, it is appropriate to examine the overall impact of polymer products on future societal energy use by quantitatively analyzing their contributions.
Injection molding of polymers filled with metal/ceramic fillers is the primary technology to manufacture complex netshape parts requiring superior properties [44]. Analysis of the manufacturing of polymers in the context of metal processing industries covered earlier in the chapter is possible by examining the rapidly emerging field of fabricating metal (and ceramic) components using hybrid powder-polymer techniques. Powder metallurgy (P/M) consists of compacting particulate material to the desired shape in a die cavity followed by heating the compacted shape to a temperature below the melting point of the metal. During the thermal stage, inter-particle bonds form to increase strength, in a process called sintering. Traditional P/M is best suited for the production of relatively small components (1–1000 g) of intermediate complexity, relatively large production runs (>100,000 units) and an axis of symmetry in the geometry.
During the last decade, powder injection molding (PIM) has emerged as a viable forming method for small shapes of greater complexity than traditional P/M. PIM is a multistep process that combines the formability of plastics and superior material properties of ceramics to form high performance components. Ceramic powder is compounded with polymers and used to mold parts in an injection molding machine. The molded part is then subjected to binder removal (debinding) and a sintering process held to specific property dependent parameters to produce the desired part. Global sales of PIM exceeded $1.5 billion in 2012 [45]. The ~20% annual growth rate of the PIM industry, when the rest of the manufacturing sector was experiencing considerable struggle during the economic downturn, is particularly noteworthy. By extending these polymer-powder hybrid manufacturing approaches to green machining and casting, it is anticipated that we can overcome many of the energy consumption-related and other environmental problems associated with traditional casting and machining of larger, complex metal components through new forming paradigms. These include hybrid polymer-assisted shaping and sintering technologies.
Traditional materials processing techniques such as casting, forging, machining, and powder metallurgy have severe limits with regard to size and performance (complexity, tolerances, etc.). Moreover the materials that can be easily processed are limited. Casting and forging are generally limited to metals, while traditional sintered materials technology is applicable to a broader range of materials. While applicable to a broad range of materials, the machining of ceramics, titanium and titanium alloys, nickel and nickel alloys, and hard steels is difficult and expensive. Powder-polymer processing, green casting, and green machining will significantly expand the design window [46].
In general terms, the green casting and green machining processes do have some similarities to other slurry casting techniques explored in ceramics processing and, as such, provide support to the proposed new manufacturing paradigms. During the last decade, a host of such methods have been reported, such as gelcasting, direct coagulation casting, freeze molding, hydrolysis assisted solidification, low pressure molding, starch consolidation, and centrifugal slip casting. Among these, perhaps gelcasting has been the most widely reported technique with successes reported in the fabrication of several large silicon nitride engine components as well as fabrication of tool steel and superalloy components, in the case of metals. Notably, efforts towards using gelcasting on a production scale have intensified. Gelcast bodies have also been used in green machining; however, little information is available on dimensional capabilities.
In the current context of enhanced material utilization and associated reductions in energy intensity, the use of organic cross-linking monomers and polymers inherently limits the material usage of gelcasting in both casting and machining, since sprues, runners, fill cups, chips, and rejects cannot be easily recycled into the process. Further, little attention is paid to generalized mold design principles based on component size from a casting perspective. Additionally, reduced powder loadings in the casting suspension to allow low viscosities to aid in formability result in greater sintering shrinkages and potentially lower dimensional control, a situation requiring post-machining to obtain necessary tolerances. In the case of metals, the Keltool process has achieved some success as a rapid prototyping technique but has not been systematically investigated for providing energy and environmentally efficient manufacturing routes. The differences outlined above set the approaches mentioned above apart from already established slurry casting routes. Examples of green cast and green machined sintered products in bronze and steel are shown in Figure 3.15.

Figure 3.15 Examples of shape complexity obtained with hybrid polymer-powder processes.
3.4.1 Life Cycle Environmental and Cost Assessment
While powder-polymer technologies have tremendous potential to address the environmental aspects of manufacturing and facilitate the use of powder metal and powder-based processing, methodologies to quantify energy budgets to assess the tradeoffs are necessary. A positive change in one environmental aspect (e.g., recycleability), for example, could lead to a negative change in another aspect (e.g., manufacturing energy use). The change may lead to additional impact on the cost of the product, as well. How does one justify the change of process technology and its broad impact over the areas of concern?
Although approaches have been developed to assist such analyses, they focus on limited aspects. One such methodology is environmental life cycle assessment (LCA). This method has been developed through efforts across different countries, leading to the ISO 14040 standard. LCA is a four-phase process that starts with defining the scope and boundaries of the study. The remaining areas of the study are (1) Life cycle inventory, in which the various inputs and outputs are defined for each selected process across the product life cycle; (2) Impact assessment, in which the environmental burdens identified are quantitatively or qualitatively characterized; and (3) Improvement analysis, in which improvement opportunities are combined with cost and other performance factors in an appropriate decision framework.
While the stages of LCA have been defined, each requires additional development. Product lifecycle costs are not integrated into the LCA framework, for example, nor are the improvement analyses associated with design for environment, total quality management, and various multi-objective decision-making methods. Integration and improvement of such approaches will assist in advancing technical success in green casting and machining, for example, with reasonable properties and precision, and also demonstrate the environmental, energy, and cost effectiveness of powder-polymer processing.
3.4.2 An Application of Polymer-Powder Processes
Power semiconductors play a key role in the semiconductor industries as a whole. Figure 3.16 represents the market distribution of power semiconductors in several sectors, including the integrated circuit, automobile, and home appliance industries. Packaging these power semiconductor devices provides thermal management, electrical insulation, mechanical strength, and chemical inertness. Polymers (e.g., epoxies and urethanes) and metal alloys (e.g., Kovar and W-Cu) are used as packaging materials for power semiconductors because of their high thermal stability and electrical and chemical resistance. Techniques such as tape casting, slip casting, hot pressing, and PIM have been used in the past. From Table 3.2, it can be inferred that PIM is ideal for high volume, cost effective production of complex parts over other fabrication techniques.

Figure 3.16 Market distribution of power semiconductor devices.
Table 3.2 Comparison of ceramic net-shaping processes.
| Characteristics | PIM | Hot pressing | Casting | Machining |
| Density | 90–100% | 95–100% | 95–99% | 100% |
| Surface Finish | 0.4 to 0.8 μm | <2 μm | 3 μm | 0.4 to 2 μm |
| Secondary Machining | Not required | Required | Required | – |
| Wall Thickness | 10 μm | >2 mm | >5mm | >2 mm |
| Dimensional Tolerance | Close | Poor | Poor | Poor |
| Shape Complexity | High | Medium | Medium | High |
| Production Rate | High | Medium | Low | Low |
A potential application of the PIM process is for electronics packaging. Epoxy is often used in this application, but ceramics offer better thermal performance and potentially longer life. One concern, however, is the relative energy consumption and environmental impact of ceramics-based electronic packaging manufacturing. A comparison of three material alternatives (i.e., epoxy, aluminum nitride, and silicon carbide) is shown in Figure 3.17, based on an a cradle-to-gate LCA [47].

Figure 3.17 Overall environmental impact of electricity and total materials and energy [47].
Since the study was unable to account for the difference in operational lifetime, and the functional unit selected was one device of each type. It is seen that the environmental impact of epoxy is negligible in comparison to both aluminum nitride and silicon carbide, primarily due to energy consumption. Using silicon carbide in injection molding is estimated to have 13% greater impact on the environment than using aluminum nitride. Economically, AlN also appears to be the superior choice to SiC, with an estimated 18% lower cost.
Although the foregoing shows that manufacturing an electronics packaging device using the epoxy method is the lowest cost and least impactful of the three methods, it should be reiterated that the device application and use phase impacts are not considered due to unknown use cycle performance and end-of-life fate. Applying a holistic evaluation through the inclusion of these additional life cycle phases could dramatically alter the cost and environmental impact assessments. It is clear, however, that the choice among different injection molding materials and manufacturing methods on a sustainability basis must consider multiple factors in the decision-making process. Thus, cost and environmental impact must be considered simultaneously with material and device functional performance at the earliest feasible phases of development.
References
1. Fenton, M.D., Mineral Commodity Summaries, U.S. Geological Survey, 2012.
2. World Steel Association, Crude Steel Production, 1980-2012, World Steel Association, Brussels, Belgium, 2013.
3. U.S. Department of Energy, Industrial Technologies Program: Improving the Energy Performance of U.S. Industry, Office of Energy Efficiency and Renewable Energy, U.S. Department of Energy, Washington D.C., USA, 2006.
4. U.S. Census Bureau, Annual Survey of Manufactures: Statistics for Industry Groups and Industries: 2005, U.S. Department of Commerce, Washington
D.C., USA, 2006.
5. World Steel Association, Sustainable Steel: At the Core of a Green Economy, World Steel Association, Brussels, Belgium, 2012.
6. Allwood, J.M., and J. Cullen, Sustainable Materials: With Both Eyes Open: Future Buildings, Vehicles, Products and Equipment - Made Efficiently and Made with Less New Material, UIT Cambridge, 2011.
7. Smil, V., Transforming the Twentieth Century: Technical Innovations and Their Consequences, Oxford University Press, Oxford; New York, 2006.
8. U.S. EPA, 12.5 Iron and Steel Production, in AP 42, Fifth Edition, Volume I, Chapter 12: Metallurgical Industry, U.S. Environmental Protection Agency, Washington D.C., USA, pp. 1–25, 1986.
9. Turkdogan, E.T., Fundamentals of Steelmaking, Institute of Materials, London, 1996.
10. McGannon, H.E. (ed.), The Making, Shaping, and Treating of Steel, United States Steel Corporation, Pittsburgh, PA, 1971.
11. Fruehan, R.J. (ed.), The Making, Shaping, and Treating of Steel, AISE Steel
Foundation, Pittsburgh, PA, 1998.
12. Stubbles, J., Energy Use in the US Steel Industry: An Historical Perspective and Future Opportunities, Energetics, Inc. and U.S. Department of Energy Office of Industrial Technologies, Washington D.C., USA, 2000.
13. Fink, D.G., and H.W. Beaty, Standard Handbook for Electrical Engineers, McGraw-Hill, New York, NY, 1978.
14. Sims, C.E., Electric Furnace Steelmaking, Volume 1 Design, Operation and Practice, Interscience Publishers, 1962.
15. U.S. National Renewable Energy Laboratory, US Life Cycle Inventory (USLCI): Data Discovery. https://www.lcacommons.gov/nrel/search, accessed 2013, 2013.
16. Callister, W.D.J., and D.J. Rethwisch, Applications and Processing of Metal Alloys, in Material Science and Engineering, John Wiley and Sons, 2010.
17. Greenwood, N.N., and A. Earnshaw, Aluminum, Gallium, Indium and Thallium, in Chemistry of the Elements, 2ed., Butterworth-Heinemann, Boston, MA, pp. 216–227, 1997.
18. Buckingham, D.A., P.A. Plunkert, and E.L. Bray, Aluminum Statistics, U.S. Geological Survey, 2012.
19. U.S. Geological Survey, Metal Prices in the United States through 2010, U.S. Geological Survey and U.S. Department of the Interior, Reston, VA, 2013.
20. Matos, G.R., and P.A. Plunkert, Aluminum End-Use Statistics, U.S. Geological Survey, 2006.
21. Sanders, R.E., Aluminum and Aluminum Alloys, in Kirk-Othmer Encyclopedia of Chemical Technology, vol. 2, Wiley-Interscience, Hoboken, NJ, pp. 279–343, 2004.
22. Tan, R.B.H., and H.H. Khoo, An LCA Study of Primary Aluminum Supply Chain. Journal of Cleaner Production, 13, p. 607–618, 2005.
23. Liu, Y., C. Lin, and Y. Wu, Characterization of Red Mud Derived from a Combined Bayer Process and Bauxite Calcination Method. Journal of Hazardous Materials, 146, p. 255–261, 2007.
24. Habashi, F., Aluminum, in Handbook of Extractive Metallurgy, vol. 2, Wiley-VCH, Weinheim, Chichester, pp. 1039–1127, 1997.
25. Norgate, T.E., V. Rajakumar, and S. Trang, Titanium and Other Light Metals - Technology Pathways to Sustainable Development. Green Processing Conference, p. 105–112, 2004.
26. Hartman, H.L., Light Metals, in SME Mining Engineering Handbook, vol. 1, Society for Mining, Metallurgy, and Exploration, Littleton, CO, pp. 72–73, 1992.
27. Froes, F.H., Titanium and Titanium Alloys, in Kirk-Othmer Encyclopedia of Chemical Technology, vol. 24, Wiley-Interscience, Hoboken, NJ, pp. 838–870, 2007.
28. Buckingham, D.A., J. Gambogi, and G.M. Bedinger, Natural and Synthetic Rutile Statistics, U.S. Geological Survey, 2012.
29. Krebs, R.E., Titanium, in The History and Use of Our Earth’s Chemical Elements: A Reference Guide, Greenwood Press, Westport, CT, USA, pp. 75–76, 1998.
30. Hampel, C.A., Titanium, in The Encyclopedia of the Chemical Elements, Reinhold Book Corp., New York, NY, pp. 732–735, 1968.
31. Gambogi, J., and S.J. Gerdemann, Titanium Metal: Extraction to Application, U.S. Geological Survey and the Department of Energy, Reston, VA, 2002.
32. Buckingham, D.A., J. Gambogi, and G.M. Bedinger, Titanium Mineral Concentrates Total, U.S. Geological Survey, 2012.
33. Buckingham, D.A., J. Gambogi, and G.M. Bedinger, Ilmenite and Titanium Slag, U.S. Geological Survey, 2012.
34. Buckingham, D.A., and J. Gambogi, Titanium Sponge Metal End-Use Statistics, U.S. Geological Survey, 2006.
35. Buckingham, D.A., J. Gambogi, and G.M. Bedinger, Titanium Sponge Metal Statistics, U.S. Geological Survey, 2012.
36. Habashi, F., Titanium, in Handbook of Extractive Metallurgy, vol. 2, Wiley-VCH, Weinheim, Chichester, pp. 1129–1180, 1997.
37. Kraft, E.H., Summary of Emerging Titanium Cost Reduction Technologies, EHK Technologies, Vancouver, WA, 2004.
38. Allcock, H.R., Contemporary Polymer Chemistry, Pearson/Prentice Hall, Upper Saddle River, NJ, 2003.
39. PlasticsEurope, Plastics - The Facts 2013: An Analysis of European Latest Plastics Production, Demand and Waste Data, PlasticsEurope, European Plastics Converters (EuPC), European Plastics Recyclers (EuPR), European Association of Plastics Recycling and Recovery Organisations (EPRO), Brussels, Belgium, 2013.
40. American Chemistry Council, U.S. Resin Production & Sales: 2012 vs. 2011, 2013.
41. Osswald, T.A., Understanding Polymer Processing: Processes and Governing Equations, Hanser Publications, Cincinnati, OH, 2011.
42. Edwards, L., and M. Endean, Manufacturing with Materials, Butterworths, Boston, MA, 1995.
43. U.S. EIA, Manufacturing Energy Consumption Survey (MECS 2010), U.S. Energy Information Administration, Washington D.C., USA, 2012.
44. German, R.M., Powder Injection Molding: Design and Applications, Innovative Material Solutions, State College, PA, 2003.
45. German, R.M., and S.V. Atre, Powder Injection Molding 2013 Market Study, SciPiVision, 2013.
46. German, R.M., S.V. Atre, and J. Thomas, Large, Low-Production Quantity Components via Polymer-Assisted Shaping and Sintering Technologies. P/M Science & Technology Briefs, 4, p. 9–13, 2002.
47. Sahakian, M.V., M.O. Brown, S.V. Atre, and K.R. Haapala, Environmental and Cost Assessment of Several Injection Molded Powder Electronics Packaging Materials. Proceedings of the ASME 2011 International Manufacturing Science and Engineering Conference, p. 569–575, 2011.