
Chapter 11
Manufacturing Facility Energy Improvement
Chris Yuan1*, Junling Xie1 and John Nicol2
1Department of Mechanical and Aerospace Engineering, Case Western Reserve University, Cleveland, OH, USA
2Department of Mechanical Engineering, University of Wisconsin-Milwaukee, Milwaukee, WI 53201
3Focus on Energy, Madison, WI, USA
*Corresponding author: [email protected]
Abstract
Manufacturing systems are energy-intensive. This chapter focuses on introducing the auxiliary energy consumers in a manufacturing plant and provides strategies to improve the energy efficiency of three major auxiliary energy consumers, including lighting, HVAC, and compressed air, to support energy-efficient manufacturing. This chapter begins with the working principles and characteristics of the three major auxiliary energy consumers, followed by facility energy management strategies along with some practical examples, including how to conduct an energy audit on a facility, how to develop a facility benchmark, how to identify opportunities and provide recommendations for actual improvement of the energy efficiency, and what steps are needed to implement an energy management plan for a typical manufacturing facility. In addition, this chapter addresses issues related to energy metering and tracking devices for system and facility monitoring. The chapter concludes with recommendations on energy consumption, energy management, and efficiency improvements for auxiliary industrial components.
Keywords: Energy efficiency, lighting, HVAC, compressed air, energy assessment, energy management
11.1 Introduction
Manufacturing operations require a number of supporting facilities such as lighting, HVAC (Heating, Ventilation and Air Conditioning), compressed air, pumping, process heating, cooling, cleaning, etc., to accomplish various manufacturing activities. These supporting facilities are mostly powered by electricity, while some directly burn fossil fuels on site for their operations. The amount of energy consumed by these auxiliary supporting facilities can be quite large, depending on their characteristics and the size of the manufacturing activities to be supported. In the year 2010, the manufacturing industry as a total consumed approximately 19% of the total energy in the United States [1]. Figure 11.1 shows the percentage of energy consumption of U.S. economic sectors, which are broken down to manufacturing and non-manufacturing sectors [2]. The energy consumption of manufacturing, as shown by the statistical data, is after transportation and residential, with 18.8 quadrillion Btu in 2010.

Figure 11.1 U.S. energy consumption by economic sectors.
The high energy consumption causes significant sustainability problems for the manufacturing industry from both economic and environmental perspectives. The amount of energy consumed by these auxiliary supporting facilities, either in the form of grid electricity or fossil fuels, adds costs to the manufacturing processes and the final products. Moreover, the energy consumed induces significant environmental problems due to the current energy being mainly supplied from fossil fuels. Since fossil fuels contain various polluting elements like carbon, sulfur, nitrogen, etc., the direct or indirect consumption of fossil fuels produce a variety of environmental pollutants. These environmental pollutants include carbon dioxide, sulfur dioxide, and nitrogen oxides, which cause environmental problems such as global warming, acidification, and smog. In Figure 11.2 below, U.S. electricity generation is shown by type of producer in the year 2006 [3]. For the total amount of 4,087 TWH of electricity generated in the U.S. in 2015, 66.85 % is generated from fossil fuels. Clean energy sources like solar, wind, biomass, and geothermal combine for only 7.3% of total electric power supplies.

Figure 11.2 U.S. electricity mix. IEA, Annual Energy Review Report, 2006.
Figure 11.3 below shows the typical manufacturing energy consumption by end use in California. Since the utilization rate of HVAC is relatively low compared to the average rate in the U.S. due to the mild climate, the portion of HVAC would be larger in a nationwide scenario.

Figure 11.3 Manufacturing Energy Consumption by End-Use in California.
To improve industrial energy efficiency, an integrated strategy of energy assessment, improvement, and management has been demonstrated to be highly effective on these auxiliary industrial facilities. While energy efficient products can be used on an industrialized scale to achieve energy efficiency, existing equipment can also be modified or optimally controlled to improve their energy efficiency. In 2011, the ISO published its new 50001 standards for energy management [ISO 2011].
In the United States, the Energy Star program, jointly established by the U.S. EPA (Environmental Protection Agency) and DOE (Department of Energy), is dedicated to developing energy efficient products and practices. The Energy Star program has achieved remarkable results in terms of energy-saving and greenhouse gas elimination. In the year 2014, the Energy Star program helped Americans save a total of $31 billion on their utility bills and avoid greenhouse gas emissions equivalent to the annual electricity use of 38 million homes.1
Increasing the energy efficiency of manufacturing facilities can improve the sustainability performance by reducing both the economic costs and environmental impacts from an energy perspective. Development of an energy-efficient manufacturing industry has to take a system approach to consider improving the energy efficiency of both the manufacturing equipment and the auxiliary supporting facilities.
However, there are some challenges associated with the energy management of such auxiliary equipment. Since most auxiliary equipment put in manufacturing plants was installed when plants were built, much equipment is dated and using old technologies. Their energy efficiency could be improved if replaced with state-of-the-art equipment and technologies. Most of the time, this switch is a high-capital cost investment due to the labor involved and equipment pricing. The cost could be prohibitive for small and medium-sized manufacturing facilities while also being hard to implement. Also, there may be a lack of professional knowledge and actual data to support decision-making in the energy efficiency improvement of such auxiliary equipment. It is important to note there are opportunities that can improve the energy efficiency of such auxiliary equipment with an acceptable small amount of investment through component upgrading, system restructuring, and changing operating parameters.
This chapter focuses on introducing the auxiliary energy consumers in the industrial facility while providing strategies to improve the energy efficiency of these facilities to support energy-efficient manufacturing. The chapter is organized into topics. First, the working principles and characteristics of three major auxiliary energy consumers (including lighting, HVAC, and compressed air) are briefly introduced. Second, facility energy management strategies are discussed along with some practical examples, which include how to conduct an energy audit on a facility, how to develop a facility benchmark, how to identify opportunities and provide recommendations for actual improvement of the energy efficiency, and what steps are needed to implement an energy management plan for a typical manufacturing facility. Third, this chapter will address issues related to energy metering and tracking devices for system and facility monitoring. And finally, a summary is presented with the conclusions and recommendations on energy consumption, energy management, and efficiency improvements for auxiliary industrial components.
11.2 Auxiliary Industrial Energy Consumptions
To investigate opportunities for improving energy efficiency of auxiliary industrial equipment, their working principles and technical characteristics must be understood first. In this section, the technological characteristics and working principles of such major auxiliary energy consumers in industrial facilities are introduced; these include lighting, HVAC, and compressed air.
11.2.1 Lighting
Lighting is necessary for manufacturing facilities to provide people with the needed luminance to work on their tasks and operations. Due to the large volume use of lighting fixtures, the energy consumption of lighting in manufacturing facilities could be quite significant. Statistic data show that approximately 20% of global electricity is consumed on lighting, while lighting could account for 30% to 40% of electricity consumption in office buildings.2 In current industrial facilities, there are various types of lighting fixtures being used that are based on different lighting technologies.
11.2.1.1 Lighting Technologies
There are a number of different lighting technologies now being employed in industrial settings. These lighting technologies have different lighting efficacy with varying costs while still delivering the same luminance. Several of the common industrial lighting technologies are briefly reviewed below:
- Metal filament lamps: These lamps typically use tungsten wire filled with inert gas to generate light. These types of lamps include incandescent lamps and tungsten halogen lamps.
- Fluorescent lamps: Fluorescent lamps use fluorescent powders to generate light in a low pressure mercury-filled tube. Currently there are three common types of fluorescent lamps used for industrial lighting: T12, T8, and T5. T means the shape is tubular and the number is the diameter of the tube in eighths of an inch.
- High intensity discharge (HID) lamps: These lamps use gas discharges (mostly mercury or sodium) to generate light.
- Solid state lighting: Solid state lighting is the most advanced lighting technology, and uses semiconductor crystals to generate light through photon charging and discharging. The light-emitting diodes (LED), organic light-emitting diodes (OLED), and light-emitting polymers (LEP) all use solid-state lighting technology.
- Solar lighting: Solar lighting uses daylight to provide indoor luminance. There are two types of solar lighting systems: one uses sunlight directly (such as a skylight); the other uses a light collector and transports light into the room through optical fibers which distribute the light.
These lighting systems come with certain advantages and disadvantages. Selection of an appropriate lighting system is essential for achieving energy efficiency in industrial facilities. Though the selection can be based on a variety of factors, the following four are the most commonly used: price, lifetime, energy consumption, and luminous efficacy, which is characterized as lumens generated per watt of power input. Table 11.13 lists the technical characteristics of different lighting technologies.
Table 11.1 Technological characteristics of industrial lighting technologies.
| Price | Lifetime | Energy consumption | Luminous efficacy | |
| Metal filament lamps | Low | Short | High | Low |
| Fluorescent lamps | Medium-Low | Medium | Low | Medium |
| High intensity discharge (HID) lamps | Medium | Medium | High | Medium-Low |
| Solid state lighting | High | long | Very Low | High |
| Solar lighting | Very High | Very Long | None | N/A |
With such economic and technological characteristics, fluorescent lamps and HID lamps are two of the most commonly used lighting technologies in U.S. industrial facilities. Statistical data show that in 2010, 89.2% of U.S. industrial facilities were using fluorescent lamps, 9.8% were using HID lamps, and only 0.3% were using incandescent lamps.4
11.2.1.2 Opportunities for Improving Energy Efficiency of Industrial Lighting
Total electricity consumption of lighting in an industrial facility depends mainly on the facility size and the types of lighting technologies being used. The unit energy consumption of lighting in an industrial facility is typically between 30 and 50 kwh/m2 [4] [5], although the number is expected to be reduced to a level of approximately 10 kwh/m2 in the future with appropriate energy management strategies [6]. Effective ways to reduce the energy consumption of lighting in industrial facilities include replacing inefficient lamps (such as HID lamps) with fluorescent lamps; employing lighting control systems (such as motion sensors); reducing lighting power density (such as by dimming the lights); and using sunlight in accordance with solar lighting technologies.
a) Replacing inefficient lamps with efficient lamps
Currently, with economic costs and performance in consideration, fluorescent lamps are the best choice among various lighting technologies due to their relative low price and low energy consumption. The T8 and T5 fluorescent lamps are more efficient than the T12 models. Replacing old inefficient lamps with new efficient lamps could significantly improve energy efficiency and reduce the lighting costs in the long run.
A case study was conducted on a Wisconsin manufacturing facility for replacing their high pressure sodium lamps (total 500 lamps in the plant) with T8 fluorescent lamps to improve energy efficiency and reduce lighting cost. The replacement project cost a total of $87,500, which included the cost of purchasing 500 high-bay 6-bulb 200W T8 fluorescent light fixtures with installation fees. As calculated, the annual energy consumption could be reduced by 499,200 kWh/year based on the two-shift working hours of the plant from 5:30 am to 9:30 pm. This results in an annual cost saving of $52,115 per year with an initial payback period of about 20 months. In Wisconsin, an incentive of $50/fixture is provided by Wisconsin Focus on Energy for replacing inefficient HID lamps with efficient fluorescent lamps. With these incentives, the implementation cost reduces to $62,500 and the payback period reduces to 14.4 months. Since the T8 fluorescent lamps and the HID sodium lamps have a similar life expectancy of around 20,000 hours, the total savings from this replacement could be $187,614 through the whole life expectancy of the lights.
b) Using occupancy sensors to control the lights
In an industrial plant, many lighted areas have varying low occupancies. Examples of these areas are conference rooms, warehouses, and shipping/receiving areas. From an energy efficiency perspective, lighting in these areas should be turned on only when needed. Installing occupancy sensors in these areas can effectively control lighting operations and hence save both energy and cost.
c) Reducing lighting levels
In some plants, the lighting levels of older designed lighting systems are two to three times more than needed. It is highly recommended to check lighting levels with standards in ASHRAE and IES if plants are old and have many lighting fixtures installed. Generally, non-uniform lighting systems can be applied when the average size of the illuminating area is less than one worker per 50 to 70 square feet [7]. Reducing lighting levels can also be achieved by lowering the wattage of lamps or by removing some of the lighting fixtures. As fluorescent or HID lamps are removed, ballasts should also be disconnected from the lighting fixtures to avoid energy loss when not in use. The U.S. Department of Energy has published a lighting level chart in a book titled Modern Industrial Assessments: A Training Manual.5
d) Installing high efficiency ballasts
A ballast is used in light fixtures for three reasons. The first is to preheat the rapid-start lamp before ignition. The second is to generate an electric arc inside the lamp. The third is to regulate the current and voltage in the lamp to maintain daily operation. There are two different types of ballasts: electronic ballasts and magnetic ballasts. Electronic ballasts can improve the performance of fluorescent lamps and also reduce their energy consumption. Comparing these two types of ballasts, the efficiency of electronic ballasts is 15% higher than that of the magnetic type since the power factor of electronic ballasts is nearly 99%.
e) Retrofitting fluorescent reflectors
Currently, fluorescent reflectors are available in semirigid reflectors and adhesive films. Either silver or aluminum can be used as the reflecting materials. Since adhesive films are applied directly to the interior surfaces of the lighting fixtures and cannot be formed to certain shapes to provide direct light, the semirigid reflectors applied directly to the existing fixture are more efficient. Based on manufacturers’ claim, illumination directly underneath a fixture is about the same for energy aspects of reflectors if two lamps are removed from a four lamp dirty fixture. However, a decrease of illumination happens at angles on either side of the fixture. Ever though the removal of two lamps can reduce energy by 50%, lamp relocation is needed to balance the lighting level in the work place and reduce dark spots.
11.2.2 HVAC
In industrial facilities, heating, ventilation, and air-conditioning (HVAC) systems can provide comfortable environments inside the building to increase working productivity and efficiency. They can also meet certain and strict manufacturing process requirements in applications such as food manufacturing. Figure 11.4 shows which HVAC systems typically consume the most energy in commercial buildings by end-use [1].6 Most manufacturing processes today demand very narrow limits of temperature, humidity, and air quality; however, old HVAC systems do not meet today’s energy standards on energy efficiency. Recent developments in electronics, control strategies, and other auxiliary units have made a large impact on the utilization methods of HVAC systems. By adapting and changing these existing dated systems, significant reductions of consumed energy can be realized.

Figure 11.4 Percentage of total energy consumption in commercial building by end use [1].
11.2.2.1 HVAC Systems
HVAC systems have being designed to provide year-round heating, cooling, humidity control, and ventilation for desired indoor conditions [8]. The ventilation of air through ductwork between air handlers and conditioned spaces can be distributed by the air heating and cooling systems that provide comfort and process work to the buildings. The basic schematic of equipment providing heating or cooling fluid to air handlers in typical all-air commercial HVAC systems is shown in Figure 11.57.

Figure 11.5 Basic schematic of heating and cooling equipment and air handlers in an HVAC system [8].
a) Air handlers: The air handling system is presented in the upper and right part of the figure. In general, this air handing system provides conditioned air through a filter, followed by a heating or cooling coil and a humidifier. The hot or cold air is then distributed to different locations. During this process, the air handling system exhausts a portion of the indoor air while mixing in fresh outdoor air into the supply air.
b) Space heating: Space heating uses the same duct systems used for cooling. Heating can be achieved through the air system or by separate heat systems using hot water, steam, and electric-resistance heat. Examples of electric-resistance heat include a hot water heater, gas heater, or infrared radiant heater. In Figure 11.5, a steam boiler can directly provide hot water to the radiator that heats the space. In central all-air commercial HVAC systems, hot water from the boiler is pumped through the heating coil in the air handler. Many manufacturing facilities don’t need space heating throughout the entire plant, but only need the heat in frequent air infiltration areas near loading dock doors. That is to say, a separate and specific air heating system is needed.
c) Space cooling: As seen in Figure 11.5, a fluid, usually water, absorbs heat from its surroundings by being circulated in a pipe between the air handler and chiller. This is done to remove energy and cool the temperature for the desired space. It can be seen that energy removed by evaporation in the chiller is distributed by water through the piping. Typically, the chiller and cooling tower are located outside of buildings and far away from the air handler because water as an energy transfer media has a relatively high capacity to carry large amounts of energy within a long piping system. It is very common for manufacturing facilities to use chillers and cooling towers for cooling, but they consume lots of water and electricity.
11.2.2.2 HVAC Energy Efficiency Opportunities
Optimization of operations and maintenance procedures can improve the overall energy efficiency of an HVAC system. These goals can be achieved by adjusting the temperature setting, replacing air filters, and balancing air distribution systems. Most of these adjustments have little to no implementation costs to improve the overall energy efficiency of the HVAC system. Some modifications provide more energy efficiency and air distribution in the HVAC system, but come at a higher implementation cost. Energy efficient air distribution can be achieved by changing distribution system from constant air volume (CAV) system to variable air volume (VAV) system, providing local exhaust for processes, using economizer for the make-up air, and adopting evaporative cooling and radiant heaters as cost-effective cooling and heating methods. Some common recommendations for the improvement of HVAC systems are listed below:
a) Replacing air filters
Air filters in the air handler are used to remove dust and other small particles from the air flow. When air flows through the air filter, energy can be lost due to the pressure drop from the upstream side of the filter to the downstream side. The pressure that air flows through the filter is a function of the air velocity through the filter and the resistance to the air flow. As a rule of thumb, the filter resistance has an exponential relation with time when in use. Therefore, the air filter should be replaced before the filter resistance reaches a value twice that of the initial resistance. There is a simple calculation, listed below, to illustrate the energy saving if an air filter is replaced. Suppose a fan with an efficiency of 60% will circulate 10,000 ft3/min of air for 1,000 hours of operation. The pressure drop is 0.7” wg at 10,000 ft3/min due to the dirty air filter. If a new filter with pressure drop of 0.35” wg is installed, then Eq. (1)8 is used to calculate the horsepower consumed by a fan motor for the pressure drop due to the air filter. For this calculation, air flow velocity is assumed constant and the motor efficiency and drive losses are neglected.
(11.1)

Where, Q = air flow, ft3/min
Ps = static pressure drop, inches wg
ηF = fan efficiency
Therefore,

For 1,000 hours of operation, the energy consumption (CE) is calculated as follows:
However, the initial pressure drop of this air filter is 0.35” wg after the replacement. The energy consumption would then be:

For 1,000 hours of operation, the proposed energy consumption (PE) can also be calculated using previous equation:
The energy savings would then be:
b) Adjusting temperature setting
In modern buildings, a thermostat is used to control the temperature range in a conditioned area. However, many HVAC systems in manufacturing facilities are dated and operated at constant temperatures regardless of the heating or cooling load. In practical cases, heating or cooling loads vary with time in a day. Therefore, it is necessary to install thermostats to set the temperature within the proper range based on the heating or cooling loads. Thus, energy can be used more efficiently.
c) Balancing air distribution system
Air distribution systems in HVAC are designed and used to provide air flow for different locations in the facility. The air flow rate at each outlet should be prescribed and determined before installing ducts and air pumps according to the desired condition in each area. Many manufacturing plants are not aware of the need to rebalance the air distribution system after it has been in use for some time due to changing loads and system performance. This can lead to energy loss from improper air flow rates at each outlet. In order to distribute proper air flow rates at each air outlet, it is recommended to adjust and rebalance the air distribution system regularly.
d) Using properly designed and sized cooling equipment
In manufacturing facilities, energy consumption by cooling equipment during the summer months can vary with the cooling load, which is also determined by heat sources in the designed area. If cooling equipment is oversized and does not properly provide air for space cooling, the cooling equipment needs to be redesigned and re-selected. To analyze the cooling load and resize the cooling equipment to reduce energy loss, the total amount of heat energy that needs to be removed from the facility needs to be calculated, as summarized in Table 11.2. For this point, the method of the cooling load temperature difference (CLTD) is used for the calculation. The calculations of CLTD and total cooling load for a manufacturing plant are presented as follows:
(11.2)
| Where, | ||
| CLTD | = | Cooling Load Temperature Difference (°F) |
| TR | = | Required inside temperature (°F) |
| TM | = | Mean outdoor temperature (°F) |
| And, | ||
| TM | = | TMAX – 0.5 × DR |
| Where, | ||
| TMAX | = | Maximum outside temperature (°F) |
| DR | = | Daily Range |
Table 11.2 Summary of various heat loads in a manufacturing plant.
| Area | QRoof |
QWalls |
QPeople |
QLights |
QApplicances |
Ventilation |
Cooling load (tons) |
|
| Btu/hr. | Btu/hr. |
Btu/hr. |
Btu/hr. |
Btu/hr. |
QSensible |
QLatent |
||
Btu/hr. |
Btu/hr. |
|||||||
| Upper Offices | 50,940 |
13,068 |
20,000 |
28,076 |
17,060 |
13,770 |
27,588 |
13.53 |
| Lower Offices | 64,800 |
14,760 |
20,000 |
36,766 |
17,060 |
5,670 |
27,588 |
16.54 |
| Showroom | 38,205 |
5,400 |
4,000 |
9,191 |
3,412 |
1,134 |
5,518 |
5.60 |
| Center Manufacturing | 665,028 |
88,220 |
39,000 |
44,885 |
23,412 |
5,670 |
27,588 |
74.50 |
| Service | 123,120 |
42,120 |
8,000 |
11,489 |
3,412 |
2,268 |
11,035 |
16.80 |
Total cooling load (tons) |
127 |
|||||||
Therefore, the energy consumption (CE) for 1075 hours of operation is calculated below:
Where,
| PR | = | Cooling capacity (386 tons) |
| C1 | = | Conversion Factor (0.57 kW/ton) |
| H | = | Operating hours per year (1075 hr) |
| The proposed energy consumption (PE) for 1,075 hours of operation is: | ||
Where,
| PR | = | Cooling capacity (127tons) |
| C1 | = | Conversion Factor (0.57 kW/ton) |
| H | = | Operating hours per year (1075 hr) |
| Therefore, the energy savings would be: | ||

e) Using radiant heaters
Many industrial plants use gas heaters in shipping/receiving areas for space heating during winter. These types of heaters work by heating space air which then transfers heat to employees and other objects. For areas with high air infiltration like loading docks, this type of heating is inefficient. Radiant heaters operate by emitting energy as electromagnetic waves that do not heat up the space air that it is traveling through. They instead transfer heat to the objects the waves hit within its path. The space air remains cold, but radiant energy is transferred to the employees and objects which then re-radiate to warm the space. This eliminates the problem of stratification since the air is being heated from the floor up instead of from the ceiling down. Unlike conventional gas heaters, there is a much shorter response time and employees feel heat shortly after the system is turned on.
f) Using thermal energy storage systems
In a manufacturing facility, chillers serve multiple cooling needs. When they are used in air conditioning systems, chilled water is supplied to cool the coils. With a partial ice thermal storage system, the chiller can be 40% to 50% smaller than other HVAC systems because the chiller works in conjunction with thermal storage tanks during on-peak daytime hours to manage the building’s cooling load. During off-peak nighttime hours, the chiller charges the thermal energy storage tanks for the use during next day’s cooling. Extending the chiller’s operating hour’s results in a lower average load. The following scenario is an example of a partial ice thermal storage system [9].
During the off-peak charging cycle, water containing 25% ethylene or propylene glycol is cooled by a chiller and then circulated through a heat exchanger inside the ice thermal energy storage tank. The water-glycol solution leaving the chiller and arriving at the tank is normally around 25°F, which freezes the water surrounding the heat exchanger inside the tank. This process extracts the heat from the water surrounding the heat exchanger until approximately 95% of the water inside the tank has been frozen. Ice formation has the effect of de-rating the nominal chiller capacity by approximately 30% to 35%. Compressor efficiency, however, will vary only slightly because lower nighttime temperatures result in cooler condenser temperatures, which help keep the unit operating efficiently. A full charging cycle of an ice thermal energy storage tank requires approximately 6 to 12 hours, depending upon job criteria. During the peak-load discharge cycle the following day, the glycol solution can leave the chiller at a little higher temperature above the freezing point; this is more efficient than a conventional chiller systems’ temperature requirement.
11.2.3 Compressed Air
In a manufacturing plant, compressed air is widely used for actuating, cleaning, cooling, drying parts, and removing metal chips from various manufacturing processes. From an industrial point of view, compressed air is the fourth utility, after electricity, natural gas, and water. However, the cost of compressed air in industrial operations is high. Per million British Thermal Units (Btu) of energy delivered, compressed air is more expensive than the other three utilities, as shown in Figure 11.6.9
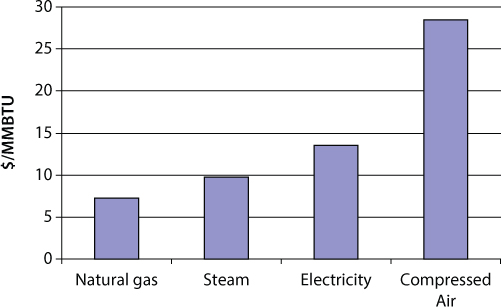
Figure 11.6 Cost of energy delivery modes [10].
Compressed air is easy and convenient to use, with minimum level of maintenance required. In addition, compressed air represents no fire or explosion hazard and is clean and safe during its operations
Plant air is typically the supply option in a manufacturing plant, with the compressed air generated and supplied from a centralized air house.
11.2.3.1 Compressed Air Technologies
There are three types of air compressors currently being used in industrial plants. These compressors are different in the technologies employed and have different performance. A brief overview of the three types of air compressor technologies follows:
- Reciprocating air compressor: The compressor has pistons moving back and forth inside a cylinder to compress air. This type of compressor has single or multiple stages of compression, which can provide a pressure ranging from 25 psig up to 2,500 psig. Its movement looks like an internal combustion engine, so cooling is needed for this type of compressor. Air cooling and water cooling are both available in lubricated and non-lubricated configurations that guarantee a wide range of pressure provided. Variable speed control may also be used for the compressed air generation.
- Rotary air compressor: This type of compressor is regarded as a constant-volume variable pressure unit. It uses either a rotary vane or a rotating screw to compress air. A rotary vane compressor relies on a rotary vane sliding in and out to compress the air. A rotating screw compressor has a pair of rotors in dual bore housing to compress air. Both compressors also have single and multiple stages.
- Dynamic air compressor: This type of compressor is a rotary continuous airflow compressor that includes centrifugal compressors (air is compressed by the mechanical action of rotating impellers) and axial compressors (using rotating blades to force the air passing through the compressor to be compressed). The dynamic air compressor is an oil free compressor.
Air compressor drives
- Electric motors: Electric motors are the most commonly used drive of air compressors. They convert electric energy into kinetic energy. Three different types of electric motors are commonly used to drive air compressors: squirrel-cage induction motors, wound rotor induction motors, and synchronous motors.
- Steam driven engines and turbines: steam generated by boilers or steam generators with high pressure can also be used to drive air compressors. There are two types of steam drives for air compressors: steam engines and steam turbines. Steam engines typically are used for driving reciprocating air compressors. Steam turbines are suitable for large capacity air compressors such as dynamic compressors.
- Fuel powered engines and turbines: Fuel powered engines and turbines can also drive large capacity air compressors, such as centrifugal and axial air compressors. These engines and turbines can be powered by gasoline, fuel oil, kerosene, or other fuels. Most of these engines are used in refineries and petrochemical plants.
11.2.3.2 Improving Energy Efficiency of Air Compressors
To have the air compressor operating at a high efficiency, it is necessary to perform such regular maintenance and service as compressor tests, leakage tests, measuring pressure drop across filters, and measuring pressure at different locations. When needed, some modifications of air compressors could also be made to improve energy efficiency of the compressed air system, for example.
- Replacing compressed air usage with an electric or hydraulic system:
As the fourth utility in industrial and manufacturing facilities, compressed air is widely used and consumes lot of energy. But, in some cases such as cleaning, electric or hydraulic systems can also handle the same task at a relatively lower energy cost and lower capital cost. Replacing compressed air with an electric or hydraulic system can reduce the energy consumption and operating cost of the air compressor. - Reducing compressed air leakage
Compressed air leakage causes unnecessary power loss that can consume 20% to 30% of compressor capacity [11], sometimes even 50% [12]. Energy savings can be obtained by repairing the air leaks from the compressed air system and attached equipment. Air leaks can happen anywhere in a compressed air system. The common leaking areas of a compressed air system are:- Threaded pipe joints
- Valve stems
- Filters
- Connectors
- Check valves
- Flanged connections
- Traps and drains
- Air horses
- Actuators on pneumatic controls
- Relief valves
The air leak is jointly determined by the air pressure and the orifice size of the leaking. Table 11.3 lists the leakage rates (cfm) for different supply pressures and approximately equivalent orifice sizes for the calculation of energy loss due to air leaks.
Table 11.3 Leakage rates (cfm) for different supply pressures and approximately equivalent orifice sizes [8]1.
| Leakage rate (cfm) for different supply pressures and approximately equivalent orifice sizes | ||||||
| Pressure (Psig) | Orifice diameter (inches) |
|||||
1/64 |
1/32 |
1/16 |
1/8 |
1/4 |
3/8 |
|
| 70 | 0.29 |
1.16 |
4.66 |
18.62 |
74.4 |
167.8 |
| 80 | 0.32 |
1.26 |
5.24 |
20.76 |
83.1 |
187.2 |
| 90 | 0.36 |
1.46 |
5.72 |
23.1 |
92 |
206.6 |
| 100 | 0.40 |
1.55 |
6.31 |
25.22 |
100.9 |
227 |
| 125 | 0.48 |
1.94 |
7.66 |
30.65 |
122.2 |
275.5 |
1US DOE Compressed Air Tip Sheets
- Using high efficiency motors
Since air compressors usually run throughout the entire year, air compressors with old drive motors consume large amounts of electrical energy inefficiently. Significant energy savings can be achieved by replacing old motors with high efficiency motors. The efficiency of an air compressor equipped with high efficient motor can be typically improved by over 5% compared to the old compressor.
- Heat recovery
Usually, hot air is generated from the compressor around 350 to 500°F, which can be recovered for space heating, water heating, pre-heating of boiler feed, etc. The following equation shows the annual energy savings by recovering heat from an air compressor to pre-heat boiler feed water.
(11.3)

where,
| AES | = | Annual energy savings (MMBtu/year) |
| Cr | = | Percentage of input energy recoverable as heat |
| HP | = | Horsepower of the compressor (hp) |
| Cc | = | Conversion factor (2545 Btu/(hp · hr)) |
| H | = | Annual hours of compressor operation (hours) |
| ηh | = | Heat exchanger efficiency |
| ηb | = | Boiler efficiency |
- Relocate compressor air intake
As the temperature of intake air increases for air compressor systems, air density, mass flow, and pressure capability all decrease. Putting air intakes at the coolest location can reduce energy consumption and save on energy costs. It is recommended that a manufacturing facility installs ducts to bring colder, outside air to the intake of the air compressors when the outside air is cooler. The annual energy saving for air compressor is given by the following equation:
(11.4)
Where,
| AES | = | Annual energy savings (kWh) |
| HP | = | Horsepower of the air compressor (hp) |
| C1 | = | Motor conversion factor (0.746 kW/hp) |
| H | = | Operating hour (hours) |
| Fs | = | Fractional savings (Shown below) |
| η | = | Motor efficiency of the air compressor |
| In the above equation, the fractional savings is calculated as follows: | ||

Where,
| Fs | = | Fractional saving |
| Ti | = | Temperature inside (°F) |
| To | = | Temperature outside (°F) |
- Install variable speed drives (VSD)
Air compressors are usually driven by large electric motors. When an air compressor starts, it usually requires a relatively large current to start, to accelerate the motor to the required speed of operation. Most of the time, the starts of motors contribute to the demand of the facility. The power required to drive a compressor is a function of the torque and the speed at which it is operating. Reducing the speed of compressor can reduce the power consumption. This is useful especially when the air demand of a manufacturing facility is highly variable. Installing a variable speed drive (VSD) can directly reduce energy consumption. Typically, a VSD can save an air compressor up to 30% of energy consumption, as calculated by the following equation. Current load of air compressor can be obtained by logging the operating data of the compressor, so the unload power and unload percentage of time can be obtained as well. For the conservative reason, a saving factor is included in the equation to estimate the percentage of unload power saving.
(11.5)
Where,
| AES | = | Annual energy savings (kWh) |
| Punload | = | Unload power of air compressor (kW, obtained by data logging) |
| H | = | Operating hour (hours) |
| Funload | = | Unload percentage of time (%, obtained by data logging) |
| Fs | = | Saving factor for air compressor (95% for most cases) |
11.3 Industrial Practices on Energy Assessment and Energy Efficiency Improvement
11.3.1 Types of Energy Assessments
Industrial energy assessments conducted by engineering staffs can play an important role in energy efficiency improvements, waste minimization, pollution prevention, and productivity improvement of a manufacturing facility.
If an energy audit or assessment has not been completed for a facility in the last 5 years, it may be useful to perform an assessment. This will allow a foundation for what opportunities may exist and begin to establish the level of efforts that might be appropriate for the overall energy management plan. Generally, there are three levels of audits. Level one is a “walk-through” audit that, as the name implies, is based on a walking tour of the facility by a qualified energy engineer. The qualification of the energy engineer performing the audit is very important. The engineer should have significant experience with performing audits, but also have a strong working knowledge of the type of processes that the specific industrial facility performs. Because the energy used in the manufacturing processes can be 80% to 90% of the energy used for the whole facility, an energy engineer who has direct experience with these industrial processes is strongly recommended. Before the walk through begins, the energy engineer discusses important operational parameters with the facility and operations management. These parameters include:
- Information of any past energy audits
- Facility energy bills for the last 2 years
- Sub-meter information as available
- Description of major energy using equipment including hours of operation
- Key operational parameters such as temperature or pressure settings
- Layout of equipment and systems within the facility
- Product quality considerations or concerns
- Known production bottlenecks
- Equipment maintenance concerns or issues
- Air quality or employee comfort issues
- Energy efficiency opportunities already identified by facility staff
11.3.2 Energy Assessment Procedures
With this information energy auditors can tailor their walk-through audit to investigate the areas with the most potential for energy efficiency improvements. During the walk-through of the facility, the engineer notes seen energy saving opportunities as they inspect the operation of the key energy using equipment. Usually this involves discussions with the facility engineers as they inspect each system. After the walk-through audit, the auditor will again sit down with the facility management to ask further questions and to discuss preliminary findings. Typically a walk through audit will take 2 to 8 hours depending on the size of the facility. The result of the audit is usually a short 3 to 10 page report that highlights the primary energy saving opportunities discovered, including an estimate of potential energy cost savings, implementation cost, and the simple payback of the opportunities. Once a walk-through audit is completed it may be useful to perform a deeper investigation of the key opportunities. There are two higher levels of audits that are usually considered. The next audit level typically involves further investigation of the key opportunities by performing measurements and collecting more data to provide greater accuracy to the estimate of energy savings for one or more projects. This audit may include setting sub-meters in place for a period of time to collect enough data to accurately account for variations in equipment operation. The purpose of this type of audit or study is to provide enough information to determine if the project is worth the potential investment. Sometimes these types of studies investigate business issues other than the energy savings potential, as needed, to ensure the project is feasible and appropriate for the given manufacturing facility.
After either the first or second level audit is performed there may be enough information to make a decision to move forward with the potential projects. But for more complex and relatively higher-cost projects, an even higher level of audit may be important. The final level of audit is an investment grade audit that provides a very thorough investigation of all aspects of the potential project. This may include additional sub-metering and data collection. The intent of this audit is to verify the potential energy and other business benefits. The intent is also to accurately estimate the final cost of the project including differences in operation or maintenance costs. With this information the final implementation decision can be made for the project.
11.4 Energy Management and Its Enhancement Approaches
Energy management is similar to an energy audit, but is more focused on the proactive, organized, and systematic coordination of procurement, conversion, distribution, and use of energy to protect environment and save energy costs.
Nowadays manufacturing companies take many different approaches to managing and improving their use of energy. But in our increasingly competitive world, many of those companies do not manage their energy and may be risking their survival. Each company should determine the level of importance energy costs to their business and develop strategies that are appropriate to manage energy in their business. Because the level of energy intensity varies, each company will need to determine how much effort and what strategies they will find appropriate for their situation.
To understand the role that energy plays for a manufacturing company, the company needs to determine their “energy intensity.” Energy intensity is defined as the amount of energy used per unit of output. One example of energy intensity for a car manufacturer could be kWh used per car manufactured. Once the baseline of energy intensity is determined for the previous year to 3 years, further energy management strategies can be considered.
Key energy management strategies that a company should consider include:
- Designating an Energy Champion
- Creating an Energy Team
- Developing a long-term energy plan
- Comparing facility key performance indicator (KPI) energy intensity benchmarks to industry benchmarks, if available, or other facilities within the company
- Frequency of monitoring and reporting on key performance indicators
- Comprehensive employee engagement
- Level of general facility audit
- Specific energy studies for key systems
- Implementation of energy sub-metering
- Internal and external recognition of energy management progress
These strategies, all proven approaches to increase the ability to reduce energy costs over the short and long term, will be described in more detail later. They are key components of most industrial energy management multi-year plans.
11.4.1 Energy Management Description and Benefits
With technological advancements, the investigation of energy use is becoming easier and less costly, as is understanding these energy performance issues on an ongoing basis. Managing energy is becoming an important, ever increasing part of succeeding in business.
Successful approaches to energy management can be different from business to business and even from facility to facility within a given business. The type of energy management strategies and the level of effort needed for a given business or facility will depend on a number of factors that include:
- Percentage of energy costs relative to total business costs
- Overall amount of energy bills
- Importance of customer’s perception to energy management success
- Scarcity or price volatility of the primary energy consumed
Regardless of these factors, a fundamental part of any energy management approach is to proactively monitor energy intensity and to proactively search for ways to reduce this energy intensity. A facility that manages their energy includes a process that systematically uncovers all types of energy saving opportunities including capital, operational, and behavior-based opportunities. The energy management process includes the ability to prioritize short and longer term actions within overall business needs. It also includes tracking energy intensity or key performance indicators (KPI) to measure progress and account for changes in production, weather, or other factors that may impact energy use. Other key components of an energy management process are to report to upper management on energy management progress and to engage the entire workforce to uncover potential opportunities.
There are multiple benefits from effective energy management approaches that are more than just reduced energy costs. Some of the many benefits of energy management include:
- Ensuring that energy costs are minimized to improve business health
Without an energy management approach a business cannot be sure it is doing all it can to effectively minimize energy costs. By simply doing efficiency projects, a business becomes aware of the opportunity and leaves many good opportunities uncovered. - Tracking and reporting progress can stimulate further action
In an effective energy management process a broad reporting element is important. When good ideas and strong progress are recognized it is human nature to want to contribute. Reporting success will encourage others to provide additional ideas. - Being a strong community leader by being a good steward of resources
A good business strategy is to be known as a leader in energy and environmental issues to build strong local community support. This can be even more important if the business has other potentially negative environmental impacts. - Build good brand image for increased sales
Businesses can show customers they care about their overall wellbeing by reducing their impact of energy use. Energy management allows this virtuous approach while also benefiting in lower energy costs and a more positive business image for increased sales. - Increase employee loyalty
For most businesses, employee loyalty is as important as customer loyalty. Many employees find value in being a part of a company that is doing its best to reduce their energy impact. - Minimizing environmental impact of business
In addition to the ethical importance of minimizing the business impact on the environment, reducing the energy side of their environmental impact can be an important part of an overall strategy to reduce the environmental impact in other areas. - Reducing the need for the local utility to add capacity, keeping rates lower for everyone
The benefit from the energy demand reduction resides in the fact that the cost of building new electric power plants per kilowatt is much more than the cost per kilowatt of many projects that reduce energy use within a business facility. Therefore, when an individual business reduces their kW power use the community needs to build less power plants to meet their overall needs. Everyone in the community will then benefit from not having to pay more for this power from a power plant. Figure 11.7 shows that energy efficiency is the lowest cost resource for electric power.

Figure 11.7 Levelized cost of energy efficiency compared to electric supply side options. Energy efficiency average program portfolio data from Molina 2013 (Courtesy of ACEEE) - forthcoming; All other data from Lazard 2012. High-end range of advanced pulverized coal includes 90% carbon capture and compression
11.4.2 Establishing an Energy Management Approach
Developing an energy management approach for any organization can be a formidable task, but for industrial companies the challenges can be even greater than for non-industrial companies. The unique challenges for many manufacturing companies include a high degree of technical complexity for energy-using equipment and processes. A high degree of technical expertise and specialization can be needed just to understand how the processes work, but even more unique expertise is needed to identify energy efficiency opportunities within these processes. Because the manufacturing processes are at the core of how an industrial company makes money, they are very cautious about making changes to these processes to save energy. Sometimes energy savings might be easily overshadowed by the increased cost if production changed to improve energy use. Because of the higher importance of the actual production, it is advantageous to develop an energy management plan that uses internal staff to investigate opportunities and manage the process energy use as a part of the manufacturing business.
Typically, the staff is stretched just to meet the core manufacturing needs, such as meeting production deadlines. Also, most manufacturers require a relatively high return on their investments. They typically seek to have projects payback in two years or less. But a targeted and active energy management approach can overcome these barriers once the approach is established and becomes a part of the overall business plan.
For most companies implementing an energy management approach requires five key steps that build upon each other. The five basic steps to implementing an effective energy management approach are:
- Begin with a strong commitment from management
- Establish energy intensity benchmarks
- Form an energy team
- Develop a long-term energy management plan
- Establish a system for continual improvement
Begin with a Strong Commitment from Management
The first step to develop a strategic energy management approach is to gain sufficient commitment from the company’s upper management. This commitment is needed to guide the organization to put the appropriate amount of human and capital resources toward the approach. The attitude and commitment demonstrated from upper management can have a large impact on the company’s culture and the employee’s interest in finding ways to effectively reduce energy intensity. Management can demonstrate their commitment in a variety of ways, but it is important that their actions are visible and clearly communicated to their staff. Management might develop an energy policy that provides a vision statement of why energy intensity reduction is important to the company and what broad actions, such as purchasing procedures, they deem necessary to the goal of energy intensity reduction.
Establish Energy Intensity Benchmarks
With a commitment from management toward reducing energy use at the facility, the next basic step is to baseline the facility’s energy use and energy intensity. Earlier examples of energy intensity metrics were provided for car manufacturing (kWh/Car) and plastic manufacturing (kWh/lb resin). Each type of industry will have an energy intensity metric that best suits their business. In some cases, a facility can benefit from developing a unique energy intensity measurement that measures their energy use tied to their specific type of production or use more than one energy intensity metric, including different types of energy use (i.e. electricity or gas). The important aspect of the energy intensity metric chosen is that it more accurately reflects how energy is used relative to other key business objectives like production. For most manufacturing companies, the amount of production will be the key “driver” or influencing factor for how much energy is consumed. But for some companies, it will be important to normalize the energy use to other factors such as weather. This can be done by using a multivariate regression analysis that includes these factors. Figure 11.8 shows a regression analysis of energy use and production data for a plastics manufacturer. For this company the key driver for energy use was the amount of resin that the company used in producing their products. Because the regression fit was good, no other variables were needed to baseline the energy use.
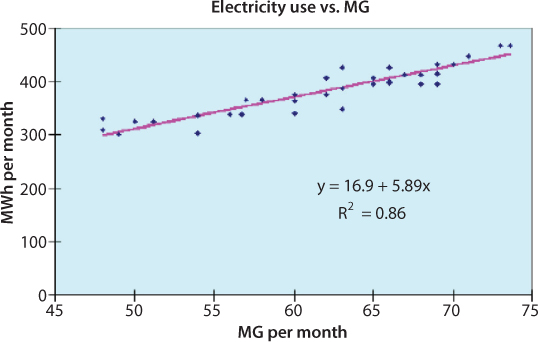
Figure 11.8 Regression analysis of energy use and production data.
It can be seen in the graph that the energy use will not go to zero even when there is no production. A base amount of energy is used in systems such as lighting and HVAC even if no product is manufactured. The energy intensity graph not only indicates the rate or change of energy use with variations in production, but it also can show the amount of base or constant energy use for a facility. Figure 11.9 is a simplified example of the constant or base energy use and the variable or production energy use. To find and prioritize energy efficiency opportunities it is important to investigate both the constant/base energy use systems (lighting, HVAC, etc) and the variable energy use systems (production processes). Since the base systems are not tied directly to production, the opportunities for these systems may be easier to implement. Also, efficiency improvements to the base systems will have a more predictable return on investment (ROI) because they are not tied to amount of future production rates.

Figure 11.9 Energy Use in the Industrial Sector. Based on data from the U.S. Energy Information Agency, January 2012.
Although the base systems such as HVAC and lighting are important areas to impact, the general amount of energy used in these systems by manufacturers is small when compared to energy used directly in the manufacturing process. The graph below shows that overall for manufacturing the amount of energy used in the main base systems of HVAC and lighting is only 10% of the total energy used, while the energy used directly within the manufacturing process is 62% of the total. The high percentage of energy used in many manufacturing process is one reason that managing energy use in industrial facilities is critical to engage production managers to discover effective and appropriate ways to reduce energy intensity while still maintaining, or increasing, production rates and product quality.
Form an Energy Team
For most medium to large manufacturing facilities it is cost effective to form and use an energy team. The cost of multiple individuals involved with reducing energy intensity is usually well worth the energy cost reductions that occur. The energy team should represent a cross section of different functions within the business including engineering, maintenance, operations, and management. One reason that strong management commitment is important is to ensure that members from all these business areas are committed to the team. For the team to succeed there needs to be a team leader or coordinator who is effective at stimulating discussions on energy efficiency opportunities and holding the team accountable to moving projects toward implementation.
How often the team meets can depend on the size of the energy use and the level of cost reduction opportunity at the facility. For companies with energy costs above $500,000 per year it is recommended that these teams meet one to two times each month for the first year or at least until a long term energy plan is in place. During the initial team meetings, it can be useful to begin to develop a long-term energy management plan in parallel with beginning to implement energy saving projects that may have quick paybacks. It is usually useful for this leader to assign “bite-sized” tasks that team members can complete before the next meeting time to show progress toward actual projects and energy savings. This provides early success for the team that can stimulate additional motivation to dig deeper into the facility operations to uncover the more hidden opportunities and to do the groundwork needed to establish a long-term plan and a continual improvement approach.
Develop a Long-Term Energy Management Plan
Developing a long-term energy management plan is an important step for any organization to ensure that energy costs are given the proper attention relative to other business costs and opportunities. Using a cross functional energy team to develop the plan can help tie the plan into other business systems and priorities. To gauge the success of the team’s plan for an industrial facility it is not sufficient to simply measure the absolute reduction in energy from one time period to another. If production rates drop this will show a subsequent drop in energy use, which should not be counted as part of the impact of the energy plan. Therefore, one of the first steps for the team is to benchmark the facility’s energy intensity at different production levels. By establishing a benchmark for energy intensity relative to production rates, future reductions in energy intensity can be accurately measured for any future production rate.
If an energy intensity analysis has not been done, this should be undertaken during the initial plan development. The energy intensity analysis can be as simple as graphing the past 2 to 3 years of monthly energy usage with the corresponding monthly production values. By applying a linear regression fit to the data, the facility’s energy intensity relative to production levels can be determined. This can form the facility’s energy intensity benchmark, which can then be used to measure the impact of future energy intensity reduction efforts. If more refined information is available with either smaller time periods such as days instead of months, or energy sub-meters are available, energy intensity values can be even more precisely measured. It may also be important to do a multi-regression analysis with other energy use drivers such as outdoor temperature to provide a reasonable fit to the data.
With the energy team in place and the facility energy intensity determined a comprehensive energy audit or assessment should be conducted to uncover as many energy efficiency opportunities as possible. The energy audit can be completed as described in the earlier section, but should look to uncover as many possible opportunities as possible. It will be important to attach a rough estimate of energy savings to each opportunity, but in the early stages of the audit, a lot of time and money should not be spent to perform detailed calculations or measurements to determine exact energy savings potential, unless it is a very large and obviously strong opportunity. As a part of the audit an energy use breakdown should also be determined for the facility. The energy use breakdown is an estimate of how much energy is used by each major system and an accounting of where the energy is used in the facility. The pie chart in Figure 11.10 is an example of a typical way to show the energy use breakdown for a facility. This information can be very useful to educate the team members on what systems use the most energy and where to focus efficiency efforts.

Figure 11.10 Source: U.S. EIA, Manufacturing Energy Consumption Survey, 2006.
Once a comprehensive list of efficiency opportunities has been developed it is now the energy team’s responsibility to prioritize this list. The priority of any given project can depend on many different factors in addition to the amount of energy saved. These factors can include:
- Payback or return on investment
- Critical importance of equipment to business
- Possible need to replace related equipment soon
- Maintenance costs
- Capital needed to cover project cost
- Safety concerns or risks related to project
- Staff time needed
- Relative risk of energy savings realized
- Production considerations
Once these and other factors are considered for each project the team can rank the projects and begin to develop a short and long term schedule for implementation. Some projects may take very little time and effort to implement, like reducing the pressure supplied by a compressed air system. Others may require significant capital and need to be included in the capital project approval process within the business. The prioritiy project list should always be considered a living document with changes made as new information is obtained.
This initial project list will be the foundation of the energy management plan that the team will develop. The next step for the team is to create a multi-year schedule for project implementation. The schedule will depend on many factors including type of opportunity, capital available, and staff time available. Once the list and schedule of project implementation is complete the energy team can set realistic energy management goals. These goals should reflect the opportunities that have already been identified, but provide an additional amount to motivate the team to continue to push for new opportunities. Many industrial companies with active energy management programs have established goals to reduce energy intensity by 10% to 25% over 5 to 10 years. The result is an energy intensity reduction of about 2% to 3% per year, but for most companies the largest reductions occur in the first few years. The final step for the plan is for the energy team to combine the overall facility energy information, energy intensity values, the prioritize project list, the proposed project schedule, and the energy reduction goals into an energy management plan. Typically, this plan is presented to upper management within the company for final approval.
Establish a system for continual improvement
Once a multi-year energy management plan is in place, the energy team moves from the planning stages to the implementation stages, although some implementation of short term and quick payback projects may have been completed before the final approval of the plan. During the implementation phase of the plan the energy team’s responsibility is to ensure that the plan is implemented effectively and on schedule. The energy team meetings are primarily focused on developing the tasks and assignments needed to move the projects to completion. Each team meeting will include an update on each project’s progress and the trends on overall facility energy intensity.
With a culture that values energy efficiency, the industrial facility will want to continually find ways to reduce its energy intensity. Many organizations use different types of continuous improvement approaches within their business processes such as for safety or product quality. For these organizations a continual improvement approach to energy management will usually be easier to establish. The measure of success for the applied continuous improvement approach is the reduction in the energy intensity value relative to production over time.
Figure 11.11 demonstrates the different planning stages necessary for continuous improvement. The energy management plan meets the first step to achieve the continuous improvement goal. The energy team is responsible for doing the plan and making sure the plan is completed. The team and upper management track and check the results of the energy intensity reduction for each period. Based on the relative success of the implementation of the plan the team and management may act to adjust and improve the plan. There are many methods used to place this continuous improvement approach for energy management within a business. The key is to establish the approach so that the opportunities to reduce costs and improve business health through energy efficiency are not lost with changes such as leaving personnel or different products produced.

Figure 11.11 Planning Cycle for Continuous Improvement.
Enhanced Energy Management Approaches
Energy metering and monitoring
There is an old adage in business that “you cannot manage what you cannot measure.” For effective energy management it is important to consider ways to enhance energy management at a facility by installing additional energy monitoring meters such as electric power or gas meters. These meters might be installed to measure energy in a subsection of the facility such as a production area, or it might be placed on a part of the production process or equipment. Where to put new meters will depend on how the metered data will be used and the size of the potential energy efficiency opportunities. One advantage of installing meters for a specific production area is that the energy costs for that production area can be charged directly to the production area. This kind of accurate energy cost allocation can provide additional motivation to the production area staff to reduce the energy use for this area.
To support energy management, the meters do not always need to be energy meters; they can measure other variables such as temperature, pressure, valve position, or air flow. Installing new meters may provide benefits beyond energy management. Using meters can also provide information to the production staff to help them improve production rates or quality. The information may also be useful to uncover production bottlenecks or to resolve a known production problem. Resolving a production constraint not only increases production capacity, but can result in lower energy intensity or energy use per production unit. A schematic of typical energy management system is shown in Figure 11.12.

Figure 11.12 Schematic of typical energy monitoring system (Drawn by author).
With existing or new meters, it is also important to ensure that the information they measure is effectively used to support energy efficiency improvements. Therefore, it is critical that the data be captured and displayed in an easy to use format. Many energy managers benefit from having a dashboard on their computer that provides this metered information in a real-time format. The software used for these applications should be carefully considered to provide the most effective approach. Some of the features the software should provide include:
- Easy to understand dashboard and graphical displays
- Sufficient data sampling rate
- Flexibility to integrate with existing and new meters
- Capability to set, monitor and flag out of range data
- Communication of significant events through email and smartphones
- Ability to allow user to probe data
- Tracking of energy intensity based on multivariate regression analysis
11.4.2.1 ISO 50001
For some companies it may be valuable to fit their energy management program into the ISO 50001 standard. Established in 2011, ISO 50001 is a voluntary international standard for energy management systems developed by the International Organization for Standardization (ISO). ISO has a membership of national standard organizations from about 160 countries and has developed over 18,600 standards. Their standards try to capture the state of the art within a subject area. ISO 50001 provides a company with the requirement for an energy management system to meet the standard. Many of the elements of the ISO 50001 have been discussed in general above and this standard provides a framework for the energy management system. The standard’s framework includes an organization’s development of:
- Energy policies
- Plan targets and goals
- Approach to use data for make decisions
- Measure and track program results
- Continuous improvement of energy management
Organizations that already use ISO standards for other management systems may be able to integrate ISO 50001 more easily into their business. A company can be certified in conformity with the ISO 50001 standard, but a company may want to use the ISO 50001 approach just to establish an energy management program without becoming certified. The standard does provide the structure for an energy management system, but does not require particular energy reduction targets. Setting energy intensity reduction targets or goals is left to the decision of the organization. The primary sections within the ISO 50001 general requirements are:
- General requirements
- Management responsibility
- Energy policy
- Energy planning
- Implementation and operation
- Checking
- Management review
Other resources for Energy Management
There are many good resources for energy management. Two US national resources are the Department of Energy (DOE) and the Environmental Protection Agency (EPA). The websites for both of these organizations should be reviewed for information and tools that can support an energy management program. Both of these organizations not only have useful information and tools to support energy management, but also have potential recognition for companies that meet certain energy intensity and reduction levels. As of 2013, the EPA uses the Energy Star program and the DOE uses the Better Buildings, Better Plants program to recognize companies that are leaders in energy management.
11.5 Conclusions
This chapter could be useful for those manufacturing energy engineers or management-level of people in understanding and performing energy assessment on actual improvement of energy efficiency in a manufacturing facility. In manufacturing facilities, a major portion of energy consumption is by auxiliary industrial facilities such as lighting, HVAC, compressed air, pumps, etc., to support and enhance the manufacturing processes and operations. In this chapter, the energy consumption of these auxiliary industrial facilities in manufacturing industry are introduced, with examples demonstrated on lighting, HVAC, and compressed air such major energy consumers. Opportunities for improving energy efficiency of each type of these auxiliary industrial facilities are described consequentially with some quantitative case studies presented from our actual industrial energy assessment practices. Industrial energy assessment is an effective way to evaluate, identify and improve the energy efficiency of manufacturing facilities. Energy assessments are nowadays mainly used as a practical approach to provide data and analysis results to support decision-making in energy management of a manufacturing facility. Conducting energy assessment needs both professional knowledge and practical experience on the type of manufacturing facilities. Recently, the ISO 50001 standard was enacted to promote and regulate the energy management practice in industry. In this chapter, the principles, procedures, and effective ways of conducting energy management at a manufacturing facility, including metering and monitoring, are introduced in detail along with the ISO 50001 standard.
References
1. EIA (U.S. Energy Information Administration), Annual Energy Outlook, 2010.
2. EIA (U.S. Energy Information Administration), Manufacturing Energy Consumption Survey (MECS), 2010.
3. IEA (International Energy Agency), Light’s Labour’s Lost, IEA Publications, 2006.
4. SEA (Swedish Energy Agency), Energy statistics for offices, 2007.
5. STI, Förbättrad energistatistik för lokaler – Stegvis STIL – Rapport för år 1 – Inventering av kontor och förvaltningsbyggnader. Statens Energimyndighet, ER 2007:34. STIL 1 2007.
6. IEA (International Energy Agency), Guidebook on energy efficient eleclighting for buildings, 2010.
7. Thomas, Practical Guid to Energy Management for Facilities Engineers and Plant Managers, ASME, New York, NY, 2001.
8. McQuiston, Heating, Ventilation, and Air Conditioning, 6th edition. John Wiley & Sons, Inc, Hoboken, NJ, 2005.
9. Xie, J.L. Yuan, C. “Numerical study of thin layer ring on improving the ice formation of building thermal storage system”, Applied Thermal Engineering, 69, 46–54, 2014.
10. Yuan, C., Zhang, T., Rangarajan, A., Dornfeld, D., Ziemba, B., and Whitbeck, R. “A Decision-based Analysis of Compressed Air Usage Patterns in Automotive Manufacturing”, Journal of Manufacturing Systems, 25 (4), pp. 293–300, 2006.
11. Energy tips: minimize compressed air leaks, U.S. Department of Energy
12. Mull, Thomas E., Practical Guide to Energy Management for Facilities Engineers and Plant Managers, ASME Press, 2001.