
Chapter 10
Energy Considerations in Assembly Operations
Camelio, J.A.1*, McCullough, D.2, Prosch, S.2 and Rickli, J.L.3
1Virginia Tech, Industrial and Systems Engineering Department, Blacksburg, VA, USA
2Volvo Trucks, North America, Greensboro, NC, USA
3Wayne State University, Industrial and Systems Engineering Department, Detroit, MI, USA
Abstract
This chapter introduces readers to assembly processes and methods and the energy these operations consume. Assembly is the realization of a product that has progressed through design, redesign, testing, and component manufacturing. It is the culmination of work by designers, engineers, machinists, and others required to produce high quality, functional products quickly enough to meet demand. This chapter introduces energy use in assembly operations as it relates to energy efficient manufacturing. Energy consumption analyses have the potential to influence assembly workstation design, material handling, and part locating, as well as upstream fastener design or selection decisions.
Energy consumption in assembly operations is described though (1) introducing assembly systems and process, (2) classifying assembly energy consumption and discussing joining methods, (3) measuring and assessing energy consumption of assembly systems, and (4) an actual case study from automotive manufacturing. Rivets, welds, screws, and snap-fits are some of the joining methods discussed in the chapter. Gross and fine assembly motions are discussed in terms of robotic, manual, or hybrid robotic/manual motion methods. Motion discussions are restricted to within the assembly process and exclude storage to assembly movements. Theoretical concepts are strengthened with a case study from an automotive assembly plant. The case study evaluates energy consumption in rigid body heavy duty truck assembly for vehicle and powertrain assembly processes. It is expected that this chapter will provide readers with a better understanding of energy consumption in assembly operations and approaches to improve energy efficiency without sacrificing capacity, quality, or performance.
*Corresponding author: [email protected]
Keywords: Assembly Systems, Joining, Energy Assessment, Automotive Assembly
10.1 Introduction to Assembly Systems & Operations
Assembly is one of the most significant stages in production systems, as it unites design, functionality, engineering, and manufacturing. Thus, addressing energy concerns in assembly will contribute to improving the efficiency of a manufacturing sector that accounts for a significant share of US energy consumption and that is projected to increase energy consumption [1, 2]. Improvement opportunities through understanding and characterizing energy and material flows in all manufacturing enterprise stages (such as assembly) exist [3, 4], as indicated by the International Energy Agency (EIA) evaluation that the energy intensity of most industrial processes is at least 50% higher than the theoretical minimum [2]. This chapter strives to characterize and evaluate energy consumption in assembly operations, which is not fully understood. More specifically, this chapter provides: an overview of assembly operations and their potential energy consumption, a framework for characterizing and evaluating assembly energy consumption, and a case study from automotive manufacturing to highlight assembly energy management strategies.
Assembly, in its broadest sense, is the process of joining one or more parts. More specifically, assembly aggregates all of the processes by which various parts and subassemblies are built together to form a complete, geometrically designed assembly or product. Assembly influences product development, shape design, and, in many cases, validates the delivery of quality parts throughout manufacturing logistics networks. In aggregating these processes, it should also be noted that not only are parts and subassemblies united, but people, systems, and knowledge are also united. Assembly plays a particularly unique role in a manufacturing enterprise by linking virtually every facet of the organization – people, systems, processes, and products. The result is a vastly complex and integrative system, consisting of people across various departments, supporting manufacturing processes, suppliers in logistics networks, and hundreds to thousands of components. Through assembly, these seemingly independent facets of the manufacturing enterprise unite and concurrently work together to produce a functional product.
Figure 10.1 depicts assembly in the context of the manufacturing enterprise. Within the manufacturing enterprise, assembly can be broadly classified into two levels: assembly in the large and assembly in the small. Assembly in the large includes all business and system level aspects (logistics, operations, suppliers, etc.) while assembly in the small includes all technical aspects of assembly (individual part joining, tolerances, etc.) [5, 6]. Owing to its influence on the manufacturing enterprise, assembly has the potential to make sizeable reductions in the manufacturing sector’s share of energy consumption through the adoption of energy management and conservation strategies.
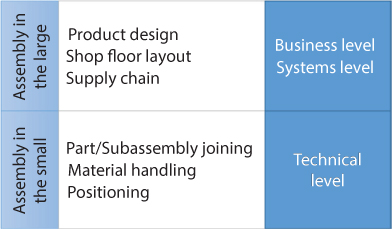
Figure 10.1 Assembly in the context of the manufacturing enterprise [By permission of Oxford University Press, USA, MECHANICAL ASSEMBLIES: THEIR DESIGN, MANUFACTURE, AND ROLE IN PRODUCT DEVELOPMENT [5] Table 1.1 (adapted)].
10.2 Fundamentals of Assembly Operations
Assembly processes and operations, as described for the automotive industry but generally applicable to most assembly activities, are categorized into three basic classes; material handling, positioning, and joining [7]. Material handling in assembly is defined as the act of transporting components or products to, from, and between assembly processes. Positioning in assembly is the act of placing a part or subassembly in required orientations for joining. Although material movement (material handling and positioning) are non-value added assembly processes, material movement can account for up to 80% of production activity [8]. High quality, defect-free assemblies require reliable and accurate material handling and positioning technologies to meet specifications. Lastly, and most critically, joining encompasses all processes that physically unite two or more parts or subassemblies through various technologies such as welding, adhesive bonding, and riveting.
Modern assembly sets the stage for advanced manufacturing because there are few single part products. Modern products rely on complex design processes and advances in assembly methods that empower efficient mass production, in terms of energy and other criteria. Assembly methods are characterized by the equipment used and the level of human operation in the assembly operations, categorized as manual, automated, or integrated/hybrid (semi-automated systems). Manual operations allow for high flexibility and adaptability that could arise during assembly operations as a result of changing conditions in product model demands, part variations, or misalignments. Therefore, operations with low volume or highly intricate product features and techniques are most suitable for manual assembly. In contrast, operations with large volumes of simple, repetitive work are most suitable for automation. Integrated assembly systems balance the advantages and disadvantages of manual and automated assembly; more flexibility than automated but less than manual, and higher volume than manual but lower volume than automated assembly. Selection of assembly methods, processes, and operations can be guided by Boothroyd’s et al. [9] factors of suitability of product design, production rate required, availability of labor, and market life of the product. These assembly methods are directly responsible for energy consumption in assembly systems. Energy consumption can potentially be added to assembly method selection factors, provided that the energy consumption of available assembly methods is known and accurate.
10.3 Characterizing Assembly System Energy Consumption
Forms of energy used in a typical assembly system are fuels (i.e., natural gas, coal, and petroleum) and electricity. These forms of energy are transformed into secondary utilities. Fuels are mainly used for space heating, steam generation, material handling vehicles, and curing ovens on paint lines. Electricity is used throughout assembly for many different end uses including motor drives, robotics, and conveyors. Energy, and its continuous supply, is an integral element in maintaining the yield, quality, and day-to-day operation of assembly facilities. It is used in different ways; namely: 1) to light, heat, cool, and ventilate the facility; 2) to produce secondary forms of energy (i.e., utilities); 3) to power equipment used in assembly operations; and 4) as a raw material input for assembly processes. Each energy input is essential to the assembly systems ability to execute material handling, positioning, and joining tasks.
The first step to characterizing assembly system energy consumption is classifying the aforementioned assembly energy forms. Assembly system energy consumption is, firstly, classified as indirect and direct energy (Figure 10.2). Indirect energy refers to all non-process energy required to complete an assembly operation. Direct energy refers to all energy that immediately contributes to assembly operations and processes of assembly systems. Direct energy is further classified into value added and non-value added energy consumption. In relation to Figure 10.1, indirect energy encompasses energy consumed from activities and operations in assembly in the large, while direct energy encompasses value added and non-value added process operations within assembly in the small.
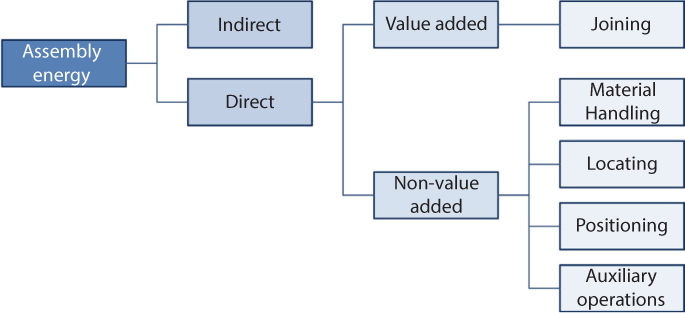
Figure 10.2 Assembly system energy characterization tree.
10.3.1 Indirect Energy
Indirect energy in manufacturing is defined here as energy consumed by utilities of an assembly system. This includes energy consumed to maintain the environment such as lighting, heating, or ventilation. Frequently, indirect energy accounts for the vast majority of the overall energy consumed and should be considered for energy improvement gains. While indirect energy can be a large portion of the overall energy consumption, the direct energy related to production and assembly is the main focus of the remainder of this chapter.
10.3.2 Direct Energy
Direct energy is defined here as energy that immediately contributes to the assembly of components. It is further classified into value added and non-value added energy consumption, Figure 10.2. This has also been labeled primary and secondary energy or process and auxiliary energy [10–12]. Neugebauer et al. [12] focuses specifically on the use of this strategy for energy analysis of an assembly operation. Assembly processes are classified as primary (value added/process energy) and secondary (non-value added/auxiliary energy) energy consumption sources. Their approach is based on Lotter’s [10] method, called P-S analysis (Primary-Secondary).
Joining is the primary direct energy process occurring during assembly that is value added, and is generally supported by non-value added, direct energy processes such as manipulator positioning or robot movements. A number of well-recognized techniques for joining parts and subassemblies include mechanical, adhesive bonding, welding, brazing, and soldering. These techniques and their related energy consumption information are introduced in Section 10.4. The energy consumption of each technique differs due to the technology and auxiliary equipment required. When evaluating the energy consumption of these joining methods, consideration should be given to several factors:
- Value-added energy consumption: The energy needs for direct mating (i.e., value added energy) can vary greatly by primary joining methods. Furthermore, primary joining method energy needs can vary greatly by energy source.
- Non-value added energy consumption: A significant share of direct energy can be in the form of non-value added process energy, which facilitates the direct mating operation. Non-value added processes can take place before, during, and/or after direct mating and are necessary to ensure a successful join. These processes vary by joining method and in some cases, can require more energy than the direct mating process.
- Energy efficiency: The ratio at which energy inputs supplied to the processes are transformed into useful work (i.e., energy efficiency) is not uniform. Energy efficiency can vary greatly depending on energy source and joining technique.
10.4 Direct Energy Considerations of Assembly Joining Processes
10.4.1 Mechanical Assembly
Mechanical assembly consists of various fastening methods (permanent and non-permanent) to mechanically mate two or more parts and/or subassemblies. These methods can be achieved as follows: 1) inserting and subsequently tightening discrete hardware components, such as fasteners; and 2) designing or reshaping mating parts and/or hardware components to mechanically interfere with the geometry of each other (i.e., interference fit). The latter, in most cases, results in permanent joints, while the former methods allow for permanent or non-permanent assembly.
Many mechanical assembly processes transfer energy in the form of force, torque, and to a lesser extent in the form of heat. In mechanical assembly processes using threaded fasteners, energy is consumed to advance the fastener component between the mating surfaces and to provide relative force rotation (i.e., torque) to secure the assembly. Threaded fastener analysis has estimated that 80% to 90% of torque energy is absorbed by friction in the joint, resulting in as little as 10% of energy transferred into clamping force [13]. Processes involving the use of non-threaded fasteners also consume energy to advance the fastener component between the mating surfaces; however, some non-threaded fasteners require a deformation stage in which additional forces or temperature variations are introduced to permanently secure the joint. In a similar way, interference fits consume energy to advance either a mating part or hardware component; however, such processes may simultaneously do so under temperature variations to enable thermal expansion or contraction of the mating part. Processes that contribute to mechanical assembly are the shape altering processes required to facilitate mechanical assembly. These include the drilling of holes, and heating/cooling energy to support expansion/contraction.
Electricity, compressed air, and hydraulics are commonly used energy sources in many industrial applications that perform such mechanical assemblies [14]. Each of the different energy sources offer advantages and disadvantages for various drive properties (for example, power density, torque to inertia, velocity range, and response speed) [15]. Hydraulic systems have superior drive properties compared to electric and pneumatic. Electric is superior to pneumatic in velocity range and response speed while pneumatic is superior to electric in power density and torque to inertia [15]. In terms of energy, Thiriez and Gutowski [16] reported significant reductions in energy consumption for hydraulic driven systems when compared to electric. They determined that energy consumption in hydraulic driven systems exhibited a decreasing pattern as throughput increased, whereas energy consumption in electric driven systems remained constant. Similarly, Rydberg [17] indicated hydraulic drives operate at higher efficiencies compared to electric drives, especially at lower operating speeds. Bookshar [18] compared the energy consumption necessary to operate an electric and pneumatic power tool for a typical threaded fastener assembly application in an automotive final assembly plant. For this one assembly application, it was determined that electric assembly tools provided a significant energy savings (62%) over pneumatic tools due to inefficiencies in the pneumatic system.
Mechanical joining offers many advantages that include: 1) low equipment cost; 2) no thermal degradation of parts; 3) little to no required surface preparation; and 4) ease of assembly in non-permanent mechanical assemblies. On the other hand, joining in mechanical assembly can be highly energy inefficient depending on the energy source of the joining equipment. Mechanical assembly can also require the use of fasteners, which increases product weight. For transportation applications this can result in lower energy efficiency throughout the product life cycle [19].
10.4.2 Adhesive Bonding
Adhesive bonding is a joining process in which a bonding agent is used to join two or more parts. The bonding agent, also commonly referred to as an adhesive, is generally a polymer substance capable of joining materials through chemical or physical property changes between the joining surfaces. The joining surfaces are referred to as adherents.
There are several types of adhesives that differ in terms of their strength, durability, and processing technique. In general, adhesives can be separated into two distinct groups: adhesives that are derived from materials of natural origin (i.e., natural adhesives), and adhesives that are produced industrially from synthetic polymers (i.e., synthetic adhesives). In modern day assembly, synthetic adhesives dominate the joining processes in adhesive bonding, specifically structural adhesives. This is particularly the case in manufacturing processes because of their high-strength bonding capabilities and resistance to environmental factors. Applications range from high-strength requirements common in load-bearing structures (i.e., structural adhesives) to holding adhesives in non-load carrying applications (i.e., nonstructural adhesives).
Adhesives may take on a number of physical forms, such as liquids, pastes, powders, sticks, or films. Irrespective of initial physical form, the adhesive must be in fluid form at the time of application to enable intimate contact between the adhesive and the adherent. It must then harden (i.e., cure) to a cohesive solid, with the exception of pressure-sensitive adhesives, as these do not harden. During the curing process, the physical properties of the adhesive are altered and it transforms to a solid state to achieve surface attachment. Some adhesives cure through the application of heat, time (through solvent evaporation or absorption), radiation, light, moisture, pressure, catalyst, activators, and/or multicomponent reactions. Table 10.1 presents the advantages and disadvantages of common curing processes.
Table 10.1 Curing process advantages and disadvantages [20 – Copyright © 2012 (2008, 2004, 1997) John Wiley & Sons Inc.].
| Cure process | Advantages | Disadvantages |
| Light cure | Rapid cure | UV light equipment required |
| Cure on demand | Limited depth of cure | |
| Heat cure | Unlimited depth of cure | Heating equipment required |
| Heat can adversely affect some adherents | ||
| Surface-initiated cure Moisture cure |
Rapid cure | Poor depth of cure |
| Room-temperature process | Long cure time (12-72 hours) | |
| No curing equipment required | Limited depth of cure Humidity requirements |
|
| Mixing reactive components | Unlimited depth of cure | Expensive |
| Good shelf life | Mix ratio critical to performance | |
| Anaerobic | Single-component adhesive | Poor depth of cure |
| Good shelf life | Sensitive to surface contaminants | |
| May require primer |
The reliability and durability of the bonded joint is heavily dependent on the adhesion of the adhesive to the surfaces, the cohesion of the adhesive, and the properties of the bonded materials. Furthermore, a reliable and durable joint requires proper impregnation of the surface by the adhesive, close mating of the surfaces, and maximization of the bonded surface area. Cognard [21] describes the operations to produce a bonded joint as follows:
- Surface preparation, which allows for the adhesion of the adhesive to the adherents;
- Preparation of the adhesive;
- Coating/dispensing of the adhesive to one or both of the adherents;
- Drying, waiting time, open time;
- Heat reactivation of the adhesive;
- Joining of the adherents;
- Pressing; and
- Curing, hardening, polymerization of the adhesive to form a solid bond.
Of the process operations in adhesive bonding, the surface preparation stage is widely acknowledged as the most critical stage in the bonding process [22–24]. This is expected since adhesion is a surface phenomenon. Ebnesajjad [25] noted that in surface pretreatment of a metal surface, cleaning using a solvent or other chemical is always required, and treatment to improve corrosion resistance is almost always required. It was also noted that plastics require entirely different surface pretreatment methods than metals. Surface preparation methods used in industrial manufacturing can be classified as follows [26]:
- Mechanical, such as grit blasting, grinding, and brushing;
- Chemical, such as acid degreasing, and phosphatizing;
- Physical, such as flame treatment, and plasma treatment;
- Electrical, such as corona treatment.
Energy consumption in adhesive bonding varies depending on the chosen design considerations, such as surface pretreatment, processing steps, adhesive, and adherent material. The factors influencing energy consumption in adhesive bonding are numerous, and, to illustrate this, consider the different forms of adhesives – liquids, pastes, powders, and films – that have roughly ten different curing modes at various temperatures and times. Furthermore, there are multiple application methods used to apply the adhesive, methods of pressing the adherents to ensure a reliable bond, and methods to prepare the surface prior to the application of the adhesive. Thus, general energy consumption trends in adhesive bonding are difficult to characterize, resulting in energy consumption of adhesive bonding being dependent on the exact combination of bonding parameters. For surface pretreatment methods, Ebnesajjad [25] reported average power consumption for ultrasonic vapor degreasing, plasma treatment, and corona treatment, at an estimated 10W/in2, 100W, and 1000W, respectively. Although no power consumption estimates were provided for flame treatment, it requires the use of high temperatures, with flame temperatures reported to exceed 2000°C. Similarly, no power consumption estimates were provided for mechanical preparation methods; however, certain mechanical preparation methods, such as grit blasting, often use compressed air, which is widely documented for its energy inefficiencies [27].
Adhesive bonding offers a number of attractive features including: 1) the ability to produce permanent joints for dissimilar materials; 2) permits joining of fragile and thin parts; 3) distribution of the load over the entire surface area of the joint as opposed to localized spots or seams; 4) lighter weight parts; and 5) relatively low curing temperatures (60°F to 650°F), as compared to welding and brazing, which eliminates significant thermal distortion of parts.
The major limitations of adhesive bonding include: 1) long processing time (e.g., curing and processing steps); 2) limited service temperatures; 3) limited bond strength compared to other permanent joining methods; 4) surface preparation requirements; and 5) varying levels of toxicity, ecological, and fire hazards. Although, to the authors’ knowledge, no such review has been presented on the energy and environmental considerations of surface preparation methods, due to their energy intensive nature, these processes are expected to be significant contributors to the overall energy use of adhesive bonding processes.
10.4.3 Welding, Brazing, and Soldering
Welding is a material joining process in which two or more parts (typically metal) are permanently coalesced at their contacting surfaces by establishing a metallurgical atom-to-atom bond. This bond can be achieved through application of heat and/or pressure. Most welding processes supply energy, in the form of heat, to induce a material state change by melting the contacting surfaces so that the parts and/or subassemblies can be joined (i.e., fusion welding). In a limited number of welding processes, energy is supplied in the form of pressure or a combination of pressure and heat to force the joining surfaces together (i.e., solid-state welding). In solid-state welding, if heat is introduced to the welding process, the contacting surfaces are heated to alter the material state to plastic condition (below the surface material melting point).
Brazing is a metal joining process in which a filler metal is melted and distributed between the joining surfaces of two or more parts. In contrast to welding, no melting occurs in the contacting surfaces of the component; melting only occurs in the filler metal. Energy inputs in brazing are primarily in the form of heat. Energy sources used for brazing include electric coils, fuel gas flames, and gas oil. Soldering, similar to brazing, is a metal joining process in which a filler metal is melted and distributed between the joining surfaces of two or more parts. Soldering and brazing are similar, but the temperatures in brazing far exceed those in soldering.
Energy inputs for welding, brazing, and soldering are generally supplied in the form of heat. Power is the rate at which energy is delivered per unit of time from the heat source to the part, and is expressed in Watts. Hence, power transferred to the part per unit surface area is defined as the power density, and is expressed in Watts/millimeter2. Each type of heat source has the capability of supplying heat at different power densities (W/mm2), as well as at different temperatures. Power density and temperature can be used as a valid energy comparison among welding, brazing, and soldering processes, with power density being the most universal of the two methods. Although there is an approximate linear relationship between temperature and energy input, temperature as an energy indicator is limited to select processes [28]. Figure 10.3 shows the power densities of several fusion welding processes. At high energy densities, nearly all of the heat produced is transferred to the component; little to no heat is wasted [29]. Efficiencies for high energy density processes are rated up to 100% efficient [28, 30], whereas arc welding processes are rated up to 85% efficiency [28, 31]. Briskham et al. [32] investigated the energy use of two welding processes (resistance spot welding, friction stir spot welding) and one mechanical assembly process (self-pierce riveting). For resistance spot welding, friction stir spot welding, and self-pierce riveting, energy use (per thousand joints) was 20kWh, 2kWh, and 2.2kWh, respectively.
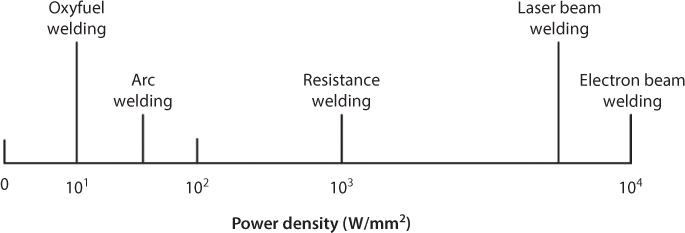
Figure 10.3 Power density during welding processes (not to scale).
Welding, brazing, and soldering consume energy in four primary ways: 1) supplying heat and/or pressure for surface joining, 2) shielding from atmospheric effects, 3) removing surface contaminants, and 4) post-processing the joined surface. The heat energy generated (and subsequent heat losses) must support each of these direct and indirect processes to permit successful joint formation. The first two steps generally take place in all welding operations, whereas all steps are common for brazing and soldering. While certain welding applications require indirect processes, such as thermal and mechanical treatments to remove surface contaminants, such processes are not necessary in all welding applications [33].
Table 10.2 summarizes energy influencing advantages and disadvantages of the primary joining methods in assembly [19]. An advantage of the mechanical joining method is the relatively low primary energy required to join components. However, depending on the energy source, these processes can be very inefficient and have comparable energy use to high energy processes [34]. Other disadvantages of the mechanical joining methods are that it can require additional hardware components, drilling of holes to facilitate joining, and increase in the overall product weight. These factors translate to an increase in material use, scrap, and fuel consumption (in the case of automobiles, aircraft, and other modes of transportation). Adhesive bonding offers advantages in the low energy inputs required to join components. It allows for the bonding of dissimilar and lightweight materials. Furthermore, when compared to mechanical bonding, adhesive bonded products enable lower overall weights due to the lack of additional hardware components [19]. It is believed that the chief disadvantages, in terms of energy use within adhesive bonding, arise in the indirect processes (i.e., surface preparation, heating, ventilation, etc.) required to facilitate the bonding of components. Of all the joining methods, welding, brazing, and soldering require the largest amounts of energy to facilitate joining. In terms of primary joining energy, welding is the most energy intensive.
Table 10.2 Energy influencing advantages and disadvantages of primary joining methods.
| Advantages | Disadvantages | |
| Mechanical | Low energy inputs | Increased weight |
| Joining can require additional hardware components | ||
| Adhesive | Reduced weight | Environmental concerns |
| Increased bonding surface area | Ventilation | |
| Different materials can be bonded | Time | |
| Low energy inputs to create bonds | Limited shelf life of adhesives | |
| Additional indirect steps | ||
| Welding, Brazing, and Soldering | Reduced weight | High energy consumed to create bond |
| Reduced material use |
Joining processes in assembly can be characterized by a number of multistep processes, energy sources, material compositions, and process configurations. In the context of assembly, these factors are all interdependent and can significantly influence energy use. Thus, it is critical that joining methods be considered from design to fabrication to ensure minimal energy is consumed throughout assembly.
10.5 Assembly System Energy Metrics
Assembly energy metrics measure the energy use or contribution of indirect, direct, direct value added, direct non-value added assembly energy. The focus of this section is on metrics for direct value added and direct non-value added assembly energy. Assembly operation energy use can be measured as an absolute value of energy or as a ratio of input and output energy. Absolute metrics identify actual energy use while input/output ratios identify assembly operation energy efficiency. Neugebauer et al. [12] utilizes absolute energy value for two types of workspace analysis: workspace energy consumption analysis (WECA) and workspace intersection analysis (WIA). WECA is used in multi-axes handling systems for optimizing location in the workspace and energy consumption. WIA is used for analyzing complex assembly systems composed of several machines and material handling systems. When using this approach all processes that are linked must be analyzed in relation to each other to gather energy use data. Priority levels are given to each machine involved. The more movements a machine performs the higher the priority level. This is because a machine can have low single energy use per movement but high final energy use due to many movements. Overall, assembly energy consumption analysis strategies identify indirect, direct, direct value added, and direct non-value added consumption activities, measure the energy consumption of these activities, and apply energy efficiency ratios or other such metrics to determine energy inefficient operations and the contribution of different assembly processes to the total energy consumption of an assembly operation.
Feng et al. [35] focused on the measurement science of assembly processes based on the minimum required energy and input/output ratios. Assembly process energy efficiency metrics are a function of energy consumption, loss, and minimum required energy. Energy consuming equipment is characterized in Feng et al. [35] as Unit eQuipment (UQ), which is a single machine with a specific function (e.g., energy input required to weld a joint) and complex eQuipment (CQ), which is a set of UQ that may have more than one function, such as a robot that positions a component and performs a joining operation. UQ metrics are aggregated to create CQ metrics. Energy measurements for these metrics are the energy input (EI) and the energy output (EO). Energy input is energy consumed by UQ and includes source energy that may originate from gasoline, natural gas, solar energy, or nuclear energy. Energy output is the energy delivered to the workpiece (i.e., useful energy) to complete an assembly task [35]. Energy lost (EL) is the difference between the EI and EO and may occur due to vibrations, poor calibration of equipment, friction, energy conversions, or heat transfers from the equipment to the environment. Energy efficiency, ηUQ and ηCQ, is determined by dividing EO by EI for both UQ (Eq. 10.1) and CQ (Eq. 10.2) instances, respectively. Assembly operation equipment is defined as Assembly eQuipment (AQ or ACQ) and Auxiliary eQuipment (auxQ or auxCQ) [35]. In Eq. 10.2, N is the total number of unit equipment within the complex equipment and UQi is the ith UQ equipment.


The efficiency of an assembly process is the ratio of the required energy, ER, of an assembly process (AP) over the energy input of the process (Eq. 10.3). The efficiency of an assembly activity is the total required energy of AP, ![]() over the sum of the energy input of AQ,
over the sum of the energy input of AQ, ![]() , and auxQ,
, and auxQ, ![]() , processes (Eq. 10.4). Assembly process and auxiliary equipment can be in the form of unit equipment (EUQ, EauxQ, or EAQ) or complex equipment (ECQ, EauxCQ, or EACQ). These two efficiency metrics highlight the impact of auxiliary processes on the energy requirement of assembly activities.
, processes (Eq. 10.4). Assembly process and auxiliary equipment can be in the form of unit equipment (EUQ, EauxQ, or EAQ) or complex equipment (ECQ, EauxCQ, or EACQ). These two efficiency metrics highlight the impact of auxiliary processes on the energy requirement of assembly activities.


Required energy represents the amount of energy necessary to complete an assembly process. This energy is estimated by Feng et al. [35] as the Theoretically Required (TR), ![]() , energy plus an error term to account for errors in the theoretical minimum estimation (Eq. 10.5). The actual energy used for joining an assembly (i.e., energy input into an AP),
, energy plus an error term to account for errors in the theoretical minimum estimation (Eq. 10.5). The actual energy used for joining an assembly (i.e., energy input into an AP), ![]() , is the required energy plus the energy losses that occur during process,
, is the required energy plus the energy losses that occur during process, ![]() (Eq. 10.6). In scenario 10.5(b),
(Eq. 10.6). In scenario 10.5(b), ![]() is used as an estimate for
is used as an estimate for ![]() and is calculated by the sum of output energy from assembly equipment,
and is calculated by the sum of output energy from assembly equipment, ![]() (Eq. 10.7) [35], where N is the total number of assembly equipment.
(Eq. 10.7) [35], where N is the total number of assembly equipment.

The total energy input of assembly equipment, AQ, and auxiliary equipment, auxQ, in Eq. 10.4 are calculated by summing each individual AQ and auxQ equipment energy input (Eq. 10.8 and Eq. 10.9). In Eq. 10.8, N is the total number of assembly equipment, AQ, and in Eq. 10.9, M, is the total number of auxiliary equipment, auxQ. ACQ or auxCQ are used if the energy input is composed of complex assembly equipment, Eq. 10.2. Relating these energy values to Figure 10.2; ![]() can be considered direct value added energy and
can be considered direct value added energy and ![]() can be considered direct non-value added energy. The correlation between Figure 10.2 and assembly and auxiliary equipment energy terms may be assembly system specific.
can be considered direct non-value added energy. The correlation between Figure 10.2 and assembly and auxiliary equipment energy terms may be assembly system specific.


Feng et al. [35] illustrates the assembly system metrics via a joining process case study using hybrid laser gas metal arc welding. It was found that the energy efficiency of the specific welding process was 10.93%. The low utilization was due to large environmental losses attributed to the nature of the laser power source (low wall-plug efficiencies), heat intensity of the welding process (lasers and gas metal arc welding), and energy required for laser power source cooling.
10.6 Case Study: Heavy Duty Truck Assembly
To illustrate the methods, strategies, and techniques of energy efficient assembly, we present a case study from an automotive manufacturing plant in southwest Virginia. The intent of the case study is to illustrate energy consumption analysis from a real assembly operation to identify available energy information and conclusions/improvements that can be recommended. The case study details the plant’s energy analysis approach, assembly process categorization, results, and recommendations for improving energy efficiency. Recommendations are based on energy consumption results that indicate major contributors to energy consumption from an operational assembly process line. Heavy duty truck frame assembly is the focus of this chapter’s case study, which includes 59 operations across 3 joining stations of the assembly line. These 3 stations on the assembly line join major components to the frame. Major components include the fifth wheel, cab mount brackets, hood mount brackets, and stanchions. Remaining assembly processes join minor components such as routing brackets and subassembly of other components.
10.6.1 Case Study Energy Consumption Analysis Approach
In order to properly evaluate energy use of the assembly process, each energy input was considered and each process was categorized to gain insight into the full energy consumption picture. The approach taken in this case study was to consider both the energy consumption at the individual process level (direct value added and direct non-value added) as well as the facility level (indirect) to account for energy consumption for assembly processes and for maintaining the work environment. This approach differs from that described in Section 10.5 in that it also includes the energy consumption at the indirect, facility level. Once each process was categorized, the energy source was determined to properly estimate its energy consumption. The energy inputs considered in this case study are battery, electric, pneumatic, and hydraulic.
Energy auditing is a widely used method for estimating energy consumption in commercial, residential, and industrial facilities. As defined by the Standard EN 16247-1 [36], energy auditing is “a systematic procedure to obtain an adequate knowledge of the profiles of energy consumption of an existing building or group of buildings, an industrial and service private or public, in order to identify and quantify in terms of cost effectiveness of energy saving opportunities and the relationship of what is revealed.” In industrial assembly facilities, primary energy sources are in the form of electricity and fuels. These sources are then either used directly or converted into secondary energy sources, such as pneumatic, hydraulic, or battery powered energy. The energy audit of the assembly operation in question serves to identify all energy streams in the assembly process. Therefore, the assembly system was first analyzed to determine all of the energy consuming processes associated with the assembly system. Second, each energy consuming process is itemized. Third, energy consuming processes are classified by each process, equipment, and/or systems by energy source. Next each process, equipment, and/or system, is categorized according to the process data requirements shown in Table 10.3. Although the focus of this case study was not on indirect energy, it should be noted that as much as 73% of the energy consumption in industrial facilities is consumed in lighting, heating, ventilation, and air conditioning (HVAC) [37].
Table 10.3 Case study energy sources with associated energy data.
| Energy source | Process data requirements |
| Electricity | Equipment Power Rating |
| Pneumatic | Air Consumption |
| Hydraulic | Equipment Power Rating |
| Battery | Voltage/Battery Capacity |
| Natural Gas | Rate of Consumption |
Following identification and classification of the processes, equipment, and/or systems by energy source, assembly energy consumption can be calculated using the procedure outlined in Example 10.6(a). Each assembly process, equipment and/or system is quantified in the facility. During this time, we also record equipment specifications. Next, the operation time is determined using usage logs, meters, or rough estimates. The data gathered in Steps 1 – 3, are used as inputs for the energy consumption equations (Eq. 10.10–10.13). Estimation of assembly energy consumption is presented in Kilowatt-Hours.
10.6.2 Assembly Process Categorization
In the case study, assembly processes, similar to Section 10.3, are assigned to one of two categories: direct and indirect processes. Table 10.4 organizes the case study processes by types and lists the common energy sources for each process along with a list of variables of interest, which are necessary to estimate the annual energy consumption in Kilowatt-Hours (KWh).
Table 10.4 Case study assembly process categorization.
| Category | Energy sources | Electric | Battery | Pneumatic | Hydraulic | Natural gas | |||
| Variables of interest | -Power rating (HP or KW) -annual hours of Use | -Battery voltage -Battery capacity (Ah) -# of charges/day -Days of production |
-Air consumption (CFM) -Annual hours of Use |
-Power rating (HP or KW) -Annual hours of Use |
-Natural gas consumption/day (MMBTU/Day) -Days of production | ||||
| Process Framework | Direct Energy | Value Added | Joining | Assembly | X | X | X | X | |
| Weld | X | ||||||||
| Glue | X | X | X | ||||||
| Rivet | X | X | X | X | |||||
| Coating | Paint | X | |||||||
| Separating | Grind | X | X | X | |||||
| Disassembly | X | X | X | X | |||||
| Non-Value Added | Material Delivery | Fork Truck | X | X | |||||
| Tow Tractor | X | X | |||||||
| Positioning | Hoist | X | X | ||||||
| Fixtures | X | X | X | ||||||
| Feeding | Chain Drive | X | |||||||
| Conveyor | X | ||||||||
| Indirect Energy | Lighting | X | |||||||
| Heating | X | X | |||||||
| Cooling | X | ||||||||
| Ventilation | X | ||||||||
| Process | X | X | |||||||
Using Table 10.4, the assembly processes within the station of study on the assembly line can be categorized in order to more easily calculate the annual energy consumption. The number of pieces of equipment totals 59, which includes direct and indirect related processes, while the direct value added and direct non-value added processes account for 38 of those. The processing equipment used within the area of study can be seen in Table 10.5, where it has been separated into direct energy (value added/non-value added) and indirect process equipment by source type. The equipment used in the direct value added processes includes torque guns, which are used for different assembly operations. Direct non-value added processing equipment consists of positioning and delivery operations such as hoists used for lift assist, chain drive advancing the product through the assembly line, and the material delivery by fork trucks and tow tractors.
Table 10.5 Processing equipment of the assembly station.
| Energy source | Direct process |
Indirect process |
||||
Value added |
Non-value added |
|||||
Torque guns |
Hoists |
Material delivery |
Chain drive |
Lighting |
Fans |
|
| Electric | 6 |
3 |
- |
1 |
17 |
3 |
| Pneumatic | 15 |
- |
- |
- |
- |
- |
| Battery | 8 |
- |
4 |
- |
- |
- |
| Hydraulic | 2 |
- |
- |
- |
- |
- |
| Total | 31 |
3 |
4 |
1 |
17 |
3 |
The value added direct processes include torque tools that use many different energy sources like electric, battery, pneumatic, and hydraulic. The pneumatic tools are the most common in this station on the assembly line and can include items like an Uryu ULT100, which uses compressed air as a power source. Battery powered torque tools are the next most common energy source and include tools such as a Milwaukee M18 FUEL™ 3/8” Impact Wrench and a DeWalt 12-Volt Max Li-Ion Cordless 3/8” Impact Wrench. The electric torque tools used on the assembly line consist of items like an Atlas Copco ETD ST101-750-25 or an Atlas Copco ETX72-450CT that are powered directly by the electrical system. Hydraulic tooling used on the assembly line consists of items like an Alcoa Huck PowerRig 918-5, which uses an electric hydraulic pump to power the tools.
The non-value added direct processing equipment consists of tools for positioning and material delivery like hoists or fork trucks. Tools used to move and position the components and product consists of items like Harrington NER003S hoist and a Hyster E50Z 48V forklift. The hoists used on the assembly line are all electric powered. All of the forklift and tow tractors are battery powered. Lastly, the chain drive advancing the product along the assembly line uses an electric motor. Indirect processing equipment that maintains the assembly environment includes lights for an acceptable visible working environment and comfort fans to keep suitable temperature for the assembly operators. Each one of these items is also powered by the facility electrical supply.
10.6.3 Case Study Energy Analysis Results
Having achieved process categorization and energy source identification, it is possible to estimate the annual energy consumption. Using the variables of interest from Table 10.5, the annual energy consumption of each piece of equipment is estimated. Table 10.A.1 in Appendix 10.A summarizes the list of equations used to estimate the annual energy consumption. This section identifies several example calculations using the equations from Table 10.A.1 to estimate the annual energy consumption for both direct and indirect process equipment. Each item is estimated based on annual energy consumption in KWh in order to maintain the ability to compare each process consistently.
Value added direct energy assembly process equipment includes items with energy sources like battery powered, pneumatic, electric, and hydraulic. The annual energy consumption for the battery powered tools was estimated by identifying first the working voltage of each tool and the battery capacity it uses in Amp-Hours (Ah). Multiplying these two values yields an estimate of the energy in Watt-Hours for each charge of the battery. Then, by identifying the number of charges required per day and estimating the number of production days annually, the estimated annual energy consumption for each tool is calculated. An example calculation can be seen in Example 10.6(b) and Table 10.6.
Table 10.6 Annual energy consumption - Battery.
| (V)x(Ah) | (Charges)* (battery capacity) | (KWh)* (5 days) | (KWh) (48 Weeks) | ||||
| Type | Voltage | Battery Capacity (Ah) | Kilowatt Hours / Battery | # of Charges/Day | KWh/Day | KWh/Wk | KWh/Yr |
| Torque Tool | 18 | 4 | 0.072 | 2 | 0.144 | 0.72 | 34.56 |
Annual energy consumption of pneumatic powered tools must be estimated differently from battery powered tools but follows the same principle of estimating daily KWh consumption and multiplying that across the number of production days annually. Each pneumatic tool has a cubic feet per min (CFM) rating, which is used to estimate energy consumption. It is assumed that every 4 CFM a pneumatic tool consumes equates to 1 horsepower (HP) rating. Once the HP rating is calculated for each tool, it is converted to Kilowatts using the relationship 1HP = 0.746 KW. To estimate the daily KWh consumption of the pneumatic tool, the KW rating and estimated daily processing time the tool are multiplied. A sample calculation can be seen in Example 10.6(c) and Table 10.7 below.
Table 10.7 Annual energy consumption - Pneumatic.
(CFM/4)* 0.746 |
KW * hours |
|||
| Type | CFM | Kilowatts |
Annual hours of Use |
KWh/Yr |
| Uryu ULT100 | 19.3 |
3.6 |
15 |
53.9 |
The annual energy consumption for the remaining electric and hydraulic direct processing equipment was calculated using the same method; taking the HP or KW rating of a piece of equipment, estimating the annual hours of use and multiplying them to get the annual KWh consumed. The hydraulic tools use an electric pump that pushes the hydraulic fluid to the tool so the energy consumed by the tool equals that of the electric motor within the hydraulic unit.
Direct non-value added processing equipment annual energy consumption was calculated using the same method as the electric and battery powered direct process tools. The daily energy consumption was calculated by using either the HP or KW rating of the electric motor or the battery capacity and then multiplying over the number of production days annually. The positioning equipment, hoists, and chain drive are electric powered and the material delivery equipment, fork trucks, and tow tractors are battery powered.
The total annual energy consumption in KWh for the case study is shown in Example 10.6(d) and Table 10.8. The majority of energy consumed in the station is by the material delivery processes (fork trucks) and the facility processes, like lighting. Combining Table 10.4 to categorize processes and the equations for energy estimations in Table 10.A.1 allowed for the calculation of annual energy consumption of assembly processes. Table 10.A.1 also has additional considerations for each of the energy sources not included in this analysis. These considerations can impact the total energy use and energy efficiency of the case study assembly system and should be included in assembly energy analyses if able.
Table 10.8 Direct and indirect process equipment annual energy consumption.
| Energy source | Direct |
Indirect |
||||
Value added |
Non value added |
|||||
Torque guns |
Hoists |
Material delivery |
Chain drive |
Lighting |
Fans |
|
| Electric | 2342 |
50 |
- |
3394 |
37944 |
6043 |
| Pneumatic | 3081 |
- |
- |
- |
- |
- |
| Battery | 132 |
- |
52387 |
- |
- |
- |
| Hydraulic | 298 |
- |
- |
- |
- |
- |
| Natural Gas | - |
- |
- |
- |
- |
- |
| Total | 5853 |
50 |
52387 |
3394 |
37944 |
6043 |
Comparison of the direct and indirect energy consumption in the assembly case study can be seen in Figure 10.4. The indirect energy consumption accounts for 42% of the total energy consumed while the process related energy of the direct value added and non-value added account for 58%. The value added processes accounts for only 5% of the overall energy consumption. In total, 95% of the energy consumption is used for either indirect processes that maintain the assembly environment or for direct non-value added processes that support direct value added assembly processes.
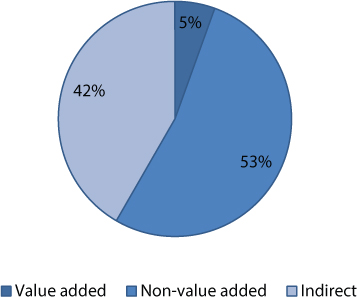
Figure 10.4 Total consumption by energy type.
The composition of the direct non-value added energy consumption can be seen in Figure 10.5. The vast majority of the energy consumption for direct non-value added processes is from material handling processes. The energy consumed by the material delivery processes accounts for 94% of the total direct non-value added energy consumption while the energy consumption of the positioning equipment is negligible. Similarly, the battery powered direct non-value added processes accounts for 94% of the energy consumption. The composition of the direct non-value added energy consumption by energy source is shown in Figure 10.6.
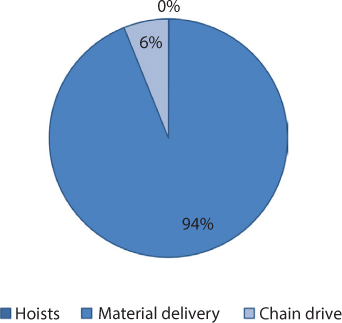
Figure 10.5 Direct non-value added process by equipment.

Figure 10.6 Direct non-value added process by source.
Comparison of the direct value added processes by energy source type can be seen in Figure 10.7. The energy expended on the direct value added processes is dominated by two energy sources, pneumatic and electric. Processes that are pneumatically powered account for 53% of the total direct value added energy consumption while the electric powered direct value added processes account for 40% of the total direct value added energy consumption. The remaining 7% of the energy consumed is by the hydraulic and battery sources, 5% and 2% respectively.
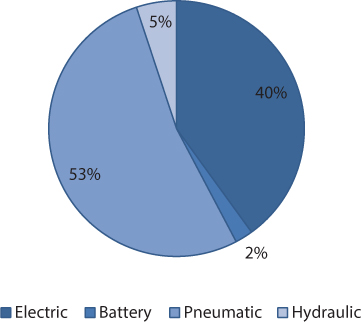
Figure 10.7 Direct value added process by source.
Pneumatic and electric powered tools account for 93% of the total direct process energy consumption mainly because of the amount of tools for each source and the application for heavier assembly. A useful way to compare the different types of tools by energy source type is to look at the power rating for each tool rather than the total amount of energy consumption. This is because of differences in processing times for the tools that may alter overall energy consumption. The power rating, HP or KW, is a sufficient way to compare the energy intensity rather than the gross amount of energy consumed by a tool. Table 10.9 shows the average KW rating for each source type for all of the pieces of equipment in the scope of the case study. Hydraulic powered equipment has the largest average KW rating for an energy source with 7.46 KW while battery powered tools had the smallest with 1.48 KW.
Table 10.9 Energy intensity by source.
| Energy source | Avg. KW rating |
| Hydraulic | 7.46 |
| Pneumatic | 4.53 |
| Electric | 2.2 |
| Battery | 1.48 |
The top five energy intensive assembly processes are listed in Figure 10.8. These processes include both direct value added and direct non-value added processes and rank each process grouping by energy intensity. The top two energy intensive processes are major assembly, which is defined as assembly of large components, and feeding, such as the chain drive. The next three energy intensive processes include another major assembly process, a material delivery process, and a minor assembly process which is defined as an assembly of a small component. Details of the assembly processes in Figure 10.8 cannot be disclosed by the manufacturer.
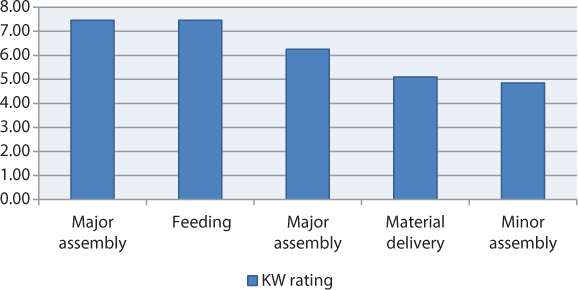
Figure 10.8 Top direct energy intensive processes.
10.6.4 Discussion and Recommendations
Many aspects must be considered when evaluating assembly energy consumption within the manufacturing enterprise. Categorizing processes before calculating energy provides a comprehensive view and a viable framework to determine of energy use and costs. Identifying the major contributors to energy consumption within assembly processes allows for easy identification of assembly activity cost improvement opportunities. As the cost of energy increases, it becomes more important to identify opportunities to reduce assembly process impact on costs and energy consumption. The reduction of energy consumption can increase profitability and competitiveness for an organization. The process categorization and energy calculations described through this case study illustrate one approach for evaluating the energy consumption of assembly processes and improving the performance of an organization. Development of unique frameworks or modifications to the presented frameworks here in this chapter may be required for other assembly systems.
Case study recommendations:
- Evaluate total amount of energy consumed by source type, then identify the most energy intensive tools/processes. The battery powered tools offered the lowest energy intensity for tool energy source type; thus, results suggest converting pneumatically powered tools to battery power. This recommendation also takes into account the potential for air leaks in the pneumatic system, which is not accounted for in the energy intensity rating of the tools.
- Evaluate direct value added/non-value added vs. indirect energy then direct value added vs. non-value added energy to identify the largest energy consumers. The indirect energy consumption accounts for a large percentage and provides a good opportunity for energy reduction; however, once indirect energy is addressed, improves to direct, value-added operations will be required.
10.7 Future of Energy Efficient Assembly Operations
Assembly systems can be very complex and require a systematic energy evaluation approach. This chapter presents a framework for categorizing assembly processes, methods for evaluating energy consumption and energy efficiency, and provides the results of a case study from an automotive manufacturer that illustrates how to transfer the main points from assembly system energy analysis to real scenarios. While the results of the case study indicate that more gains can be made from altering the input energy into a facility, this is still a difficult task and one that manufacturing engineers may find difficult to address. Alternatively, identifying major energy contributors in direct assembly operations can lead to path planning changes or tool replacements to improve energy efficiency. The energy efficient assembly system overview and case study presented in in this chapter is expected to provide a starting point for those interested in energy efficient assembly systems, as well as serve as a useful reference for industrial assembly plant managers and manufacturing engineers.
References
1. DOE, U. Annual Energy Outlook 2005, with Projections to 2025. DOE/EIA, 383, 2005.
2. EIA. Annual Energy Outlook 2014: With projections to 2040. Energy Information Agency, Washington, D.C., 2014. http://www.eia.gov/forecasts/aeo/pdf/0383(2014).pdf
3. Darby, S. (2006). The effectiveness of feedback on energy consumption. A Review for DEFRA of the Literature on Metering, Billing and direct Displays, 486, 2006.
4. Fischer, C. Feedback on household electricity consumption: a tool for saving energy?. Energy efficiency, 1(1), 79 104, 2008.
5. Whitney, D. E. Mechanical assemblies: their design, manufacture, and role in product development (Vol. 1). Oxford university press, 2004.
6. Delchambre, A. CAD Method for Industrial Assembly: Concurrent Design of Products, Equipments, and Control Systems. John Wiley & Sons, Inc., 1996.
7. Michalos, G., Makris, S., Papakostas, N., Mourtzis, D., & Chryssolouris, G. Automotive assembly technologies review: challenges and outlook for a flexible and adaptive approach. CIRP Journal of Manufacturing Science and Technology, 2(2), 81–91, 2010.
8. Apple, J. M. Plant layout and material handling. Wiley, New York, 1977.
9. Boothroyd, G. Product design for manufacture and assembly. Computer-Aided Design, 26(7), 505–520, 1994.
10. Lotter, B., Spath, D., & Baumgartner, P. Primär-Sekundär-Analyse: Kundennutzenmessung und Kundennutzenorientierung im Unternehmen. expert verlag, 2002.
11. Rahimifard, S., Seow, Y., & Childs, T. Minimising Embodied Product Energy to support energy efficient manufacturing. CIRP Annals-Manufacturing Technology, 59(1), 25–28, 2010.
12. Neugebauer, R., Putz, M., Böhme, J., Todtermuschke, M., & Pfeifer, M. New aspects of Energy Consumption Analysis in Assembly Processes and Equipment. In Sustainable Manufacturing (pp. 197–201). Springer Berlin Heidelberg, 2012.
13. Haviland, G. S. Designing with threaded fasteners. Loctite Corporation, 1983.
14. Campbell, F. C. (Ed.). Joining: understanding the basics. ASM International, 2011.
15. Trostmann, E. Water hydraulics control technology. CRC Press, 1995.
16. Thiriez, A., & Gutowski, T. (2006, May). An environmental analysis of injection molding. In Electronics and the Environment, 2006. Proceedings of the 2006 IEEE International Symposium on (pp. 195–200). IEEE.
17. Rydberg, K. E. (2009). Energy efficient hydraulic hybrid drives. In Proceedings of the 11th Scandinavian International Conference on Fluid Power (SICFP’09). Linkoping, Sweden. 2–4 June, 2009.
18. Bookshar, Duane. 2001. Energy consumption of pneumatic and DC electric assembly tools. Tool Smith. http://www.toolsmith.ws/catalogs/Stanley%20Assembly%20Tools/Energy%20-Consumption.pdf
19. Barnes, T. A., & Pashby, I. R. Joining techniques for aluminium spaceframes used in automobiles: Part II—adhesive bonding and mechanical fasteners. Journal of Materials Processing Technology, 99(1), 72–79, 2000.
20. DeGarmo, E. P., Black, J. T., & Kohser, R. A. DeGarmo’s materials and processes in manufacturing. John Wiley & Sons, 2011.
21. Cognard, P. Handbook of Adhesives and Sealants: General Knowledge, Application of Adhesives, New Curing Techniques (Vol. 2). Elsevier, 2006.
22. Messler, R. W. Joining of materials and structures: from pragmatic process to enabling technology. Butterworth-Heinemann, 2004.
23. Adams, R. D. (Ed.). Adhesive bonding: science, technology and applications. Elsevier, 2005.
24. Wegman, R. F., & Van Twisk, J. Surface preparation techniques for adhesive bonding. William Andrew, 2012.
25. Ebnesajjad, S. Handbook of adhesives and surface preparation: technology, applications and manufacturing. William Andrew, 2010.
26. Brockmann, W. Adhesive bonding: Materials, applications and technology. Weinheim: Wiley-VCH Verlag, 2009.
27. Saidur, R., Rahim, N. A., & Hasanuzzaman, M. A review on compressed-air energy use and energy savings. Renewable and Sustainable Energy Reviews, 14(4), 1135–1153, 2010.
28. Singh, R. Applied Welding Engineering: Processes, Codes, and Standards. Elsevier, 2011.
29. Groover, M. P. Fundamentals of modern manufacturing: materials processes, and systems. John Wiley & Sons, 2007.
30. Eagar, T. W. Energy sources used for fusion welding. Spectrum, 10, 10, 1993.
31. DuPont, J. N., & Marder, A. R. Thermal efficiency of arc welding processes. Welding Journal-Including Welding Research Supplement, 74(12), 406s, 1995.
32. Briskham, P., Blundell, N., Han, L., Hewitt, R., Young, K., & Boomer, D. Comparison of self-pierce riveting, resistance spot welding and spot friction joining for aluminium automotive sheet (No. 2006-01-0774). SAE Technical Paper, 2006.
33. American Welding Society - AWS. Welding handbook. 4th ed. New York, 1962.
34. Sullivan, J. L., Burnham, A., & Wang, M. Energy-consumption and carbonemission analysis of vehicle and component manufacturing (No. ANL/ESD/10-6). Argonne National Laboratory (ANL), 2010.
35. Feng, S. C., Senthilkumaran, K., Brown, C. U., & Kulvatunyou, B. Energy metrics for product assembly equipment and processes. Journal of Cleaner Production, 65, 142–151, 2014.
36. BS EN 16247-1 Energy audits. General requirements. BSI, 2012.
37. Brueske, S., Sabouni, R., Zach, C., Andres, H. U.S. Manufacturing Energy Use and Greenhouse Gas Emissions Analysis. (Publication No. ORNL/TM-2012/504). Oak Ridge National Laboratory: Oak Ridge, TN, 2012. Retrieved from: http://energy.gov/sites/prod/files/2013/11/f4/energy_use_and_loss_and_emissions.pdf