Terraform doesn't simply build your resources and write their configuration into a state file. Internally, it also manages a dependency graph of all resources you have. It's hard to see with a single resource, but now we have two interconnected resources: VPC and a subnet. The latter one depends on the existence of the first one. But wait, what is a dependency graph anyway?
First of all, let's recall what a graph is. We won't go deep into mathematical formulas and advanced graph theories and examples here. Graph theory is big, and there are so many applications of it.
Though there are many definitions of the graph, which differ depending on the knowledge area and industry, the simplest description of what it sounds like a set of nodes and edges, where edges represent a connection between two nodes. It's easier to see a graph than to read about it:
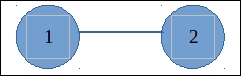
Here, we have two nodes connected to each other. Nothing really complicated. What is a dependency graph then? Let's steal a definition from Wikipedia (https://en.wikipedia.org/wiki/Dependency_graph):
In mathematics, computer science and digital electronics, a dependency graph is a directed graph representing dependencies of several objects towards each other. It is possible to derive an evaluation order or the absence of an evaluation order that respects the given dependencies from the dependency graph.
Here, directed graph means a graph in which edges have a direction. If we update the preceding graph to be directed, it could look as follows:
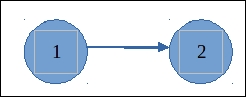
A dependency graph allows us, for example, to properly order creation or destruction of nodes or to order a set of commands. It's all about ordering, actually. When you use a package manager in your operating system, most likely some kind of graph is used to resolve dependencies between packages and install the missing ones.
Dependency graphs are used in many places: compilers, package managers, to build scripts such as Make. Also, of course, it is used by Terraform to handle dependencies and the order of creation and deletion of resources.
There are just three types of nodes in Terraform graph:
- Resource node
- Provider configuration node
- Resource meta-node
What resource node and provider configuration node are responsible for is clear: provider node configures a provider (AWS, in our examples) and resource node manages an entity of this provider (EC2, VPC, and so on, in case of AWS). A resource meta-node doesn't really do anything special and is used for convenience and makes a graph more pretty. It is applicable only if you specify count parameter greater than one.
Note
We will get back to count parameters in Chapter 6, Scaling and Updating Infrastructure.
When Terraform builds a graph, it includes resources both in state file and in your template. It marks the ones that are missing inside template for destruction. For some resources, it creates multiple nodes. In case of recreation, there is one node for destroy action and one for creation, both for the same resource.
Conveniently, there is terraform graph command, which will show you the graph for your template:
$> terraform graph
digraph {
   compound = "true"
   newrank = "true"
   subgraph "root" {
         "[root] aws_subnet.public" [label = "aws_subnet.public", shape = "box"]
         "[root] aws_vpc.my_vpc" [label = "aws_vpc.my_vpc", shape = "box"]
         "[root] provider.aws" [label = "provider.aws", shape = "diamond"]
         "[root] aws_subnet.public" -> "[root] aws_vpc.my_vpc"
         "[root] aws_vpc.my_vpc" -> "[root] provider.aws"
   }
}
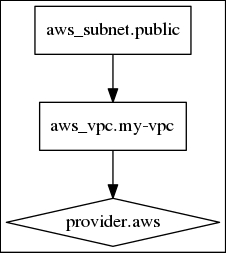
The output of this command may not look very representative, but it is actually in DOT format, which you can easily convert to a picture. For example, if you have the GraphViz package installed, you could do it with the terraform graph | dot -Tpng > graph.png command. All further graphs are generated exactly by this command.
Note
You can find GraphViz packages for various operating systems on the official website http://www.graphviz.org/.
Provider nodes are drawn as rhombus and resources as rectangles. You can clearly see how resources depend on each other on this picture. It is much easier to understand, compared with just looking at the template. We will use graph outputs a lot in this chapter.