Experience of Consolidation Process from Test Areas with and without Vertical Drains
Sven Hansbo Professor Emeritus, Chalmers University of Technology, Gothenburg and Consulting Engineer, Stockholm
Abstract
Two different methods of how to analyse the consolidation process arising due to loading of soft clay deposits are presented, one of which is the classical approach based on validity and the other on non-validity of Darcy’s law at small hydraulic gradients. The two methods of analysis are compared with results of full-scale loading tests on areas without vertical drains and areas provided with vertical drains. Two test areas in Sweden without vertical drains are presented, which have been followed-up by pore pressure and settlement observations for half a century. The results obtained in these test areas is of particular interest since the observed delay in excess pore pressure dissipation in relation to what would be expected according to Terzaghi’s one-dimensional consolidation theory depends on non-Darcian flow and not on secondary consolidation yields better agreement with the pore pressure observations than the theory based on the generally assumed effect of creep. Well-instrumented test areas provided with vertical sand drains or pre-fabricated band-shaped drains, established in Sweden, Thailand and Italy, are also presented. In one of the cases described, surface loading was replaced by the vacuum method. Although the consolidation characteristics of the soil in the test areas and the contract project are quite different, a better correspondence between practice and theory based on non-Darcian flow is obtained in all the studied cases than with theory based on Darcian flow. Finally, a study made in connection with the extension of the Stockholm-Arlanda project with band drain installation the heavy loading condition, causing high hydraulic gradients, results in an acceptable correlation between theory and practice also by assuming Darcian flow.
2.1 Introduction
Land reclamation works and the need to improve infrastructures in areas with bad soil conditions have created an increased interest in soil improvement. Among the methods utilized for this purpose, we find vertical drainage in combination with preloading; deep soil mixing with, for example, lime/cement; electro-osmosis; and heavy tamping (dynamic consolidation). Case records, including all these soil improvement methods, have been published (e.g., Hansbo, 1994, 2004; Moseley and Kirsch, 2004). In this chapter, various aspects of how to analyze the consolidation process that arises due to loading of soft clay deposits are discussed (a complete review of the development of the theoretical approach to the problem of vertical drainage is presented in Moseley and Kirsch, 2004). The results obtained by the analytical solutions are compared with observations made in a number of test areas both with vertical drain installations and without vertical drains. The analysis of the consolidation process is carried out on the classical assumption that Darcy’s law is valid and also on the assumption of non-Darcian flow, as suggested by the author (Hansbo, 1960) in connection with the observations made at the Skå-Edeby test field. The influence on the consolidation process of disturbance effects due to vertical drain installation and due to limited discharge capacity of the drains is discussed and accounted for in the analysis.
2.2 Theoretical approach
A deviation from Darcy’s law has been discussed by several authors (e.g., Brenner, 1946; Kézdi, 1958; Florin, 1959; Miller and Low, 1963; Olsen, 1985; Dubin and Moulin, 1986). Considering the electric double layer and the texture of the clay, a deviation from Darcy’s law is to be expected. Thus, the forces, which bind the mobile phase of the water, gradually become stronger the smaller the distance to the rigid phase. Moreover, the pore space may be filled with mobile particles of colloidal or greater size, which may be bound by sorption forces. As a logical working hypothesis, it can be assumed that, within certain limits, the clay becomes increasingly porous because of the hydrodynamic forces created by increasing hydraulic gradient.
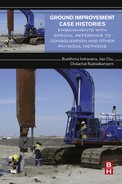
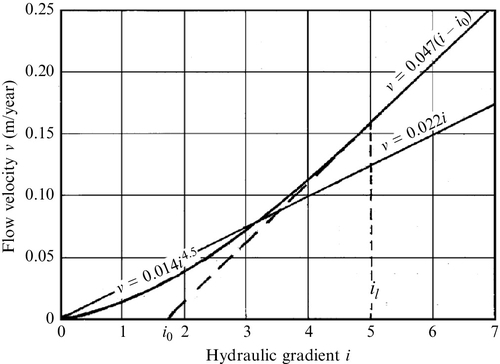
According to laboratory investigations on Skå-Edeby clay carried out by the author (Hansbo, 1960), a deviation from Darcy’s law was observed at small hydraulic gradients. It was concluded that Darcy’s law v = ki, where v = seepage velocity, k = coefficient of permeability, and i = hydraulic gradient, should be replaced by non-Darcian flow, defined by exponential flow correlation v=κin![]() when i≤il
when i≤il![]() , and by linear correlation v=κnin–1l
, and by linear correlation v=κnin–1l![]() (i–i0) when i>il
(i–i0) when i>il![]() , where i0=il(n–1)/n
, where i0=il(n–1)/n![]() (Fig. 2.1).
(Fig. 2.1).
Permeability tests carried out by the author (Hansbo, 1960) indicated i0 values of 1–4 and il values of 3–12, corresponding to n = 1.5. Several authors have reported deviations from Darcy’s law. Florin (1959) reported relations between flow and hydraulic gradient similar to those proposed by the author but suggested they could be replaced by straight lines, in his case intersecting the gradient axis at i0 values as high as 17–31. Permeability tests carried out by Dubin and Moulin (1986) on high-plasticity, moderately organic clay showed similar correlations to those of the author. According to their tests, the il value was in the range of 14–20. A threshold gradient, in reality corresponding to i0, which has to be exceeded before pore water flow takes place—as suggested by, among others, Brenner (1946), Buisson (1953), and Kézdi (1958)—was not observed in either of these investigations.
2.2.1 One-dimensional consolidation
In the following, the analysis of one-dimensional consolidation will be carried out in the two ways mentioned: analysis based on Darcian flow and analysis based on non-Darcian flow.
In the case of one-dimensional consolidation, based on Darcian flow, the theoretical correlation between excess pore water pressure u and consolidation time t at various depths z is given by the relation:
∂u∂t=M∂∂z(kγw∂u∂z)
where k is the permeability, M is the oedometer modulus, and γw is the unit weight of water.
The permeability k is generally decreasing linearly with increasing relative compression ɛ in the log k/ɛ diagram. Consequently, k is a function of the effective stress σ′ (and thus of the excess pore water pressure u). Another fact to be considered is that in the derivation of Eq. (2.1) it was assumed that the oedometer modulus is independent of a change in effective stress σ′. In reality, the decrease in k with increasing relative compression is generally counteracted by an increase in M. Thus, according to the results of oedometer tests, the coefficient of consolidation cv=kM/γw![]() of normally consolidated clay is generally found to be fairly constant under a moderate increase of relative compression and with increasing instead of decreasing tendency.
of normally consolidated clay is generally found to be fairly constant under a moderate increase of relative compression and with increasing instead of decreasing tendency.
This justifies the classical Terzaghi solution (Terzaghi, 1925), where the product of permeability and oedometer modulus is assumed constant, which yields:
∂u∂t=kMγw∂2u∂z2=cv∂2u∂z2
In the case of exponential flow (i ≤ il), we have v=κin=κ(1γw∂u∂z)n![]() and ∂v∂z=1M∂u∂t
and ∂v∂z=1M∂u∂t![]() .
.
Assuming, as in the Terzaghi solution, that κM/γw is independent of u, we have:
∂u∂t=κMn(γw)n(∂u∂z)n–1∂2u∂z2

When I > il, we have v=κnin–1l(1γw∂u∂z–i0)![]() and ∂v∂z=1M∂u∂t
and ∂v∂z=1M∂u∂t![]() , which yields:
, which yields:
∂u∂t=κMnγwin–1l∂2u∂z2
These equations can be solved numerically, for example, by finite element or finite difference methods.
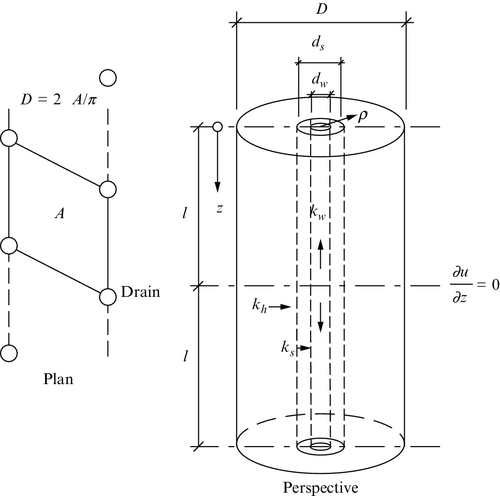
2.2.2 Vertical drainage
The aim of vertical drain installation is to shorten the drainage paths and thereby reduce the time required for the excess pore water pressure, induced by the loading operation, to dissipate. The effectiveness of the vertical drain installation depends on the drain spacing and the discharge capacity of the drains (denoted qw at a hydraulic gradient equal to one, i.e., qw=kwπd2w/4![]() , see Fig. 2.2). The solution to the consolidation problem is greatly simplified if one assumes that horizontal sections due to arching remain horizontal throughout the consolidation process—the so-called equal strain theory (Barron, 1944, 1947). As shown by Barron (1947), this can be justified because the difference in average degree of consolidation between the solutions obtained by allowing the strains to develop freely (no arching)—the so-called free strain theory—and the solution obtained by assuming equal strain theory is negligible. From practical experience, we also know that with the drain types used nowadays there is no evidence of differential settlement between the immediate vicinity of the drains and the center between the drains. Therefore, in the following, only results obtained according to the equal strain theory will be treated.
, see Fig. 2.2). The solution to the consolidation problem is greatly simplified if one assumes that horizontal sections due to arching remain horizontal throughout the consolidation process—the so-called equal strain theory (Barron, 1944, 1947). As shown by Barron (1947), this can be justified because the difference in average degree of consolidation between the solutions obtained by allowing the strains to develop freely (no arching)—the so-called free strain theory—and the solution obtained by assuming equal strain theory is negligible. From practical experience, we also know that with the drain types used nowadays there is no evidence of differential settlement between the immediate vicinity of the drains and the center between the drains. Therefore, in the following, only results obtained according to the equal strain theory will be treated.
The solution based on Darcian flow can be expressed by the relation (Hansbo, 1981):
ˉUh=1–exp(–8chtμD2)
where
μ=D2D2–d2w[ln(Dds)+khksln(dsdw)–34]+d2sD2–d2w(1–d2s4D2)+khd2wks(D2–d2w)(d4s–d4w4D2d2w–d2sd2w+1)+khqwπz(2l–z)(1–d2wD2)

ch=khM/γw
Equation (2.5) gives results that are in good agreement with those obtained by advanced analytical and numerical solutions (e.g., Yoshikuni and Nakanado, 1974; Onoue, 1988; Zeng and Xie, 1989; Lo, 1991).
Assuming an exponential correlation between hydraulic gradient and flow velocity, v=κin![]() , the consolidation equation becomes (Hansbo, 1997a,b):
, the consolidation equation becomes (Hansbo, 1997a,b):
ˉUh=1–[1+λtαD2(Δˉh0D)n–1]11–n
where Δˉh0![]() = ˉu0
= ˉu0![]() /γw (ˉu0
/γw (ˉu0![]() = initial excess pore water pressure, equally distributed), λ=κhM/γw
= initial excess pore water pressure, equally distributed), λ=κhM/γw![]() , t = time of consolidation, M = compression modulus determined by oedometer tests (= 1/mv, where mv is the volume compressibility), and γw = unit weight of water, α=n2nβn/[4(n–1)n+1]
, t = time of consolidation, M = compression modulus determined by oedometer tests (= 1/mv, where mv is the volume compressibility), and γw = unit weight of water, α=n2nβn/[4(n–1)n+1]![]() with
with
β=13n–1–n–1n(3n–1)(5n–1)–(n–1)22n2(5n–1)(7n–1)+12n[(κhκs–1)(Dds)(1/n–1)–κhκs((Ddw)(1/n–1))]–(12n–13n–1)[(κhκs–1)(Dds)(1/n–3)–κhκs(Ddw)(1/n–3)]+κh2qwπz(2l–z)(1–1n)(Ddw)(1/n–1)(1–d2wD2)1/n

Excess pore pressure variation
Replacing the initial excess pore water pressure ˉu0![]() , where Δˉh0
, where Δˉh0![]() with γwΔˉh0
with γwΔˉh0![]() , where Δˉh0
, where Δˉh0![]() is the initial average hydraulic head increase, the variation of the hydraulic head increase
is the initial average hydraulic head increase, the variation of the hydraulic head increase ![]() h outside the zone of smear (D/2≥ρ≥
h outside the zone of smear (D/2≥ρ≥![]() ds/2), based on validity of Darcy’s law, becomes:
ds/2), based on validity of Darcy’s law, becomes:
Δh=Δˉh0μD2(1–ˉUh)[D2ln2ρds–4ρ2–d2s2+khks(D2lndsdw–d2s–d2w2)+khqwπz(2l–z)(D2–d2w)]
Inside the zone of smear for ρ = dw/2 the correlation becomes:
Δh=Δˉh0μD2(1–ˉUh)[D2lnd2wds–d2w–d2s2+khks(D2lndsdw–d2s–d2w2)+khqwπz(2l–z)(D2–d2w)]

The variation of hydraulic head increase outside the zone of smear in exponential flow (D/2≥ρ≥ds/2![]() ), assuming that i≤il
), assuming that i≤il![]() , becomes:
, becomes:
Δh=Δˉh02nβn2(1–ˉUh){F(2ρD)–F(dsD)+κhκs[F(dsD)–F(dwD)]+κhqwπz(2l–z)(1–1n)(1–d2wD2)1/n(dwD)(1–1/n)}

where
F(x)=x1–1/n[1–1–1/n3n–1x2–(1–1/n)22(5n–1)x4–(1–1/n)2(2n–1)6n(7n–1)x6–⋅⋅⋅]
in which the variable x represents 2ρ/D, ds/D, and dw/D.
Inside the zone of smear for ρ = dw/2 the correlation becomes
Δh=Δˉh02nβn2(1–ˉUh){F(dwD)–F(dsD)+κhκs[F(dsD)–F(dwD)]+κsqwπz(2l–z)(1–1n)(1–d2wD2)1/n(dwD)(1–1/n)}
Hydraulic gradient
The hydraulic gradient in Darcian flow outside the zone of smear (D/2≥ρ≥ds/2![]() ) becomes:
) becomes:
i=Δh0D(1−ˉUh)kh/ksμ(Dρ−4ρD)

The hydraulic gradient outside the zone of smear (D/2≥ρ≥ds/2![]() ) in exponential flow, assuming that i≤il
) in exponential flow, assuming that i≤il![]() , becomes:
, becomes:
i=Δˉh0D(1–ˉUh)[κh/κs4α(n–1)(D2ρ–2ρD)]1/n
Comments
The consolidation equations based on exponential flow yield the same result as the consolidation equations based on validity of Darcy’s law when the exponent n→1![]() , for example, by inserting n = 1.0001 (Hansbo, 2001).
, for example, by inserting n = 1.0001 (Hansbo, 2001).
Correlation between λ and ch
The ratio of λ to ch will depend on the hydraulic gradient prevailing in the horizontal direction during the consolidation process. The consolidation equation in exponential flow presupposes that the hydraulic gradient i does not exceed the limiting value il. However, the equation can be applied with good approximation also for values of i > il. Because ch=khM/γw![]() and λ=κhM/γw
and λ=κhM/γw![]() , in which the parameters M and γw are independent of the flow conditions, we have ch/λ=kh/κh
, in which the parameters M and γw are independent of the flow conditions, we have ch/λ=kh/κh![]() . An approximate correlation between ch and λ can be found by equalizing the areas created below the flow versus hydraulic gradient curves in the two cases of non-Darcian and Darcian flow. This yields the correlation
. An approximate correlation between ch and λ can be found by equalizing the areas created below the flow versus hydraulic gradient curves in the two cases of non-Darcian and Darcian flow. This yields the correlation
λ/ch=n+12in–1

when i ≤ il, and
λ/ch≈i22[in+1ln+1+nin–1l(i–il)(i–il2+iln)]–1
when i ≥ il. The maximum hydraulic gradient according to Eqs. (2.9) and (2.10) is obtained for ˉUh=0![]() and ρ=ds/2
and ρ=ds/2![]() . Assuming, for example, that the maximum gradients reached during the consolidation process are, respectively, 2, 5, 15, 25, and 75 and that the exponent n = 1.5 and the limiting gradient il = 8, we find in due order λ/ch=κh/kh
. Assuming, for example, that the maximum gradients reached during the consolidation process are, respectively, 2, 5, 15, 25, and 75 and that the exponent n = 1.5 and the limiting gradient il = 8, we find in due order λ/ch=κh/kh![]() ≈ 0.88, 0.56, 0.34, 0.29, and 0.25. Thus, the higher the value of Δˉh0
≈ 0.88, 0.56, 0.34, 0.29, and 0.25. Thus, the higher the value of Δˉh0![]() and the smaller the drain spacing, the lower the ratio of λ to ch.
and the smaller the drain spacing, the lower the ratio of λ to ch.
Assuming n = 1.5 and imax≤1.5il![]() , the ratio of λ to ch can be obtained by the relation:
, the ratio of λ to ch can be obtained by the relation:
λ/ch=1.25/√imax
where imax=Δˉh0D[12α(Dds–dsD)]2/3![]()
If imax>1.5il![]() , this correlation should be replaced by Eq. (2.16), inserting i=imax
, this correlation should be replaced by Eq. (2.16), inserting i=imax![]() .
.
Influence of one-dimensional consolidation
Vertical drains are generally installed in places where the thickness of the fine-grained soil layer is so large that the influence on the consolidation process of one-dimensional consolidation by pore water escape in the vertical direction between the drains can be ignored. Because the difference in result in the beginning of the consolidation process between the analytical results based on Darcian and non-Darcian flow can be ignored (cf. Fig. 2.10), the contribution to the average consolidation by vertical pore water escape between the drains can be based on the classical Terzaghi solution with Darcian flow ˉUv=(2/l)√cvt/π![]() , valid when ˉUv≤
, valid when ˉUv≤![]() 50% (l according to Fig. 2.1).
50% (l according to Fig. 2.1).
According to Carillo’s relation ˉUtot=ˉUv+ˉUh–ˉUvˉUh![]() , the total average consolidation, including the effect of vertical drainage (horizontal pore water flow) and one-dimensional consolidation (vertical pore water flow), can be expressed by the relation:
, the total average consolidation, including the effect of vertical drainage (horizontal pore water flow) and one-dimensional consolidation (vertical pore water flow), can be expressed by the relation:
ˉUtot=1–(1–2l√cvtπ)exp(–8chtμavD2)
in Darcian flow, and
ˉUtot=1–(1–2l√cvtπ)[1+λtαavD2(ˉu0Dγw)n–1]1/(1–n)
in exponential flow.
A large number of case histories have been publicized (see, for example, the special issue of Géotechnique on vertical drains from March 1981 and the publications by Lo [1991] and Hansbo [1994, 1997a and 1997b]). In the following, results from well-instrumented test areas in different parts of the world will be analyzed on the basis of both Darcian and non-Darcian flow.
Equivalent diameter of band drains
The first type of band drains, the so-called cardboard wick, 100 mm in width and 3 mm in thickness, invented and introduced on the market by the Swedish Geotechnical Institute, was assumed by Kjellman (1947) to have an equivalent diameter of 50 mm. The author (Hansbo, 1979) showed that the process of consolidation for a circular drain and a band drain is very nearly the same if the circular drain is assumed to have a circumference equal to that of the band drain, that is,
dw=2(a+b)/π
where a = the thickness of the drain and b = the width of the drain.
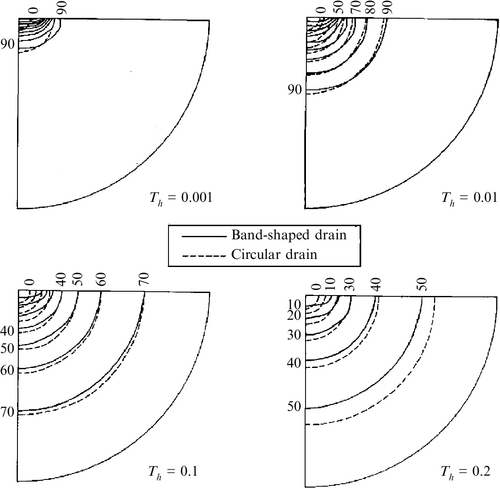
A comparison of the degree of consolidation obtained in the two cases, band drains and circular drains, is shown in Fig. 2.3. This comparison indicates that the equivalent diameter ought to be put somewhat smaller than according to Eq. (2.18). Therefore, Rixner et al. (1986) propose that the equivalent diameter should be put equal to dw=(a+b)/2![]() . However, the difference in result decreases with increasing time of consolidation and is insignificant in comparison with the influence on the result exerted by the choice of other consolidation parameters to be applied in the design.
. However, the difference in result decreases with increasing time of consolidation and is insignificant in comparison with the influence on the result exerted by the choice of other consolidation parameters to be applied in the design.
Zone of smear
The effect on the consolidation parameters of disturbance caused by the installation of drains, expressed in the terms of zone of smear, depends very much on the method of drain installation, the size and the shape of the mandrel, and the soil structure (Sing and Hattab, 1979; Bergado et al., 1993). Two problems exist: to find the correct diameter value ds of the zone of smear and to evaluate the effect of smear on the permeability.
The extent of the zone of smear and the disturbance effects depend on the type of soil and the geometrical dimensions of the installation mandrel. Remolding will take place inside a volume equal to the volume displaced by the mandrel. Outside the remolded zone, disturbance of the subsoil will also occur owing to distortion. The extent of the zone of distortion is a function of the stiffness of the soil. The stiffer the soil, the larger the zone of influence, and vice versa. Investigations of the extent of the zone of smear in the case of displacement-type circular drains indicate that the diameter ds of the zone of smear can be assumed equal to 2 times the diameter of the drain (Holtz and Holm, 1973; Akagi, 1976; Bergado et al., 1992). Recent investigations on a laboratory scale (Indraratna and Redana, 1998) indicate that the extent of the smear zone can be put equal to 3–4 times the cross-sectional area of the band drain. If the installation mandrel is noncircular, which is the normal case, the diameter ds according to this result would yield an area corresponding to about 4 times the cross-sectional area of the mandrel. In many cases the cross-sectional area of the installation mandrel is typically about 7000 mm2 in size, which yields ds ≈ 0.19 m, that is, about 3 times the equivalent diameter of the band drain.
Several authors have treated the other problem, the choice of permeability in the zone of smear. Of course, the permeability in the zone of smear will vary from a minimum nearest to the drain to a maximum at the outer border of the zone. The most conservative solution to the problem is to assume that horizontal layers in the undisturbed soil are turned vertical in the zone of smear, resulting in the quotient kh/ks being equal to the quotient ch/cv (see also Bergado et al., 1992).
Onoue et al. (1991) and Madhav et al. (1993) divide the zone of smear into two subzones: an inner, highly disturbed zone and an outer transition zone in which the disturbance decreases with increasing distance from the drain. Madhav et al. (1993) conclude that the author’s solution based on axisymmetric smear conditions and the assumption of only one smear zone is “reasonably accurate for all practical purposes.” Chai et al. (1997) use in the zone of smear both a linear and bilinear correlation and conclude that the assumption of one single average value of permeability will underevaluate the effect of smear. Hird and Moseley (2000) conclude, on the basis of laboratory tests, that the ratio kh/ks for layered soil, assuming ds = 2dw, can be much larger than that mentioned in the literature but that the assumption of ks = kv in these cases is much too severe.
Effect of well resistance
Because drains nowadays are frequently installed to great depths, well resistance has become a matter of increasing interest. This is understandable as well resistance in such cases can cause a serious delay in the consolidation process.
Before a certain drain type is accepted for a job, evidence ought to be presented that the drain fulfills the requirements on discharge capacity assumed in the design. Generally, appropriate laboratory testing can give sufficient evidence of the discharge capacity to be expected under field conditions, but in the case of a drain type never before used in practice, full-scale field tests are recommended. Full-scale field tests also serve the purpose of showing that the drains are strong enough to resist the strains subjected to them during installation. Moreover, compression of the soil in the course of consolidation settlement entails folding of the drain, which may bring about clogging of the channel system. This effect is difficult to discern in a laboratory test (cf. Lawrence and Koerner, 1988).
Discharge capacity tests on band drains installed in soil on a laboratory scale and subjected to increasing lateral pressure have resulted in the values presented in Fig. 2.4. In the National Authority for Electrical Energy (ENEL) tests (Jamiolkowski et al., 1983) the drains were tested in full scale. In the Chalmers Tekniska Högskola (CTH) tests (Hansbo, 1983) and in the Kyoto University (KU) tests (Kamon, 1984) the drains were tested with reduced width (40 and 30 mm, respectively). The results obtained reveal a great influence on the discharge capacity of the lateral consolidation pressure.

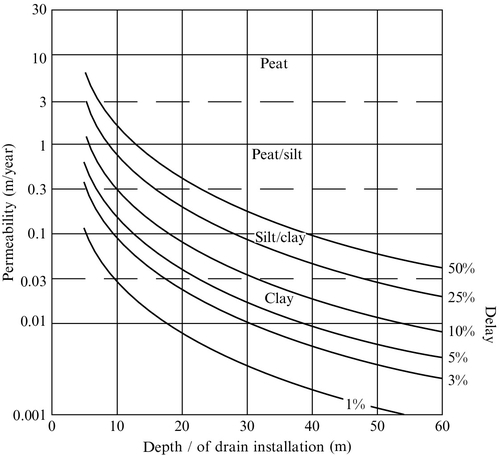
There are several reasons why the discharge capacity of a drain may become low: siltation of the channels in the core of band drains, unsatisfactory drain types with too low a discharge capacity, necking of drains, and so on. Back-calculated values of discharge capacity of drains under field conditions have been reported to be quite low for certain types of band drains without filters (Hansbo, 1986; Chai et al., 1996). If the drain installation is taking place in clay deposits, most of the band drains marketed today have a high enough discharge capacity (qw > 150 m3/year) to become negligible in the design (cf. Hansbo, 1986; 1994). However, drain installation in more high-permeable soils than clay may require a much higher discharge capacity (cf. Fig. 2.5). The influence of well resistance decreases with increasing time of consolidation.
The filter sleeve surrounding the core must be strong enough to resist the tension and the wear and tear that takes place during drain installation. Moreover, the filter pore size should be small enough to prevent intrusion of fine material into the channels of the core, which leads to clogging effects. Filter deterioration in organic soils will cause a time-bound reduction of the discharge capacity (Koda et al., 1986; Hansbo, 1987).
According to Eq. (2.5), an acceptable delay ![]() t (%) in time of average consolidation requires a discharge capacity of minimum1
t (%) in time of average consolidation requires a discharge capacity of minimum1
qw=200πl2kh/{3Δt[ln(D/dw)–0.75]}
For drains with a discharge capacity of 500 m3/year, the delay in the time of consolidation at depth z = l (cf. Fig. 2.2) in various kinds of soil according to Eq. (2.5) is exemplified in Fig. 2.5 (Cortlever and Hansbo, 2004).
For partially penetrating drains, consolidation of the lower part of the layer that is penetrated by the drains will be somewhat delayed by inflow of pore water from the underlying part where the excess pore water pressure is higher. The delay will depend on the discharge capacity, the drain length, and the drain spacing (Runesson et al., 1985). It can be assumed to affect the degree of consolidation to a height above the drain tips approximately equal to the drain spacing.
As a rule, investigations on a laboratory scale of the discharge capacity of a drain ought to be carried out in a way that simulates field conditions as closely as possible, preferably embedded in the soil and at the soil temperature in question. Laboratory testing devices, which are presented in the Eurocode on vertical drainage under preparation (probably accepted and published in 2005/2006 as EN), will most probably be accepted as international standard. One of these devices (Apparatus No. 2, EN/ISO 12958) and also a device for testing the discharge capacity of buckled drains are illustrated by Cortlever and Hansbo (2004).
2.3 Results obtained in test areas
In the following, the results obtained in a number of test areas will be compared with the results obtained both according to the classical assumption that Darcy’s law is valid and according to the assumption of non-Darcian exponential flow.
As regards test areas that have no drains, the importance of a long-term follow-up of the results obtained is crucial. Therefore, only two test areas situated in Sweden, installed in 1947 and 1957, are included in the analysis.
Test areas provided with vertical drains exist all over the world and are of great interest because of the variations in soil condition. In this paper, the results obtained in test areas situated in Sweden, Italy, and Thailand are included.
2.3.1 One-dimensional consolidation
Skå-Edeby test field
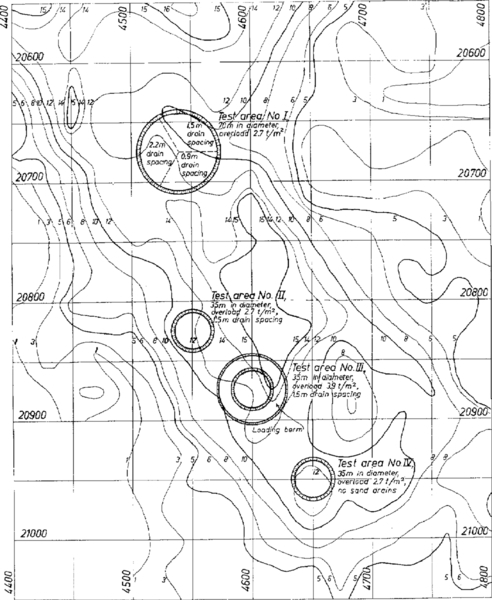
The test areas constructed at Skå-Edeby in 1957 and the depth of the soft clay deposits are shown in Fig. 2.6. Among the different test areas, area IV has no vertical drains while the others are provided with fully penetrating vertical sand drains, 0.18 m in diameter.
The soil consists of postglacial clay to a depth of about 6 m underlain by glacial, varved clay to a depth of about 12.5 m. The groundwater table is situated at a depth of approximately 1 m but varies with the time of year. The dry crust has a thickness of about 1.5 m. The geotechnical characteristics of the clay are shown in Fig. 2.7. According to the results from oedometer tests, the clay below the dry crust is normally consolidated. The compression ratio2 CR=ɛ2/log2=Cc/(1+e0)![]() according to the oedometer tests (Hansbo, 1960) was found equal to about 0.24 at 2 m depth, 0.35 (0.48) at 5 m depth, and 0.32 (0.63) at 8 m depth (the values in brackets are modified with regard to sample disturbance).
according to the oedometer tests (Hansbo, 1960) was found equal to about 0.24 at 2 m depth, 0.35 (0.48) at 5 m depth, and 0.32 (0.63) at 8 m depth (the values in brackets are modified with regard to sample disturbance).

The corresponding oedometer modulus M for a normally consolidated clay can be found by the relation CRlog[(σ′c+Δσ)/σ′c]=Δσ/M![]() , where Δσ is the stress increase due to loading and σc′ is the preconsolidation pressure.
, where Δσ is the stress increase due to loading and σc′ is the preconsolidation pressure.
Excess pore pressure dissipation
The excess pore pressure distribution below the test area, observed at a depth of 5 m after termination of loading, is shown in Fig. 2.8. This can be used in determining the parameters A and B in Skempton’s pore pressure equation u=B[σ3+A(σ1–σ3)]![]() where σ1 and σ3 are the major and minor principle stresses induced by loading (Skempton, 1954). As we are dealing with water-saturated clay, B = 1. If the soil immediately after termination of loading behaves as an elastic medium with Poisson’s ratio ν = 0.5, we have at 5 m depth, according to the solution presented by Love (1929), σ1 = 0.98q and σ3 = 0.60q below the center, σ1 = 0.95q and σ3 = 0.49q 10 m from the center, and σ1 = 0.50q and σ3 = 0.06q 20 m from the center. Inserting q = 27 kN/m2 and considering the observations made, this yields A ≈ 0.85.
where σ1 and σ3 are the major and minor principle stresses induced by loading (Skempton, 1954). As we are dealing with water-saturated clay, B = 1. If the soil immediately after termination of loading behaves as an elastic medium with Poisson’s ratio ν = 0.5, we have at 5 m depth, according to the solution presented by Love (1929), σ1 = 0.98q and σ3 = 0.60q below the center, σ1 = 0.95q and σ3 = 0.49q 10 m from the center, and σ1 = 0.50q and σ3 = 0.06q 20 m from the center. Inserting q = 27 kN/m2 and considering the observations made, this yields A ≈ 0.85.

The analysis of the excess pore pressure dissipation has been based on the consolidation characteristics shown in Table 2.1. In the case of non-Darcian flow, the limiting value of the hydraulic gradient il (where the flow turns from exponential to linear relation of the hydraulic gradient) is chosen equal to 5 (Fig. 2.9).
Table 2.1
Parameters used in the consolidation analysis
| Depth (m) | 0–1.0 | 1.0–1.5 | 1.5–3 | 3–5 | 5–7 | 7–9 | 9–11 | 11–12.5 |
| 27 | 27 | 27 | 26.5 | 26.5 | 26 | 26 | 25 | |
| σc′ (kPa) | OC | 25 | 23 | 28 | 39 | 51 | 64 | 75 |
| M (kPa) | 10,000 | 400 | 250 | 240 | 250 | 300 | 400 | 500 |
| 0.01 | 0.03 | 0.16 | 0.24 | 0.24 | 0.23 | 0.22 | 0.15 | |
| k (m/year) | 0.031 | 0.031 | 0.025 | 0.022 | 0.018 | 0.018 | 0.017 | 0.016 |
| κ (m/year) | 0.020 | 0.020 | 0.016 | 0.014 | 0.0115 | 0.0115 | 0.011 | 0.0095 |
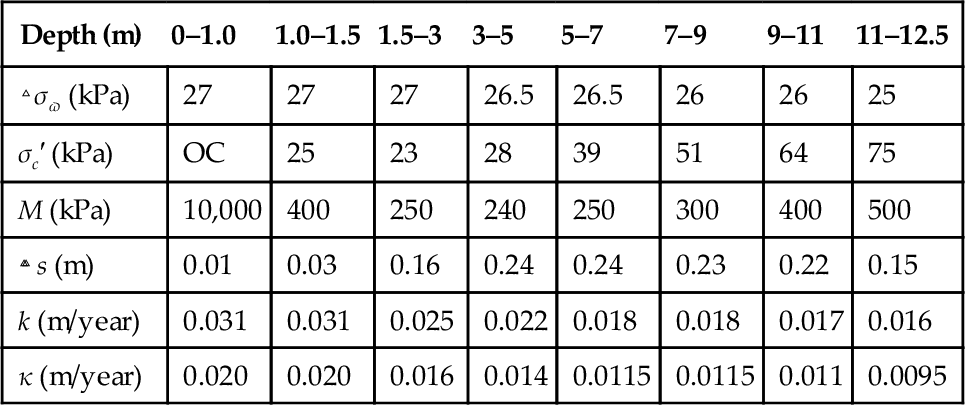
The k and M values given in Table 2.1 are chosen according to Larsson (1986). Based on trial and error, the κ value is chosen equal to about 0.65 times the k value.
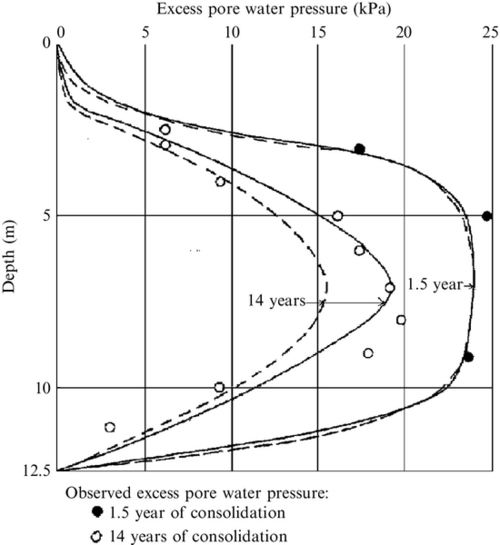
The remaining excess pore water pressure distribution throughout the clay layer below the center of the circular embankment after 1.5, 14, 25, and 45 years of loading is compared with the analytical results obtained according to the two methods of analysis of one-dimensional consolidation (Figs. 2.10. and 2.11).

Initial excess pore water pressure is assumed equal to 25 kPa. Because of the width of the embankment, 35 m, the influence of two-dimensional consolidation at the center of the embankment has been ignored.
As can be seen, the result based on non-Darcian flow is in much better agreement with the excess pore pressure observations than the result based on Darcian flow. There is a possibility that the excess pore water pressure below the center of the load has been affected by pore pressure dissipation due to horizontal pore water flow, but this possibility only strengthens the assumption of non-Darcian flow.
The total primary consolidation settlement, based on the oedometer moduli M given in Table 2.1 and the stress increase σv due to loading, can be estimated at 1.28 m, while the total primary compression of the clay layer between 2.5 and 7.5 m can be estimated at 0.59 m. In the analysis, the effect of load reduction due to hydraulic uplift when part of the load sinks below the groundwater table has been ignored. Thus, owing to submergence of the fill during the course of settlement the load, in kN/m2, will be reduced successively by about γ′s, where γ′ equals the effective unit weight, in kN/m3, of the soil above the groundwater table and of the part of the fill that sinks below the groundwater table and s is the settlement, in meters, of the soil surface. However, one must keep in mind that the groundwater level may vary considerably with time of the year and also that the groundwater level after completed consolidation may differ from its original position. The settlement reduction caused by submergence of the fill may also be fully compensated by secondary consolidation.
The settlement observed in the test area is shown in Fig. 2.12. The settlement of the ground surface, observed after 45 years of loading, equals 1.10 m, while the compression of the clay layer between 2.5 and 7.5 m of depth equals 0.50 m. According to Asaoka (1978), the total primary consolidation settlement sp can be estimated from the relation si=0.300+0761si–1![]() , which yields sp = 1.26 m (si–1→si
, which yields sp = 1.26 m (si–1→si![]() ), and the compression
), and the compression ![]() sp of the clay layer between 2.5 and 7.5 m of depth from the relation Δsi=0.119+0.815Δsi–1
sp of the clay layer between 2.5 and 7.5 m of depth from the relation Δsi=0.119+0.815Δsi–1![]() , which yields
, which yields ![]() sp = 0.64 m.
sp = 0.64 m.
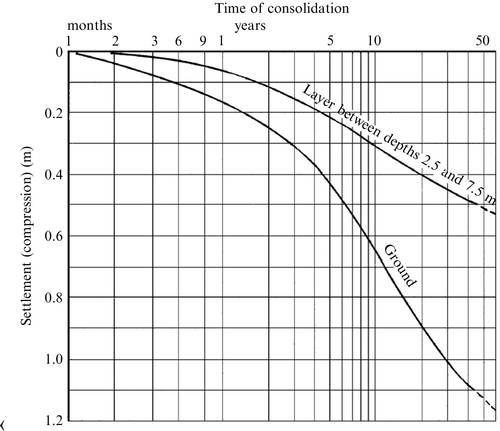
Looking at the remaining excess pore water pressure after 25 and 45 years of consolidation, we find the average degree of consolidation equal to, respectively, 69% and 79%. This leads in both cases to a total consolidation settlement of 1.39 m, about 10% larger than the estimated primary consolidation settlement. For the layer between the depths 2.5 m and 7.5 m, the average degree of consolidation after 25 and 45 years of consolidation becomes, respectively, 62% and 73%, which in both cases would lead to a primary compression of 0.69 m, about 8% larger than the estimated compression according to Asaoka. Considering the excess pore pressure distribution after 100 years of loading, the average degree of consolidation would equal 99% in Darcian flow and 91% in non-Darcian flow. Based on excess pore pressure dissipation in non-Darcian flow, the total settlement achieved after 100 years of loading would become 1.26 m, while the compression of the layer between the depths 2.5 and 7.5 m would become 0.63 m. Ignoring the parameters of the dry crust, the input parameters given in Table 2.1 yield average values of the coefficient of consolidation kM/γw = cv ≈ 0.61 m2/year and κM/γw = λ ≈ 0.39 m2/year.
The back-calculated value of cv is almost 4 times the value determined by oedometer tests. In a case like this with a test area of diameter 35 m placed on a clay layer of 12.5 m thickness, one has to consider the contribution of pore water escape in outward radial direction. This can explain the difference between the oedometer value and the back-calculated value of cv. Moreover, the prolonged consolidation process increases considerably the settlement contribution by secondary consolidation during the primary consolidation period.
Lilla Mellösa test area
The test area at Lilla Mellösa that has no vertical drains was installed in 1947 and the results obtained have been followed up ever since. Together with the test area at Skå-Edeby without vertical drains, presented in the preceding subsection, it belongs to the world’s oldest test areas.
The soil conditions at the Lilla Mellösa test field have been described in detail by Chang (1981). The soil description differs somewhat between Chang (1981) and Larsson (1986). Briefly, underneath a 0.8 m thick dry crust the soil consists of organic clay to a depth of approximately 6 m, underlain first by homogeneous gray clay to a depth of 10 m and then by gray, varved clay to a depth of 14 m, resting on a thin layer of sand on rock (Fig. 2.13).

The natural water content and the liquid limit decreases from about 100% to 130% at the top to about 70% to 90% at the bottom. The unit weight at 3 m depth is lowest, about 14 kN/m3, and increases almost linearly with depth to about 20 kN/m3 at 14 m depth. The undrained shear strength is lowest at 3 m depth, about 8 kPa, and increases almost linearly with depth to about 18 kPa at 14 m depth. The sensitivity increases with depth from about 10 to 20.
The ground surface level is situated at about + 7.0 m. According to the observations presented by Chang, the groundwater level has varied from about + 6.0 m to about + 6.55 m. The clay can be considered as normally consolidated.
The test area without vertical drains is square with a base width of 30 m. It was filled up with 2.5 m of gravel. The top width of the fill is 22.5 m. It has been provided with settlement meters and pore pressure meters. The unit weight of the gravel fill during the filling operation was determined and found equal to 17 kN/m3. This yields an initial load on the test area of 42.5 kN/m2.
Excess pore pressure dissipation
The results obtained in the two test areas included in this paper, Lilla Mellösa and Skå-Edeby, have been analyzed by Larsson (1986) and the results obtained at Lilla Mellösa by Claesson (2003). In Larsson’s analysis, based on the effect of creep on excess pore water pressure dissipation and settlement in the area at Lilla Mellösa that has no drains, the results show good agreement with the observations after 21 and 32 years of loading.
For the analysis, it is important to apply the correct input parameters M, k, κ, n, and il, as well as the correct values of the initial excess pore pressure distribution. Since no observations of deviation from Darcy’s law at small hydraulic gradients has been made on Lilla Mellösa clay, the assumption used in this analysis will be based on the findings related to Skå-Edeby clay, that is, n = 1.5 and il = 5. The values of M are selected from the results of oedometer tests corrected with regard to ring friction, published by Chang (1981), taking into account the load increment obtained at various depths underneath the fill. The k values are in agreement with the values published by Larsson (1986). The ratio κ/k is chosen equal to 2/3, based on the experience from the undrained test area at Skå-Edeby. The values chosen and the initial vertical stress increase ![]() σv below the center of the test area are presented in Table 2.2.
σv below the center of the test area are presented in Table 2.2.
Table 2.2
Parameters used in the consolidation analysis
| Depth (m) | 0–1.0 | 1.0–1.5 | 1.5–3 | 3–5 | 5–7 | 7–9 | 9–11 | 11–14 |
| M (kPa) | 9000 | 200 | 200 | 190 | 160 | 240 | 280 | 200 |
| Δσv (kPa) | 42 | 42 | 41 | 41 | 40 | 39 | 38 | 33 |
| 0.01 | 0.10 | 0.31 | 0.43 | 0.50 | 0.32 | 0.27 | 0.50 | |
| k (m/year) | 0.020 | 0.020 | 0.025 | 0.018 | 0.015 | 0.022 | 0.03 | 0.03 |
| κ (m/year) | 0.013 | 0.013 | 0.017 | 0.012 | 0.010 | 0.015 | 0.02 | 0.02 |

In the analysis, the initial excess pore pressure distribution with depth has been based on the vertical stress distribution with depth below the center of the test area, published by Chang (1981). Of course, this assumption can be questioned. We do not know the magnitude of the pore pressure coefficient A in Skempton’s pore pressure equation. As in the case of the Skå-Edeby test area, we are dealing with water-saturated clay, and thus B = 1. In our case, A is also assumed equal to 1. In consequence, the initial excess pore water pressure has been considered equal to the vertical stress increase caused by the load, decreasing almost linearly with depth from 42 kPa at the ground surface to 32 kPa at the bottom of the clay layer. In reality, the value of A could be higher or lower depending on the loading conditions. As previously shown, the value of A was found equal to 0.85 in test area IV at Skå-Edeby with 1.5 m of fill, corresponding to a load of 27 kN/m2. In our case the fill height is 2.5 m and, from experience of a number of observations, the value of A increases with increasing load. In, for example, the Gothenburg region, A values have been noticed that increase with increasing load from 0.7 to 1.5 (Hansbo, 1994).
The result of the analysis, assuming A = 1, is compared with pore pressure observations carried out 21, 32, and 56 years of loading (Fig. 2.14). The pore pressure observations after 21 years of loading indicate that in reality the pore pressure coefficient A > 1. It could also be that the groundwater level at the time of observation was higher than usual and that the oedometer modulus (representing the coefficient of consolidation) of the top layer, 1 m in thickness, is much lower than assumed. From Fig. 2.14 it can be concluded that the agreement between observations and the results obtained by assuming non-Darcian flow is far better than by assuming Darcian flow.
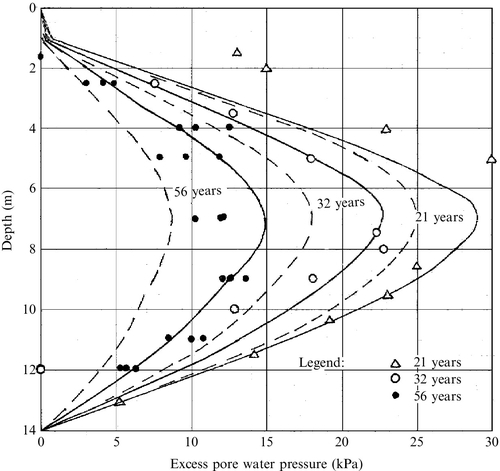
In the analysis of the pore pressure distribution, no consideration has been paid to the fact that part of the initial load will be subjected to hydraulic uplift due to settlement, causing load reduction. As previously pointed out, the groundwater level may vary considerably with time of the year and the groundwater level after completed consolidation may differ from its original position. In addition, the density of the fill may change with time. However, as previously mentioned, the excess pore water pressure is influenced by the magnitude of the pore pressure coefficient. It is therefore important to study the excess pore water pressure distribution during the loading operation to make an evaluation of the pore pressure coefficients possible. Otherwise, a direct comparison between settlement and pore pressure dissipation becomes rather intricate.
Consolidation settlement
A settlement analysis, based on the M and ![]() σv values given in Table 2.2 (the effect of hydraulic uplift disregarded), yields a total consolidation settlement of 2.25 m. Looking at the remaining excess pore water pressure after 21, 32, and 56 years of loading according to the analytical results based on non-Darcian flow, we find the average degrees of consolidation equal to, respectively, 58%, 67%, and 79%. This yields consolidation settlements after 21, 32, and 56 years of loading equal to, respectively, 1.44 m, 1.67 m, and 1.97 m. These settlement values completely agree with the observed settlements, published by Claesson (2003). The primary consolidation settlement estimated according to Asaoka’s method yields si=0.561+0.734si−1
σv values given in Table 2.2 (the effect of hydraulic uplift disregarded), yields a total consolidation settlement of 2.25 m. Looking at the remaining excess pore water pressure after 21, 32, and 56 years of loading according to the analytical results based on non-Darcian flow, we find the average degrees of consolidation equal to, respectively, 58%, 67%, and 79%. This yields consolidation settlements after 21, 32, and 56 years of loading equal to, respectively, 1.44 m, 1.67 m, and 1.97 m. These settlement values completely agree with the observed settlements, published by Claesson (2003). The primary consolidation settlement estimated according to Asaoka’s method yields si=0.561+0.734si−1![]() , from which sp = 2.10 m.
, from which sp = 2.10 m.
The load and consequential settlement reduction due to hydraulic uplift may, as in the case of test area IV at Skå-Edeby, have been compensated by secondary settlement. The estimated average degree of consolidation in 2024, according to non-Darcian flow, becomes 84%, corresponding to a settlement of 2.1 m.
2.3.2 Vertical drainage
Test field at Skå-Edeby
The Skå-Edeby test field was arranged for the main purpose of studying vertical sand drain and band drain behavior. As shown in Fig. 2.6, it originally contained four circular test areas, three of which were provided with sand drains, 0.18 m in diameter, with drain spacing varying from 0.9 to 2.2 m, and one without drains. Later on, a test area was arranged with band drains of type Geodrain, with drain spacing equal to 0.9 m. The test areas were loaded with 1.5 m of gravel (![]() q = 27 kN/m2) except for test area III that was loaded with 2.2 m of gravel (
q = 27 kN/m2) except for test area III that was loaded with 2.2 m of gravel (![]() q = 39 kN/m2). The geology at the site and the geotechnical properties of the different test areas were described in detail by Hansbo (1960). The results obtained have been presented in several publications (Holtz and Broms, 1972; Larsson, 1986).
q = 39 kN/m2). The geology at the site and the geotechnical properties of the different test areas were described in detail by Hansbo (1960). The results obtained have been presented in several publications (Holtz and Broms, 1972; Larsson, 1986).
The compression and consolidation characteristics of the clay in the test areas provided with vertical drains were determined on samples taken at depths 2, 5, and 8 m. The results obtained are shown in Table 2.3 (Hansbo, 1960).
Table 2.3
Compression and consolidation characteristics obtained by conventional odometer tests
| Test area | Drain spacing (m) | CR at various depths, modified with regard to sample disturbance | Minimum cv at various depths (m2/year) | ||||
| 2 m | 5 m | 8 m | 2 m | 5 m | 8 m | ||
| I | 0.9 | 0.40 | 0.50 | 0.83 | 0.13 | 0.32 | 0.16 |
| I | 1.5 | 0.37 | 0.63 | 0.76 | 0.09 | 0.16 | 0.22 |
| I | 2.2 | 0.27 | 0.33 | 0.93 | 0.06 | 0.19 | 0.16 |
| II | 1.5 | 0.27 | 0.50/0.56 | 0.66/0.70 | 0.19 | 0.09/0.13 | 0.16/0.44 |
| III | 1.5 | 0.33/0.37 | 0.43/0.53 | 0.60/0.63 | 0.06/0.13 | 0.16/0.19 | 0.16/0.19 |

The average value of the coefficient of consolidation ch becomes 0.17 m2/year. The coefficient of consolidation in horizontal pore water flow ch, which was determined in an oedometer test where drainage was allowed only through a central drain, was 0.7 m2/year. The corresponding permeability value kh was estimated at 0.03 m/year.
The settlement versus time relationship for the test areas with sand drains and no drains is presented in Fig. 2.15. To facilitate the interpretation of the test results, the settlement curves have been revised to represent a common depth of 12.2 m.

The degree of consolidation in test area III, which was unloaded, is not as well defined as for test areas I and II where we have entered into a stage of secondary consolidation. All the same, a good estimate can be made, based on the shape of the settlement curve. Now the discharge capacity qw of sand drains, 0.18 m in diameter, can be estimated at about 100 m3/year based on sand permeability. According to the results of the oedometer tests ch/cv,av=![]() 4. Assuming a zone of smear ds = 2dw = 0.36 m and a ratio κh/κs=kh/ks=
4. Assuming a zone of smear ds = 2dw = 0.36 m and a ratio κh/κs=kh/ks=![]() 4, an acceptable agreement is obtained if a successively decreasing value of ch is applied, as shown in Table 2.4.
4, an acceptable agreement is obtained if a successively decreasing value of ch is applied, as shown in Table 2.4.
Table 2.4
Best fit of the ch and λ values in test area I, based on settlement
| Drain spacing | 0.9 m (ū0 = 37 kPa) | 1.5 m (ū0 = 31 kPa) | 2.2 m (ū0 = 27 kPa) | ||||||
| Time (years) | 1/6 | 1 | 2 | 1/2 | 1 | 4 | 1 | 4 | 9 |
| Ūtot (%) | 34 | 82 | 94 | 35 | 52 | 92 | 33 | 71 | 89 |
| Ūv (%) | 6 | 14 | 17 | 10 | 14 | 30 | 14 | 30 | 46 |
| Ūh (%) | 30 | 79 | 93 | 28 | 44 | 88 | 22 | 59 | 79 |
| ch (m2/year) | 0.88 | 0.49 | 0.42 | 0.70 | 0.62 | 0.57 | 0.61 | 0.58 | 0.46 |
| λ (m2/year; n = 1.5) | 0.26 | 0.26 | 0.30 | 0.34 | 0.32 | 0.44 | 0.36 | 0.38 | 0.37 |
| Ūh (%; λav. = 0.34 m2/year) | 37 | 85 | 94 | 28 | 46 | 83 | 21 | 55 | 78 |
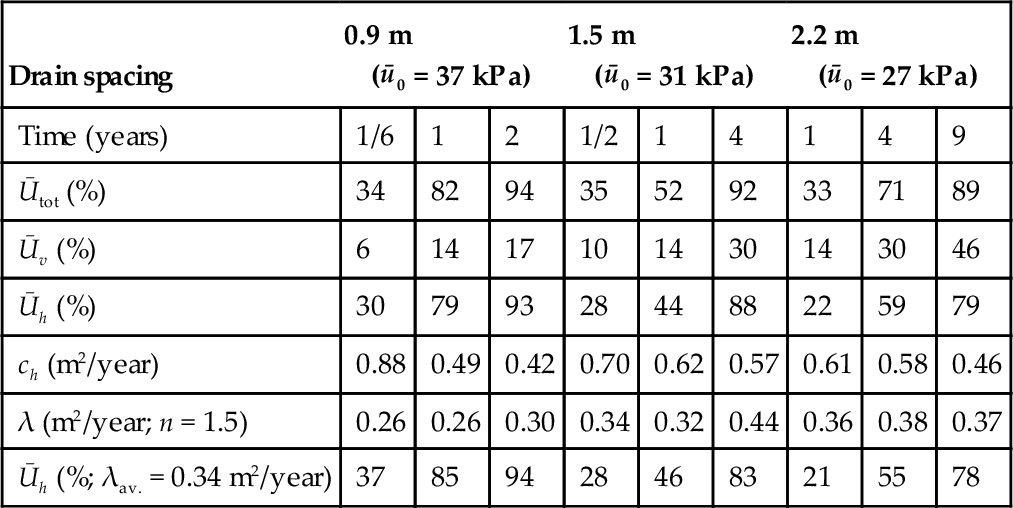
Note: load = 27 kN/m2.
The Ūh values given in Table 2.4 are determined from the measured values of Ūtot and Ūv according to Carillo’s equation. The Ūv values are estimated from the test area at Skå-Edeby without vertical drains, previously described, assuming a final primary settlement of 1.26 m. However, the assumption that Ūv is unaffected by the disturbance due to drain installation, which undoubtedly causes a reduction of the coefficient of consolidation cv, is most certainly overoptimistic.
The λ values are more consistent than the ch values throughout the consolidation process. The ch values are higher at the beginning of the consolidation process than at the end and the overall value somewhat lower than the coefficient of consolidation ch determined in the laboratory (0.7 m2/year).
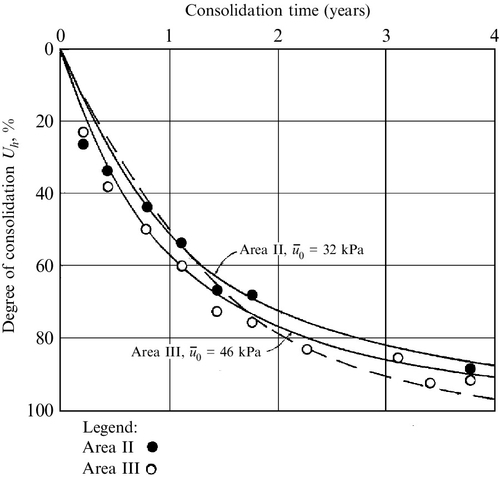
According to Eq. (2.19), the consolidation process in exponential flow depends on the initial excess pore water pressure ˉu0![]() . This is not the case in Darcian flow, Eq. (2.18). In test area III, the initial excess pore water pressure is higher than in test area II. From the test results in areas II and III, we find the best agreement by choosing the values given in Table 2.5. The values of ch are higher in test area III than in test area II.
. This is not the case in Darcian flow, Eq. (2.18). In test area III, the initial excess pore water pressure is higher than in test area II. From the test results in areas II and III, we find the best agreement by choosing the values given in Table 2.5. The values of ch are higher in test area III than in test area II.
Table 2.5
Best fit of ch and λ values in test areas II and III based on total settlement
| Test area | II (ū0 = 32 kPa) | III (ū0 = 46 kPa) | |||||||
| Time (years) | 1/6 | 1/2 | 2 | 4 | 9 | 1/6 | 1/2 | 2 | 4 |
| Ūtot (%) | 20 | 42 | 75 | 90 | 98 | 20 | 45 | 80 | 94 |
| Ūv (%) | 6 | 10 | 19 | 30 | 46 | 6 | 10 | 19 | 30 |
| Ūh (%) | 15 | 36 | 69 | 86 | 96 | 15 | 39 | 77 | 91 |
| ch (m2/year) | 1.04 | 0.95 | 0.63 | 0.52 | 0.39 | 1.05 | 1.05 | 0.78 | 0.65 |
| λ (m2/year; n = 1.5) | 0.47 | 0.46 | 0.37 | 0.39 | 0.42 | 0.40 | 0.44 | 0.42 | 0.46 |
| Ūh (%; λav. = 0.43 m2/year) | 14 | 34 | 73 | 88 | 96 | 16 | 38 | 77 | 90 |

Note: For II, load = 27 kN/m2; for III, load = 39 kN/m2.
The efficiency of using occasional overload to eliminate secondary long-term settlement is demonstrated by the results obtained in test area III. With the load used in test area III, 39 kN/m2, the primary settlement can be estimated at 1.5 m. As can be seen in Fig. 2.15, secondary consolidation did not start until several years after the removal of the occasional overload.
The excess pore pressure dissipation in test areas II and III with different loading condition is shown in Fig. 2.16. In the analysis based on Darcian flow, the consolidation process becomes independent of the magnitude of the load applied, which is not the case when the analysis is based on exponential flow. As can be seen, the best agreement between theory and observation is obtained by assuming exponential flow with the exponent n = 1.5.3
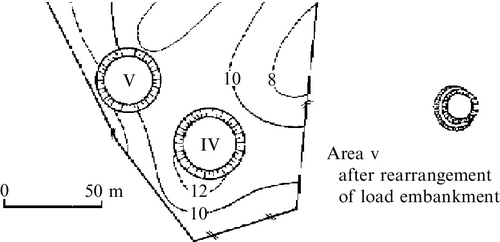
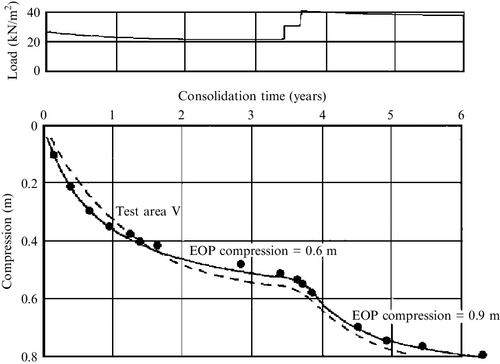
In test area V at Skå-Edeby (Fig. 2.17), band drains of type Geodrain with paper filters were installed with 0.9 m spacing. The initial load, 27 kN/m2, was doubled after 3.5 years of consolidation. In a case like this, the following procedure of settlement analysis is followed.
The degree of consolidation Ū1 and the settlement s1 achieved under load q1 at time t1 when the additional load q2 is being placed is calculated first. The part of the load q1 that is still producing primary consolidation settlement (i.e., Δq=q1(1–ˉU1)![]() ) is added to q2 and the primary settlement process to be added after time t1 under load
) is added to q2 and the primary settlement process to be added after time t1 under load ![]() q + q2 is added to the settlement s1. According to Eq. (2.20), the equivalent diameter of Geodrain (100 mm in width and 4 mm in thickness) is equal to dw = 0.066 m. Assuming a zone of smear ds = 0.19 m and kh/ks=κh/κs=4
q + q2 is added to the settlement s1. According to Eq. (2.20), the equivalent diameter of Geodrain (100 mm in width and 4 mm in thickness) is equal to dw = 0.066 m. Assuming a zone of smear ds = 0.19 m and kh/ks=κh/κs=4![]() , the best fit between observations and theory is obtained by applying the values ch = 0.45 m2/year and λ = 0.23 m2/year with the exponent n = 1.5 (Fig. 2.18).
, the best fit between observations and theory is obtained by applying the values ch = 0.45 m2/year and λ = 0.23 m2/year with the exponent n = 1.5 (Fig. 2.18).
The λ value 0.23 m2/year agrees fairly well with the value obtained in test area I with 0.9 m drain spacing (λ = 0.26 m2/year) and is an indication of increasing average disturbance of the clay with decreasing drain spacing.
The results obtained at Skå-Edeby show that the values of the coefficients of consolidation are smaller than can be expected from the values arrived at in the undrained area. This is the case in spite of the fact that the coefficient of consolidation is normally higher in horizontal pore water flow than in vertical pore water flow due to the structural features of the soil (e.g., due to the existence of sand and silt layers). This obviously depends on the fact that the drain installation causes disturbance effects leading to a reduction of the coefficient of consolidation. The disturbance is evidenced by the fact that the sand drain installation at Skå-Edeby in itself induced excess pore water pressure of maximum 40 kPa at 0.9 m drain spacing, 35 kPa at 1.5 m drain spacing, and 20 kPa at 2.2 m drain spacing (Hansbo, 1960).
Örebro test field
Another example of the calculated versus observed consolidation process based on settlement is given by the results obtained at the Örebro test field, Sweden. This test field, 125 m by 45 m, was arranged just outside Örebro for comparing the efficiency of prefabricated band-shaped drains (of types Geodrain and Alidrain) with that of displacement type sand drains. The test field was divided into three sections of equal size with drain spacing 1.1, 1.4, and 1.6 m in an equilateral triangular pattern. The test area was loaded with 2.2 m of sand and gravel (load ![]() q = 40 kN/m2).
q = 40 kN/m2).
The soil consists of gray, lightly overconsolidated clay, about 8 m in thickness. The clay layer is slightly organic to a depth of 1–2 m and is varved, with silt seams, in its lower part below a depth of about 5 m. The average virgin compression ratio increases from about CR = 0.4 just below the dry crust to about CR = 0.65 in the lower part of the clay layer. The primary settlement, calculated based on the compression ratios and an overconsolidation of about 5 kPa (below the dry crust), was estimated at 1.1 m. The coefficient of consolidation according to oedometer tests varies from a minimum of cv = 0.06 m2/year to a maximum of 1 m2/year. An estimated average is cv = 0.2 m2/year.
The coefficient of consolidation in the case of horizontal pore water flow was not determined.
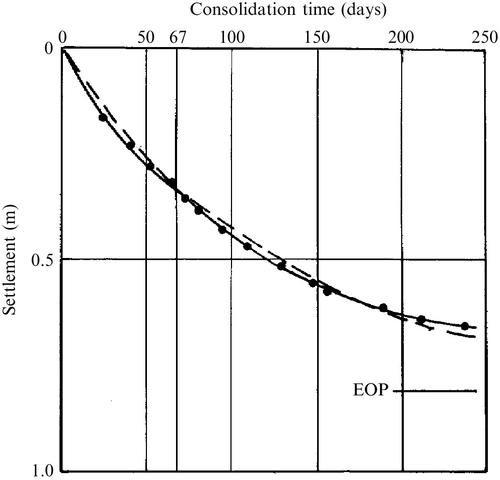
The settlement process observed in the test sections provided with Geodrain and Alidrain was very nearly the same. The results obtained in the test sections provided with Geodrains and sand drains are shown in Fig. 2.19.
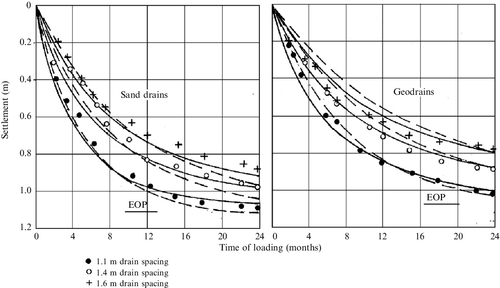
 q = 40 kN/m2. EOP means end of primary settlement. Unbroken lines represent exponential flow, Eq. (2.19) (λ = 0.58 m2/year; n = 1.5), broken lines represent Darcian flow, Eq. (2.18) (ch = 1.15 m2/year).
Using Asaoka’s method for determination of the primary consolidation settlement, we find in the test area provided with Geodrains si=![]() 0.1809 + 0.8343si–1, which yields (si–1→si
0.1809 + 0.8343si–1, which yields (si–1→si![]() )sp = 1.09 m, and for the test area provided with sand drains si=
)sp = 1.09 m, and for the test area provided with sand drains si=![]() 0.4312 + 0.6119si–1, which yields sp=
0.4312 + 0.6119si–1, which yields sp=![]() 1.11 m. These values are in excellent agreement with the settlement estimated on the basis of the oedometer tests.
1.11 m. These values are in excellent agreement with the settlement estimated on the basis of the oedometer tests.
The theoretical analysis of the consolidation process in the case of sand drains is based on the following assumptions: dw = 0.18 m, ds = 0.36 m. The corresponding values for Geodrain are: dw = 0.066 m, ds = 0.19 m. Inserting the parameters kh/ks=κh/κs=![]() 4, l = 4 m, and cv = 0.2 m2/year, the best fit of ch and λ with observations is given in Table 2.6.
4, l = 4 m, and cv = 0.2 m2/year, the best fit of ch and λ with observations is given in Table 2.6.
Table 2.6
Best fit of ch and λ values in the Örebro test areas
| Loading time (months) | 4 | 8 | 12 | 16 | 20 | 24 |
| Sand drains – ch (m2/year) | ||||||
| c/c 1.1 m | 1.01 | 1.04 | 1.02 | 1.02 | 1.03 | 1.03 |
| c/c 1.4 m | 0.85 | 1.03 | 1.14 | 1.02 | 0.90 | 0.67 |
| c/c 1.6 m | 0.99 | 1.24 | 1.07 | 0.94 | 0.87 | 0.85 |
| λ m2/year | ||||||
| c/c 1.1 m | 0.42 | 0.50 | 0.62 | 0.75 | 0.93 | 1.15 |
| c/c 1.4 m | 0.38 | 0.46 | 0.53 | 0.48 | 0.53 | 0.52 |
| c/c 1.6 m | 0.42 | 0.52 | 0.47 | 0.48 | 0.47 | 0.44 |
| Geodrains | ||||||
| ch m2/year | ||||||
| c/c 1.1 m | 1.08 | 1.24 | 1.20 | 1.15 | 1.06 | 1.05 |
| c/c 1.4 m | 1.39 | 1.49 | 1.44 | 1.42 | 1.27 | 1.28 |
| c/c 1.6 m | 1.70 | 1.88 | 1.53 | 1.42 | 1.25 | 1.06 |
| λ m2/year | ||||||
| c/c 1.1 m | 0.36 | 0.50 | 0.57 | 0.64 | 0.60 | 0.67 |
| c/c 1.4 m | 0.66 | 0.74 | 0.67 | 0.65 | 0.59 | 0.52 |
| c/c 1.6 m | 0.57 | 0.57 | 0.62 | 0.69 | 0.61 | 0.67 |

Note: load 40 kN/m2.
The agreement between field observations is better according to Darcian flow at 1.1 m drain spacing, while the agreement according to exponential flow with n = 1.5 is better at 1.6 m drain spacing.
The result of the back-analysis shown in Table 2.6 indicates that the flow condition prevailing in the soil of the Örebro test area follows Darcy’s law better than the exponential correlation. However, as can be seen in Fig. 2.19, the theoretical correlations based on the average of the consolidation parameters shown in Table 2.6, that is, ch = 1.15 m2/year and λ = 0.58 m2/year, show better general agreement between observations and the exponential flow theory.
Bangkok test field
In connection with the planning of a new international airfield in Bangkok, Thailand, three test areas were arranged to form a basis for the design of soil improvement by preloading in combination with vertical drains. The results of the settlement observations in two of these test areas, TS 1 and TS 3, (Hansbo, 1997b) showed a better agreement with Eq. (2.6) than with Eq. (2.5). In this subsection, the results obtained in test area TS 3 will be examined in detail.
The crest width of TS 3 is 14.8 m (square) and the bottom width is 40 m. It is provided with an approximately 10 m wide loading berm of 1.5 m thick. The fill placed on the area amounts to a maximum of about 4.2 m, corresponding to a load of about 80 kN/m2.
The drains of type Mebradrain were installed to a depth of 12 m in a square pattern with a spacing of 1.0 m, which yields D = 1.13 m. The equivalent drain diameter determined according to Eq. (2.20) becomes dw = 0.066 m. The equivalent diameter of the mandrel dm = 0.10 m. The smear zone is estimated at ds = 0.20 m. The permeability ratios kh/ks and κh/κs are assumed equal to the ratio ch/cv.
The consolidation characteristics of the clay deposit, determined by oedometer tests, can be summarized as follows (DMJM International, 1996): average coefficient above the preconsolidation pressure cv = 1.06 m2/year (standard deviation = 0.061 m2/year), ch = 1.37 m2/year (standard deviation = 0.050 m2/year). This yields kh/ks=![]() κh/κs=1.3
κh/κs=1.3![]() (in a paper previously published by the author [Hansbo, 1997b] this ratio was assumed equal to 2). The virgin compression ratio CR varies from 0.3 to 0.55 (average 0.43; standard deviation 0.1) and the average recompression ratio RR = 0.03 (standard deviation = 0.007). The clay penetrated by the vertical drains is slightly overconsolidated with a preconsolidation pressure about 15–50 kPa higher than the effective overburden pressure. The clay below the tip of the drains is heavily overconsolidated. In this case, the influence on the consolidation process of one-dimensional vertical consolidation will be ignored owing to difficulties in assessing the drainage conditions.
(in a paper previously published by the author [Hansbo, 1997b] this ratio was assumed equal to 2). The virgin compression ratio CR varies from 0.3 to 0.55 (average 0.43; standard deviation 0.1) and the average recompression ratio RR = 0.03 (standard deviation = 0.007). The clay penetrated by the vertical drains is slightly overconsolidated with a preconsolidation pressure about 15–50 kPa higher than the effective overburden pressure. The clay below the tip of the drains is heavily overconsolidated. In this case, the influence on the consolidation process of one-dimensional vertical consolidation will be ignored owing to difficulties in assessing the drainage conditions.
The monitoring system consisted of vertical settlement meters placed on the soil surface and at different depths, and of inclinometers to study the horizontal displacements. Unfortunately, the results of the settlement observations at various depths are contradictory and, therefore, only the surface settlement observations can be trusted. The contribution to the vertical settlement of horizontal deformations is analyzed based on the inclinometers placed 7.8 m from the center of the test area. The total settlement observed, including the settlement caused by horizontal deformations, and the corrected settlement curve with regard to the influence on vertical settlement by horizontal deformations (representing the mere effect of consolidation) are shown in Fig. 2.20.

A follow-up of the course of consolidation settlement according to Asaoka’s method, based on settlement observations at equal time intervals, results in the following relation si=0.2625+0.8195si–1![]() , which yields the primary settlement sp = 1.45 m.
, which yields the primary settlement sp = 1.45 m.
The settlement analysis based on Eq. (2.19) is carried out in 4 successive steps: load step 1 with load ![]() q1 = 20 kN/m2; load step 2 with load
q1 = 20 kN/m2; load step 2 with load ![]() q2 = 30 kN/m2; load step 3 with
q2 = 30 kN/m2; load step 3 with ![]() q3 = 10 kN/m2, and load step 4 with
q3 = 10 kN/m2, and load step 4 with ![]() q4 = 20 kN/m2. The primary consolidation settlement caused by a load intensity of 80 kN/m2, determined by the compression characteristics, becomes equal to 1.4 m. By slightly modifying the compression characteristics to yield a final primary consolidation settlement of 1.45 m, we find
q4 = 20 kN/m2. The primary consolidation settlement caused by a load intensity of 80 kN/m2, determined by the compression characteristics, becomes equal to 1.4 m. By slightly modifying the compression characteristics to yield a final primary consolidation settlement of 1.45 m, we find ![]() s1 = 0.15 m;
s1 = 0.15 m; ![]() s2 = 0.6 m;
s2 = 0.6 m; ![]() s3 = 0.2 m, and
s3 = 0.2 m, and ![]() s4 = 0.5 m (in total, 1.45 m).
s4 = 0.5 m (in total, 1.45 m).
The analysis of the consolidation process according to Eq. (2.19) has to be carried out in the following way. The degree of consolidation Ū1, inserting Δˉh1=Δq1/γw![]() , determines the course of settlement in the first load step. When calculating the course of settlement in the second load step we have to apply the value Δˉh2=(1–ˉU1)Δq1/γw+Δq2/γw
, determines the course of settlement in the first load step. When calculating the course of settlement in the second load step we have to apply the value Δˉh2=(1–ˉU1)Δq1/γw+Δq2/γw![]() . The settlement at the end of the load step is obtained from Δs=Δs1ˉU1+[Δs1(1–ˉU1)+Δs2]ˉU
. The settlement at the end of the load step is obtained from Δs=Δs1ˉU1+[Δs1(1–ˉU1)+Δs2]ˉU![]() , and so on.
, and so on.
Now, 50 days after the start of loading (consolidation time t = 50 − 15 = 35 days; Δˉh![]() = 2 m; λ = 0.37 m2/year, n = 1.5) we find Ū = 0.21, which yields s = 0.03 m. In load step 2, the load
= 2 m; λ = 0.37 m2/year, n = 1.5) we find Ū = 0.21, which yields s = 0.03 m. In load step 2, the load ![]() q2 = 30 kN/m2 has to be increased by 0.79 × 20 = 16 kN/m2 corresponding to Δˉh2,corr
q2 = 30 kN/m2 has to be increased by 0.79 × 20 = 16 kN/m2 corresponding to Δˉh2,corr![]() = 4.6 m and
= 4.6 m and ![]() s2,corr = 0.6 + 0.12 = 0.72 m. After 75 days when load step 2 is completed, we find [t = (75 − 50)/2]Ū = 0.12, which yields
s2,corr = 0.6 + 0.12 = 0.72 m. After 75 days when load step 2 is completed, we find [t = (75 − 50)/2]Ū = 0.12, which yields ![]() s = 0.09 m and s = 0.12 m. After 140 days when load step 3 is being applied, we have (t = 12.5 + 65 = 77.5 days)Ū = 0.50, from which
s = 0.09 m and s = 0.12 m. After 140 days when load step 3 is being applied, we have (t = 12.5 + 65 = 77.5 days)Ū = 0.50, from which ![]() s = 0.36 m and s = 0.39 m. This yields
s = 0.36 m and s = 0.39 m. This yields ![]() h3,corr = 3.3 m and
h3,corr = 3.3 m and ![]() s3,corr = 0.2 + 0.36 = 0.56 m. After 220 days when load step 4 is being applied, we find (t = 80 days)Ū = 0.46, from which
s3,corr = 0.2 + 0.36 = 0.56 m. After 220 days when load step 4 is being applied, we find (t = 80 days)Ū = 0.46, from which ![]() s = 0.26 m and s = 0.26 + 0.39 = 0.65 m. This yields
s = 0.26 m and s = 0.26 + 0.39 = 0.65 m. This yields ![]() h4,corr = 1.8 + 2.0 = 3.8 m and
h4,corr = 1.8 + 2.0 = 3.8 m and ![]() s4,corr = 0.5 + 0.3 = 0.8 m. After 250 days when load step 4 is completed, we have (t = 15 days)Ū2 = 0.13, which yields
s4,corr = 0.5 + 0.3 = 0.8 m. After 250 days when load step 4 is completed, we have (t = 15 days)Ū2 = 0.13, which yields ![]() s = 0.10 m and s = 0.75 m. Then 100, 200, and 400 days later we have Ū = 0.59, Ū = 0.74, and Ū = 0.89, from which
s = 0.10 m and s = 0.75 m. Then 100, 200, and 400 days later we have Ū = 0.59, Ū = 0.74, and Ū = 0.89, from which ![]() s = 0.47 (s = 0.47 + 0.65 = 1.12 m), 0.67 (s = 1.24 m), and 0.71 m (s = 1.36 m), respectively.
s = 0.47 (s = 0.47 + 0.65 = 1.12 m), 0.67 (s = 1.24 m), and 0.71 m (s = 1.36 m), respectively.
The theoretical course of settlement determined in the conventional way, Eq. (2.18), is less complicated in that the total consolidation curve can be determined for each load step separately and added to each other. Assuming ch = 0.93 m2/year we find, to give an example, 400 days after the start of the loading process (t1 = 385 days, Ū = 0.92; t2 = 340 days, Ū = 0.89; t3 = 260 days, Ū = 0.82; t4 = 170 days, Ū = 0.67) the settlement s = 0.92 · 0.15 + 0.89 · 0.6 + 0.82 · 0.2 + 0.67 · 0.5 = 1.17 m.
The results obtained by the two methods of analysis are shown in Fig. 2.20.
The values of Δˉh![]() applied in the different load steps agree quite well with observations of the excess pore water pressure (cf. Hansbo, 1997a and 1997b).
applied in the different load steps agree quite well with observations of the excess pore water pressure (cf. Hansbo, 1997a and 1997b).
Inserting the maximum value ˉh0v![]() = 4.6 m into Eq. (2.14) we find outside the zone of smear imax = 17.7, and inserting this into Eq. (2.16), the correlation between ch = 0.93 m2/year and λ = 0.37 m2/year correspond to il = 3.7.
= 4.6 m into Eq. (2.14) we find outside the zone of smear imax = 17.7, and inserting this into Eq. (2.16), the correlation between ch = 0.93 m2/year and λ = 0.37 m2/year correspond to il = 3.7.
Vagnhärad vacuum test
Torstensson (1984) reported an interesting full-scale test in which consolidation of the clay was achieved by the vacuum method. The subsoil at the test site consists of postglacial clay to a depth of 3 m and below this of varved glacial clay to a depth of 9 m underlain by silt. The clay is slightly overconsolidated with a preconsolidation pressure about 5–20 kPa higher than the effective overburden pressure. The coefficient of consolidation ch was found equal to 0.95 m2/year and the average virgin compression ratio CR equal to 0.7 (max. 1.0).
The vacuum area, 12 m square, was first covered by a sand/gravel layer 0.2 m in thickness, and then by a Baracuda membrane, which was buried to 1.5 m depth along the border of the test area and sealed by means of a mixture of bentonite and silt.
Mebradrains (dw = 0.066 m) were installed in a square pattern with 1.0 m spacing to a depth of 10 m. The equivalent diameter of the mandrel dm = 0.096 m. The average under-pressure achieved by the vacuum pump was 85 kPa. After 67 days, the vacuum process was stopped and then resumed after 6 months of rest. From the shape of the settlement curve (Fig. 2.21), Asaoka’s method yields the correlation si = 0.0756 + 0.9075si–1, from which sp = 0.82 m. This value is low with regard to the loading conditions and the compression characteristics. This is mainly because the applied vacuum effect is not fully achieved in the drains. Thus, the primary settlement of 0.82 m corresponds to a vacuum effect of about 35 kPa (![]() h = 3.5 m). Another reason may be that the test area is too small as compared to the thickness of the clay layer.
h = 3.5 m). Another reason may be that the test area is too small as compared to the thickness of the clay layer.
The theoretical settlement curve in this case has to be determined in two steps, the first one up to a loading time of 67 days leading to a then settlement s1=ˉUh1sp![]() . In the next load step, starting again from the time of resumption of the application of vacuum, the remaining primary settlement is obtained from the relation Δs=ˉUh(sp–s1)
. In the next load step, starting again from the time of resumption of the application of vacuum, the remaining primary settlement is obtained from the relation Δs=ˉUh(sp–s1)![]() , such that the remaining settlement equals st=s1+ˉUht(sp–s1)
, such that the remaining settlement equals st=s1+ˉUht(sp–s1)![]() where t starts from the time of resumption of the application of vacuum. In this case, where vacuum is applied to create underpressure in the drains, the effect of vertical one-dimensional consolidation is eliminated.
where t starts from the time of resumption of the application of vacuum. In this case, where vacuum is applied to create underpressure in the drains, the effect of vertical one-dimensional consolidation is eliminated.
Inserting the values D = 1.13 m, dw = 0.066 m, ds = 0.19 m, kh/ks=κh/κs=4![]() , and Δˉh
, and Δˉh![]() = 3.5 m into Eqs. (2.18) and (2.19), the best agreement between theory and observations is found for ch = 2.4 m2/year and λ = 0.95 m2/year (Fig. 2.21). Even in this case, the λ theory agrees better with observations than the classical theory.
= 3.5 m into Eqs. (2.18) and (2.19), the best agreement between theory and observations is found for ch = 2.4 m2/year and λ = 0.95 m2/year (Fig. 2.21). Even in this case, the λ theory agrees better with observations than the classical theory.
Inserting the maximum value Δˉh![]() = 3.5 m into Eq. (2.13) yields imax = 7.3, and inserting the values ch = 2.4 m2/year and imax = 7.3 into Eq. (2.15) yields λ = 1.1 m2/year. The value λ = 0.95 m2/year corresponds according to Eq. (2.15) to imax = 9.9. Assuming il = 5, the value of imax, derived from Eq. (2.16), becomes respectively 7.7 instead of 7.3 and 11.8 instead of 9.9.
= 3.5 m into Eq. (2.13) yields imax = 7.3, and inserting the values ch = 2.4 m2/year and imax = 7.3 into Eq. (2.15) yields λ = 1.1 m2/year. The value λ = 0.95 m2/year corresponds according to Eq. (2.15) to imax = 9.9. Assuming il = 5, the value of imax, derived from Eq. (2.16), becomes respectively 7.7 instead of 7.3 and 11.8 instead of 9.9.
Porto Tolle test site, Italy
The Porto Tolle experimental embankment had a crest width and length of 30 and 300 m, respectively, and a bottom width of 65 m. The load placed on the embankment was about 100 kN/m2. It was divided into four sections with different types of vertical drains. Here, two types of drains will be analyzed, namely one with band drains of type Geodrain and another with jetted sand drains, 0.3 m in diameter. The drains were placed in an equilateral triangular pattern, Geodrains with 3.8 m spacing and sand drains with 5.0 m spacing.
The soil consists of 7 m sand and silty sand underlain by about 20 m of soft, normally consolidated light-brown silty clay resting on dense, silty sand. The consolidation characteristics of the clay were determined by means of oedometer tests and field investigations. According to the oedometer tests, the coefficient of consolidation cv was found equal to 3–9 m2/year and the coefficient of consolidation ch equal to 6–16 m2/year. From the results of a trial embankment without vertical drains, cv was found equal to 9 m2/year. The virgin compression ratio CR was not given. The primary consolidation settlement of the section with Geodrains, shown in Fig. 2.22, estimated according to Asaoka’s method, yields si=0.249+0.756si–1![]() , corresponding to a total primary consolidation settlement of 1.0 m, while the settlement of the section with sand drains yields si=0.259+0.703si–1
, corresponding to a total primary consolidation settlement of 1.0 m, while the settlement of the section with sand drains yields si=0.259+0.703si–1![]() , corresponding to a total primary consolidation settlement of 0.9 m. The vertical stress increase in the middle of the clay layer due to the load of the embankment can be estimated as
, corresponding to a total primary consolidation settlement of 0.9 m. The vertical stress increase in the middle of the clay layer due to the load of the embankment can be estimated as ![]() σv = 100[(30 + 65)/2] /[17 + (30 + 65)/2] ≈ 74 kPa.
σv = 100[(30 + 65)/2] /[17 + (30 + 65)/2] ≈ 74 kPa.

The observations are compared with Eqs. (2.18) and (2.19) assuming that the primary consolidation settlement is in accordance with the preceding values, that is, equal to 1.0 m in the section provided with Geodrain and 0.9 m in the section provided with sand drains. Inserting the values D = 3.99 m, dw = 0.066 m, and ds = 0.19 m, kh/ks=κh/κs=2![]() for Geodrains, and D = 5.25 m, dw = 0.3 m, and ds = 0.4 m, kh/ks=κh/κs=2
for Geodrains, and D = 5.25 m, dw = 0.3 m, and ds = 0.4 m, kh/ks=κh/κs=2![]() for sand drains, and an initial hydraulic head Δˉh0
for sand drains, and an initial hydraulic head Δˉh0![]() = 7 m (assuming Δˉu0=γwΔˉh0=Δσ
= 7 m (assuming Δˉu0=γwΔˉh0=Δσ![]() ) into Eqs. (2.18) and (2.19), the best agreement between theory and observations is found for ch = 24 m2/year and λ = 14 m2/year with the exponent n = 1.5 (Fig. 2.22). In both cases the coefficient of consolidation cv is assumed equal to 9 m2/year.
) into Eqs. (2.18) and (2.19), the best agreement between theory and observations is found for ch = 24 m2/year and λ = 14 m2/year with the exponent n = 1.5 (Fig. 2.22). In both cases the coefficient of consolidation cv is assumed equal to 9 m2/year.
According to Eq. (2.18), the average degree of consolidation when the load step leading to full load is completed (consolidation time t = 3.4 months; full load during 1.7 months) ˉU=![]() 41% for Geodrains and 42% for sand drains. At t = 6, 9, and 12 months we find ˉU=
41% for Geodrains and 42% for sand drains. At t = 6, 9, and 12 months we find ˉU=![]() 68%, 85%, and 93%, respectively, for Geodrains, and ˉU=
68%, 85%, and 93%, respectively, for Geodrains, and ˉU=![]() 72%, 87%, and 94%, respectively, for sand drains. According to Eq. (2.19), the average degree of consolidation when the load step leading to full load is completed (consolidation time t = 3.4 months; full load during 1.7 months) ˉU=
72%, 87%, and 94%, respectively, for sand drains. According to Eq. (2.19), the average degree of consolidation when the load step leading to full load is completed (consolidation time t = 3.4 months; full load during 1.7 months) ˉU=![]() 51% for Geodrains and 47% for sand drains. At t = 6, 9, and 12 months we find ˉU=
51% for Geodrains and 47% for sand drains. At t = 6, 9, and 12 months we find ˉU=![]() 76%, 87%, and 92%, respectively, for Geodrains, and ˉU=
76%, 87%, and 92%, respectively, for Geodrains, and ˉU=![]() 73%, 85%, and 91%, respectively, for sand drains. Even in this case the λ theory agrees better with observations than the classical theory.
73%, 85%, and 91%, respectively, for sand drains. Even in this case the λ theory agrees better with observations than the classical theory.
Stockholm Arlanda project
Various types of soil improvement techniques have been used at Stockholm Arlanda Airport, among these, vertical drainage in combination with preloading along the runway/taxiway in an area of 250,000 m2 containing clay and organic deposits.
The requirements placed on the completed project allowed a maximum settlement of 30 mm. The design of the vertical drain project aimed at creating an effective preconsolidation pressure of at least 1.25 times the effective vertical pressure reached in the soil after completion of the project. This was done to eliminate the risk of too large creep settlement after the primary consolidation period (cf. test area III at Skå-Edeby, Fig. 2.15). The drain spacing and the preloading conditions were selected to achieve 95% primary consolidation within 12 months of loading. The Arlanda project is interesting from the point of view of the extreme loading conditions. Thus, to achieve the goal setup, preloading has been carried out by means of 14–20 m of fill. The load of the fill has caused a relative compression of 22–29%, corresponding to total settlements of 1.6–2.6 m.
According to the design requirements, the drains had to be installed in an equilateral triangular pattern with a drain spacing of 0.9 m. Furthermore, depending on the large relative compression to be expected, the drains had to be capable of undergoing a vertical compression in the order of 35% without losing their function. Prefabricated drains of type Mebradrain 88 were selected for the project. The installation of the drains was made by means of steel mandrel with the dimensions 60 × 120 mm.
The clay at one of the sites of observation presented here, site K, was medium to highly sensitive and normally consolidated with water content of mainly 60–90% and a liquid limit of 40–80% (the results at other points of observation and consequential analysis are presented by Eriksson et al., 2000). The undrained shear strength was fairly constant, mainly about 7–9 kPa, irrespective of depth. The groundwater level was situated just below the ground level. The results of the oedometer tests, interpreted in the way shown in (see Fig. 2.23), and the settlements derived accordingly are given in Table 2.7.

 .
.Table 2.7
Parameters used in the settlement analysis (see Fig. 2.23) at Stockholm Arlanda Airport
| Depth (m) | Mij (kPa) | Mj′ | σ′ij−σ′cj | Δhj (m) | Load (kN/m2) | Settlement (m) |
| 2 | 80 | 12.9 | 9 | 2.5 | 0–80 | 1.8 |
| 4 | 165 | 19.3 | 12 | 2.0 | 80–215 | 0.7 |
| 6 | 188 | 15.3 | 21 | 2.0 | 215–390 | 0.4 |
| 8 | 279 | 17.5 | 20 | 2.5 | 0–390 | 2.9 |
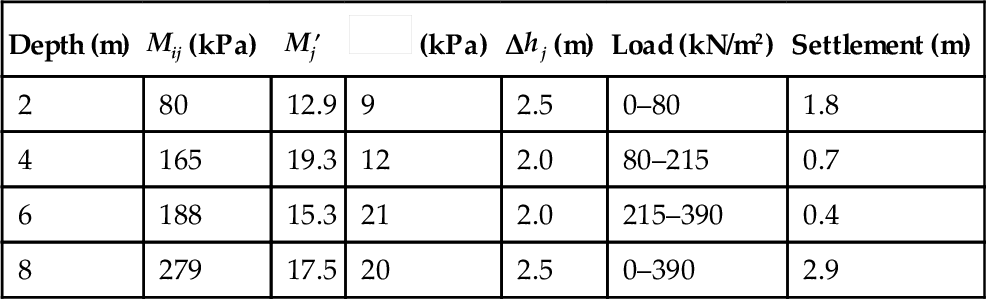
Note: ![]() hj = hydraulic head of excess pore water pressure.
hj = hydraulic head of excess pore water pressure.
The settlement values calculated from the oedometer test results were compared with those determined from the course of settlement shown in Fig. 2.24. Thus, according to Asaoka’s method, the primary consolidation settlement is obtained from the correlation si=0.590+0.775si–1![]() , which yields sp = 2.63 m. The discrepancy can be explained by the fact that the oedometer results given in Table 2.7 represent mean values of oedometer tests carried out on samples taken as far as 70–165 m away from the point of settlement observation. The settlements obtained in the various load steps were adjusted by multiplication by a factor obtained by dividing the final settlement values obtained by Asaoka’s method with the final settlement values evaluated based on the oedometer tests. The adjusted values are given in Table 2.8.
, which yields sp = 2.63 m. The discrepancy can be explained by the fact that the oedometer results given in Table 2.7 represent mean values of oedometer tests carried out on samples taken as far as 70–165 m away from the point of settlement observation. The settlements obtained in the various load steps were adjusted by multiplication by a factor obtained by dividing the final settlement values obtained by Asaoka’s method with the final settlement values evaluated based on the oedometer tests. The adjusted values are given in Table 2.8.

Table 2.8
Settlement values at Stockholm Arlanda Airport, adjusted according to Asaoka’s method
| Load step (kN/m2) | 0–80 | 80–215 | 215–390 | 0–390 |
| Settlement (m) | 1.63 | 0.64 | 0.36 | 2.63 |
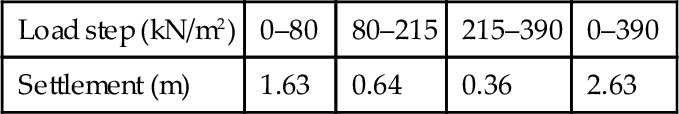
According to the oedometer tests, the coefficient of consolidation cv varies from about 0.2–0.3 m2/year at preconsolidation pressure to about 0.5–1.0 m2/year (maximum 2.5 m2/year) at the end of primary compression under the maximum load applied (390 kN/m2). The following assumptions are applied in the analysis: D = 1.05 × 0.9 = 0.945 m; dw = 0.066 m; ds = 0.19 m; kh/ks=κh/κs=ch/cv=3![]() ; l = 4.5 m; ch = 2.6 m2/year; and λ = 0.7 m2/year with the exponent n = 1.5.
; l = 4.5 m; ch = 2.6 m2/year; and λ = 0.7 m2/year with the exponent n = 1.5.
Inserting the consolidation time t1 = 1 month (the length of time that corresponds to full loading condition in load step 1), we find ˉU1=![]() 0.42 at the completion of load step 1, and, consequently, s = 0.42 × 1.63 = 0.69 m. At the completion of load step 2 (t1 = 2 months and t2 = 0 · 5 months) we find ˉU1=
0.42 at the completion of load step 1, and, consequently, s = 0.42 × 1.63 = 0.69 m. At the completion of load step 2 (t1 = 2 months and t2 = 0 · 5 months) we find ˉU1=![]() 0.65 and ˉU2=
0.65 and ˉU2=![]() 0.25, where s = 0.65 × 1.63 + 0.25 × 0.63 = 1.22 m. Finally, at the completion of load step 3 (t1 = 4.5 months, t2 = 3 months, and t3 = 1.25 month) we find ˉU1=
0.25, where s = 0.65 × 1.63 + 0.25 × 0.63 = 1.22 m. Finally, at the completion of load step 3 (t1 = 4.5 months, t2 = 3 months, and t3 = 1.25 month) we find ˉU1=![]() 0.90, ˉU2=
0.90, ˉU2=![]() 0.79, and ˉU3=
0.79, and ˉU3=![]() 0.49, that is, s = 0.90 × 1.63 + 0.79 × 0.63 + 0.49 × 0.36 = 2.15 m. Three months later we find ˉU1=
0.49, that is, s = 0.90 × 1.63 + 0.79 × 0.63 + 0.49 × 0.36 = 2.15 m. Three months later we find ˉU1=![]() 0.98, ˉU2=
0.98, ˉU2=![]() 0.95, and ˉU3=
0.95, and ˉU3=![]() 0.89, that is, s = 0.98 × 1.63 + 0.95 × 0.63 + 0.89 × 0.36 = 2.52 m. Another three months later we find ˉU1=
0.89, that is, s = 0.98 × 1.63 + 0.95 × 0.63 + 0.89 × 0.36 = 2.52 m. Another three months later we find ˉU1=![]() 0.995, ˉU2=
0.995, ˉU2=![]() 0.99, and ˉU3=
0.99, and ˉU3=![]() 0.98, that is, s = 2.60 m.
0.98, that is, s = 2.60 m.
The course of settlement in non-Darcian flow:
In this case, according to Eq. (2.19), the average piezometric head in each load step has a great influence on the rate of consolidation.
Assuming that the average excess pore water pressure is equal to the load placed on the ground, we have in load step 1 (where the time of full loading is 1 month) the hydraulic head Δˉh1![]() = 8 m, which yields ˉU1=
= 8 m, which yields ˉU1=![]() 0.46. This yields s = Δs1Ū1 = 0.46 × 1.63 = 0.76 m and a hydraulic head Δˉh2=(1–ˉU1)
0.46. This yields s = Δs1Ū1 = 0.46 × 1.63 = 0.76 m and a hydraulic head Δˉh2=(1–ˉU1)![]() × Δq1/γw + Δq2/γw = 0.54 × 8 + 13.5 = 17.8 m. At the completion of load step 2, inserting a time of consolidation of half a month (the time of full loading), we have ˉU2=
× Δq1/γw + Δq2/γw = 0.54 × 8 + 13.5 = 17.8 m. At the completion of load step 2, inserting a time of consolidation of half a month (the time of full loading), we have ˉU2=![]() 0.38, which yields the settlement s=Δs1ˉU1+ˉU2[Δs1+Δs2–Δs1ˉU1]
0.38, which yields the settlement s=Δs1ˉU1+ˉU2[Δs1+Δs2–Δs1ˉU1]![]() = 0.76 + 0.38(2.27 − 0.76) = 1.33 m. The hydraulic head now becomes Δˉh3
= 0.76 + 0.38(2.27 − 0.76) = 1.33 m. The hydraulic head now becomes Δˉh3![]() = 0.62 × 17.8 + 17.5 = 28.5 m. Finally, at the completion of load step 3, when the loading operation has been completed, we have (where the time of consolidation under full load is 1.25 month) ˉU3=
= 0.62 × 17.8 + 17.5 = 28.5 m. Finally, at the completion of load step 3, when the loading operation has been completed, we have (where the time of consolidation under full load is 1.25 month) ˉU3=![]() 0.70, which yields s = 1.33 + 0.70(2.63 − 1.33) = 2.24 m. Three months later we have ˉU3=
0.70, which yields s = 1.33 + 0.70(2.63 − 1.33) = 2.24 m. Three months later we have ˉU3=![]() 0.93, from which s = 2.45 m.
0.93, from which s = 2.45 m.
A comparison between analytical results and observations are made in Fig. 2.24.
The course of excess pore pressure dissipation:
In this case, the piezometers were placed inside concrete tubes with an outer diameter of 1 m before the installation of the drains. The existence of these tubes created an obstacle to keeping up the intended drain pattern. Thus, the distance from a piezometer to the nearest drain was estimated at 0.9 m. The average D value in the vicinity of a piezometer was estimated at 1.335 m instead of the normal value of 0.945 m.
The excess pore water pressure u caused by loading is analyzed by Skempton’s pore pressure equation u=B[σ3+A(σ1–σ3)]![]() . In our case the pore pressure coefficients can be assumed equal to B = 1 (water-saturated clay) and A = 1.2 (load increase very high in comparison with the preconsolidation pressure). According to the theory of elasticity, the principal stress increase becomes σ1=Δq
. In our case the pore pressure coefficients can be assumed equal to B = 1 (water-saturated clay) and A = 1.2 (load increase very high in comparison with the preconsolidation pressure). According to the theory of elasticity, the principal stress increase becomes σ1=Δq![]() and σ3=0.9Δq
and σ3=0.9Δq![]() . This yields u0 = 1.02
. This yields u0 = 1.02![]() q where the hydraulic head increase Δh0=u0/γw=0.104Δq
q where the hydraulic head increase Δh0=u0/γw=0.104Δq![]() .
.
Now, assuming that the piezometers are placed in the center between the drains we have ρ/D = 0.5. For Ūh = 0 and D = 1.335 m, we then have, according to Eq. (2.7), ![]() h = 1.06 × 0.104
h = 1.06 × 0.104![]() q = 0.11
q = 0.11![]() q. When dealing with the excess pore pressure dissipation, the excess pore pressure developed during the placement of each load step is assumed to correspond to the total load increase (no reduction of the pore pressure caused during the placement of the load step). This can be justified by the dynamic disturbance effects caused by the filling operation. Therefore, the time of consolidation is chosen with reference to the time when the filling operation in a load step is completed. The effect of the contribution by one-dimensional vertical consolidation on the excess pore pressure values is not taken into account.
q. When dealing with the excess pore pressure dissipation, the excess pore pressure developed during the placement of each load step is assumed to correspond to the total load increase (no reduction of the pore pressure caused during the placement of the load step). This can be justified by the dynamic disturbance effects caused by the filling operation. Therefore, the time of consolidation is chosen with reference to the time when the filling operation in a load step is completed. The effect of the contribution by one-dimensional vertical consolidation on the excess pore pressure values is not taken into account.
Assuming Darcian flow, the value of ![]() h during the course of consolidation can be found by Eqs. (2.7) and (2.5). Proceeding along the mentioned principle, taking into account only the effect of the drains (cv = 0), we find, at the completion of load step 1,
h during the course of consolidation can be found by Eqs. (2.7) and (2.5). Proceeding along the mentioned principle, taking into account only the effect of the drains (cv = 0), we find, at the completion of load step 1, ![]() h = 0.11 × 80 = 8.8 m. At the completion of load step 2 we have t1 = 1 month which yields Ūh1 = 0.19. Hence
h = 0.11 × 80 = 8.8 m. At the completion of load step 2 we have t1 = 1 month which yields Ūh1 = 0.19. Hence ![]() h = 0.81 × 8.8 + 0.11 × 135 = 22.0 m. Finally, at the completion of load step 3 we have t1 = 3.5 months and t2 = 2.5 months, from which Ūh1 = 0.53 and Ūh2 = 0.42; from this we obtain
h = 0.81 × 8.8 + 0.11 × 135 = 22.0 m. Finally, at the completion of load step 3 we have t1 = 3.5 months and t2 = 2.5 months, from which Ūh1 = 0.53 and Ūh2 = 0.42; from this we obtain ![]() h = 0.47 × 8.8 + 0.58 × 0.11 × 135 + 0.11 × 175 = 32.0 m. An easier way of finding the value of Δh, applied in the following, is to start the analysis only from the time when load step 2 is completed, which yields the same result:
h = 0.47 × 8.8 + 0.58 × 0.11 × 135 + 0.11 × 175 = 32.0 m. An easier way of finding the value of Δh, applied in the following, is to start the analysis only from the time when load step 2 is completed, which yields the same result: ![]() h = 0.58 × 22.0 + 0.11 × 175 = 32.0 m. Three months later we have Ūh3 = 0.48, where
h = 0.58 × 22.0 + 0.11 × 175 = 32.0 m. Three months later we have Ūh3 = 0.48, where ![]() h = 0.52 × 32.0 = 16.7 m, and another 3 months later, Ūh3 = 0.73, that is,
h = 0.52 × 32.0 = 16.7 m, and another 3 months later, Ūh3 = 0.73, that is, ![]() h = 8.7 m.
h = 8.7 m.
Assuming non-Darcian flow, we find, according to Eq. (2.9), for Ūh = 0 and ρ/D = 0.5 the value of ![]() h = 1.11 × 0.104
h = 1.11 × 0.104![]() q = 0.115
q = 0.115![]() h0. At the completion of load step 1 we now have
h0. At the completion of load step 1 we now have ![]() h = 0.115 × 80 = 9.2 m. At the completion of load step 2 we have, according to Eq. (2.6), Ūh1 = 0.24, where
h = 0.115 × 80 = 9.2 m. At the completion of load step 2 we have, according to Eq. (2.6), Ūh1 = 0.24, where ![]() h = 0.76 × 9.2 + 0.115 × 135 = 22.5 m. At the completion of load step 3 we have Ūh2 = 0.59, from which
h = 0.76 × 9.2 + 0.115 × 135 = 22.5 m. At the completion of load step 3 we have Ūh2 = 0.59, from which ![]() h = 0.41 × 22.5 + 0.115 × 175 = 29.4 m. Three months later we have Ūh3 = 0.68, where
h = 0.41 × 22.5 + 0.115 × 175 = 29.4 m. Three months later we have Ūh3 = 0.68, where ![]() h = 0.32 × 29.4 = 9.4 m, and another 3 months later, Ūh3 = 0.84, that is,
h = 0.32 × 29.4 = 9.4 m, and another 3 months later, Ūh3 = 0.84, that is, ![]() h = 4.6 m.
h = 4.6 m.
The results of the analysis are compared with the results of pore pressure observations in Fig. 2.25. In reality, the observational results were obtained through measurements where the horizontal distance between the piezometers and the nearest drain was 0.8 m (ρ = D/2 = 0.8). The values of ρ and D, however, chosen in the analysis, are based on the average drain spacing nearest to the piezometers.
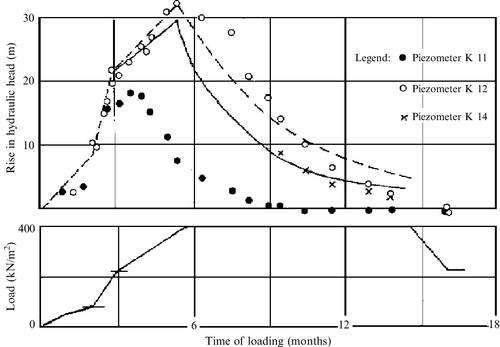
2.4 Conclusion
The choice of consolidation parameters is mostly based on the results of conventional oedometer tests representing one-dimensional consolidation with pore water escape in the vertical direction. The coefficient of consolidation in the case of pore water escape in the horizontal direction is usually determined by means of piezocone tests. The results thus obtained have to be checked by a follow-up of the consolidation process, preferably by careful instrumentation of a test area or of the project itself. In the case of vertical drainage, the choice of the consolidation parameters will depend on the assumptions connected with the diameter of the zone of smear and the ratio of permeability coefficients in natural soil and in the zone of smear. For example, if the ratios κh/κs and kh/ks in the Örebro test areas are chosen equal to 2 instead of 4, the coefficient of consolidation λ, giving equally good agreement with the test results mentioned previously, will be 0.31 m2/year instead of 0.58 m2/year. The coefficient of consolidation ch will be 0.70 m2/year instead of 1.15 m2/year. This example indicates the importance of a follow-up of the consolidation process to check the choice of consolidation parameters. Monitoring should include both settlement and pore pressure observations. From the results obtained at an early stage of the consolidation process, the consolidation parameters can be estimated and the continuation of the consolidation process predicted with acceptable accuracy.
From the results of the analysis of the consolidation process, shown in Figs. 2.24 and 2.25, we find a slightly better agreement between the observations and the analysis based on validity of Darcy’s flow law than the analysis based on exponential flow. This can be explained by the fact that the prevailing hydraulic gradients in this case are very high and in excess of the limiting hydraulic gradient il in exponential flow almost during the whole consolidation process. In this case, the maximum hydraulic gradient during the consolidation process is equal to 77 while the adapted values of λ and ch used in the analysis correspond to a limiting hydraulic gradient il equal to 7.
Because the degree of consolidation obtained after a certain time of loading is generally controlled by settlement and pore pressure observations, it is interesting to study the variation of excess pore pressure at various distances from the drains.
The degree of consolidation based on excess pore pressure observations is equal to (Δˉh0−Δh)/Δˉh0![]() . The result obtained in two cases with different drain spacing is shown in Fig. 2.26.
. The result obtained in two cases with different drain spacing is shown in Fig. 2.26.
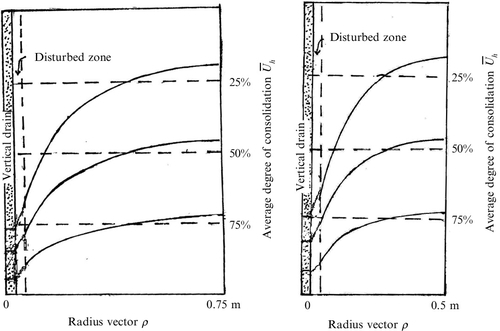
 = 4 m (ū0 ≈ 40 kPa), kh = 0.03 m/year, ks = 0.015 m/year.
2.5 Notations
a = thickness of prefabricated band-shaped drain
b = width of prefabricated band-shaped drain
ch = coefficient of consolidation valid for vertical drainage (Darcian flow)
cv = coefficient of consolidation valid for one-dimensional consolidation (Darcian flow)
Cc = compression index
CR = compression ratio = Cc/(1+e0)=ɛ2/log2![]()
D = diameter of soil cylinder dewatered by a drain
dw = drain diameter
ds = diameter of zone of smear
e = void ratio
h = hydraulic head
i = hydraulic gradient
k = coefficient of permeability (Darcian flow)
ks = coefficient of permeability in the zone of smear (Darcian flow)
kh = coefficient of permeability in horizontal pore water flow
kw = coefficient of permeability of the drain
l = length of partially penetrating drain (half length of penetrating drain)
M = compression modulus determined by oedometer tests
n = exponent of hydraulic gradient in exponential flow correlation
qw = discharge capacity of drain at an inner hydraulic gradient equal to one
t = consolidation time
u = excess pore water pressure
z = depth coordinate
ɛ = relative compression
ɛ2 = relative compression along the virgin curve caused by doubling the load
γw = unit weight of water
γ′=γsat–γw![]() = effective unit weight of soil (γsat = unit weight of water saturated soil)
= effective unit weight of soil (γsat = unit weight of water saturated soil)
κ = coefficient of permeability (exponential flow)
κh = coefficient of permeability in horizontal pore water flow (exponential flow)
κs = coefficient of permeability in the zone of smear (exponential flow)
λ = coefficient of consolidation (exponential flow)
ρ = radius vector
σ = total stress
σ′ = effective stress