Two Case Histories of Vertical Drains in Very Soft Clays
Marcio Souza Soares de Almeida1; Maria Esther Soares Marques2; Alexandre Pereira Spotti3 1 Professor, Graduate School of Engineering, Federal University of Rio de Janeiro, Brazil
2 Professor, Military Institute of Engineering, Rio de Janeiro, Brazil
3 Professor, Federal Institute of Education, Science and Technology of Rio Grande do Norte, Brazil
Abstract
The case histories presented in this paper are related to embankments built on Sarapuí and Barra da Tijuca clays, which are both very soft, organic clays in the Rio de Janeiro area of Brazil. Vertical drains have been the most widely used technique for soil improvement in Brazil for some time and was used in both sites. Both clays have been well studied and a summary of the geotechnical properties of Sarapuí clay (Almeida and Marques, 2002) and Barra da Tijuca clay (Almeida, 1998) are presented.
The Sarapuí test embankment (Almeida and Ferreira, 1992) consisted of five test sections built with the purpose of comparing the performance of five types of vertical drains. Three types of sand drains and two types of prefabricated drains were used. All drains were spaced in a square pattern. The other case history (Almeida et al., 2000) consisted of an embankment built on the highly compressible organic clay of Barra da Tijuca, where water content varies from 500% near the surface to 100% at the base of the clay deposit. A prefabricated drain was used.
All embankments were instrumented for monitoring of both settlements and pore pressure and the results of these measurements are shown. For both sites, emphasis is given to values of the coefficient of consolidation (cv) back-calculated from field measurements, which are compared with cv values from lab and in situ tests.
At Barra da Tijuca site two stages of construction were initially planned. However, due to nontechnical reasons, the second stage was not constructed.
5.1 Introduction
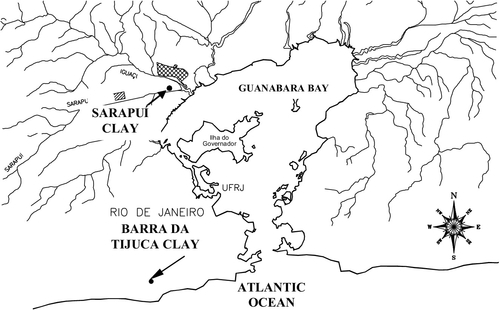
The localities of the two clay deposits are shown in Fig. 5.1. These clays have been well studied and a summary of the geotechnical properties of each deposit is presented in this chapter.
The Sarapuí test embankment consisted of five test sections built to compare the performance of five types of vertical drains. Three sand drains were evaluated—open mandrel, closed mandrel, and jetted—all with 400 mm diameter and spaced 2.5 m. Also, two prefabricated drains were used, polyetilene PVD drain (2.8 mm × 100 mm) spaced 1.7 m and polyester drain (4.5 mm × 210 mm) spaced 2.0 m. All drains were spaced in a square pattern.
The other case history consisted of an embankment built on the highly compressible organic clay of Barra da Tijuca, where water content varies from 500% near the surface to 100% at the base of the clay deposit. In this case history, a prefabricated vertical drain was spaced 1.7 m in a triangular grid.
All embankments were instrumented for settlements and pore pressure monitoring and some of these measurements will be described in this chapter. For both sites, the values of the coefficient of consolidation (cv) were back-calculated from field measurements, which were then compared with cv from laboratory and in situ tests. In both analyses, the smear was taken into account, following the equations proposed by Hansbo et al. (1981). It was necessary to consider the hydraulic resistance of the drains, owing to drain lengths used in these sites: 9 m at Sarapuí and 12 m at Barra da Tijuca.
5.2 Sarapuí trial embankment II
A comprehensive study on the behavior of the very soft clay at Sarapuí was carried out from 1970–1990, reported in detail by Almeida and Marques (2002). An important part of this study was the trial embankment II, built over vertical drains. This embankment was monitored for about a decade (1981–1990). Three sections with sand drains, two sections with prefabricated drains, and two sections without drains were monitored with settlements plates, magnetic settlements gauges, inclinometers, and Casagrande and hydraulic piezometers. A complete analysis of the behavior of this embankment was reported by Almeida and Ferreira (1992), and the main topics are summarized here. Emphasis is given to values of coefficients of horizontal consolidation (ch) obtained by back-analyses of field data, which are compared with ch obtained by laboratory and in situ tests.
5.2.1 Sarapuí clay site
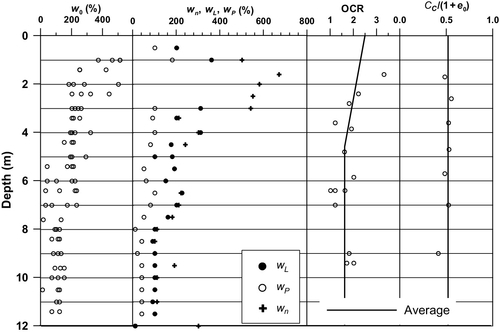
Figure 5.2 shows the geotechnical profile of Sarapuí clay based on geotechnical investigation carried out near the trial embankments sites. An 11-m-thick, very soft clay layer, overlying a fine-to-coarse sand layer comprises the geotechnical profile. The liquid limit (wL), plastic limit (wP), measured without oven drying, and natural water content (wn) profiles are also presented. Sarapuí clay water content is slightly higher than liquid limit, and the sensitivity of this clay is 4.4.
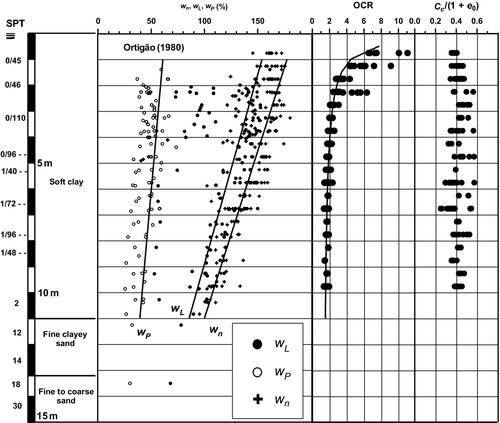
Sarapuí clay is lightly overconsolidated due to aging and water-table fluctuation. The initial voids ratio (e0) decreases with depth from 4.9 to 2.46 and natural unit weight (γn) varies from 12.5 to 14.5 kN/m3. Below the crust, the overconsolidation ratio (OCR) of the clayey deposit varies from 2.0 to 1.3. Sarapuí clay is a very compressible soil; Cc (compression index) varies from 1.3 to 3.2. It has an average Cc/(1 + e0) relationship of 0.41, as shown in Fig. 5.2.
Conventional and special oedometer tests were carried out to obtain coefficient of horizontal consolidation (ch) values. Tests included inflow and outflow types of radial drainage tests, which are vertical drainage tests on samples at 90° with the horizontal plane (Lacerda et al., 1977, 1995). The representative value of ch obtained at a normally consolidated range was 2.4 × 10- 8 m2/s and it was found that the ch/cv relationship lies between 1.0 and 2.0, which is typical for very soft clays.
5.2.2 Trial embankment II
Embankment II was built 35 m wide and 315 m long and divided in seven instrumented subareas, where different kinds of drains were installed, as described in Table 5.1. Sections A and G, without drains, are not analyzed here.
Table 5.1
Characteristics of subareas—embankment II
| Section | Clay thickness (m) | Final H (m) | Vertical drain type | Installation type | Dimensions (mm) | Drain Distance (m) |
| A | 10.5 | 1.8 | None | |||
| B | 10.5 | 3.5 | Close-ended mandrel/sand | Displacement | dw = 400 | 2.5 |
| C | 10.5 | 3.5 | Open-ended mandrel/sand | Low displacement | dw = 400 | 2.5 |
| D | 10.5 | 3.8 | Jetted/sand | Non displacement | dw = 400 | 2.5 |
| E | 10.2 | 3.6 | Prefabricated (polyetilene) | Low displacement | 2.8 × 100 | 1.7 |
| F | 10.0 | 3.6 | Prefabricated (polyester) | Low displacement | 4.5 × 210 | 2.0 |
| G | 9.0 | 3.6 | None |

Source: Almeida and Ferreira (1992).
Loading was applied in two main stages and the final height was about h = 3.6 m. The first stage of loading was applied during 1981, in two steps. The first step (h = 0.7 m) occurred over a month and the second, 200 days after, lasted approximately 2.5 months (h = 2.0 m). The second stage, in 1986, was applied only from section B to G, in one week, until final height occurred after approximately 3300 days of monitoring. Data records of the central settlement plates are shown in Fig. 5.3.

The lowest ch value was obtained at a closed mandrel section, as expected, however, the monitoring of settlement plates showed that although sand-jetted drains presented initially high strain rates, the rate dropped with time and, in general, the strain rates of prefabricated drain sections were higher than those of the sand drains sections.
5.2.3 Coefficients of consolidation
The analysis presented here concentrates on the second loading stage, for which the clay layer was on a normally consolidated condition (Almeida and Ferreira, 1992).
Geometric data used in the consolidation solutions are given in Table 5.2. The main parameters used for the analysis of radial drainage are:
Table 5.2
ch and cv data, second stage of loading
| Test or data | Depth (m) | Method | Reference | ch (10- 8 m2/s) |
| Radial oedometer tests | 5.6 | Taylor's method | Coutinho (1976) | 2.4 |
| Piezocone | 2.2–8.2 | Houlsby and Teh, 1988 | Danziger (1990) | 3.1-8.7 |
| Magnetic settlement gages | Whole layer | Asaoka, 1978 | Almeida et al. (1989) | 4.2 -8.1 |
| Piezometers | 3.3–8.3 | Orleach, 1983 | Ferreira (1991) | 1.2-2.8 |
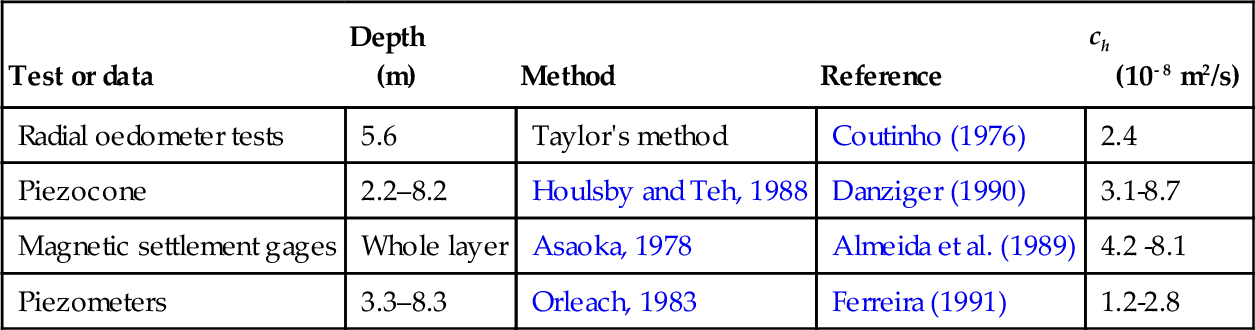
Source: Adapted from Almeida and Ferreira (1992); Almeida and Marques (2002).
• dw = diameter of the drain in the case of sand drains and equivalent diameter of the drain in the case of prefabricated drains
• ds = diameter of the smeared zone and s = ds/dw
• kh = horizontal coefficient of permeability of the undisturbed soil
• k′h = horizontal coefficient of permeability in the smeared zone
The ratio s = ds/dw used for the analysis of radial drainage was based on literature recommendations (Hansbo et al., 1981; Jamiolkowski et al., 1983, 1985; Holtz et al., 1987; Hansbo, 1987). Values adopted were s = 2 for displacement type sand drains, s = 1 for jetted sand drains (also known as low displacement drains), and s = 1.5 for prefabricated drains. The ratio kh/k′h = 3, also used for the analysis of radial drainage, was based on the experimental data available for the Sarapuí clay. Further details about the parameters adopted in the analyses can be obtained in Almeida and Ferreira (1992).
Table 5.2 shows the average coefficient of vertical and horizontal consolidation obtained from laboratory tests, in situ tests, and back-calculated from settlement data using the Asaoka (1978) method.
Calculations of ch presented in this section assumed just radial drainage, as preliminary calculations of combined drainage resulted in a ch that was 10% smaller than when it was not considered.
The analysis of ch values in Table 5.2 shows that the ch values are fairly close. The smallest values are those from the laboratory ch (lab) and pore pressure data ch (u), and the greatest values are those from settlement data ch (s) and piezocone data ch (piez). The ratio ch (s)/ch (lab) is around 2.5, which is expected and usually attributed to the macrostructure of the deposit (e.g., small lenses and draining layers). In the present case, the top crust, however, is the stiffer and more permeable layer.
Comparison between ch (s) and ch (u) indicates that the former is about three times higher than the latter. The nonlinearity between effective stress and void ratios appears to be the reason for this discrepancy (Almeida and Ferreira, 1992). Comparison between ch (lab) and ch (piez) shows that laboratory value is smaller than the field value from piezocone for normally consolidated (nc) conditions. The data suggest that secondary consolidation had negligible influence on ch (s) computations. However the influence of the secondary consolidation on the coefficient of vertical consolidation cv was found to be quite substantial (Almeida and Ferreira, 1992).
5.3 Barra da Tijuca embankment
This section summarizes data presented by Almeida et al. (2000) related to the performance of an embankment built over an area of 92,000 m2 over the very soft compressible clay of Barra da Tijuca (Almeida, 1998), in which prefabricated vertical drains have been installed. Coefficients of horizontal consolidation obtained from the analysis of field settlements are compared to the values obtained from the piezocone test and a laboratory special oedometer test. The increase in clay strength associated with the installation of the prefabricated vertical drain is evaluated by comparing the results of vane tests performed before and after the clay consolidation.
5.3.1 Site description
The site under study consists of very soft fluvial–marine gray clay with a top layer of peat. Figure 5.4 shows data of water content and Atterberg limits. It is observed that water content decreases from around 500% close to the ground level to around 100% at the bottom of the clay deposit. The maximum thickness of the compressible soil is 12 m. A sandy soil of alluvial origin is found under the compressible soil, under which is the residual soil. Figure 5.4 also shows the variation in OCR and CR = Cc/(1 + e0) with the depth. The average value of the overconsolidation ratio (OCR) is 1.5 below 2.0 m depth and the average compression ratio (CR) of the clay deposit is 0.52. A detailed discussion on the properties of this deposit was presented by Almeida (1998).
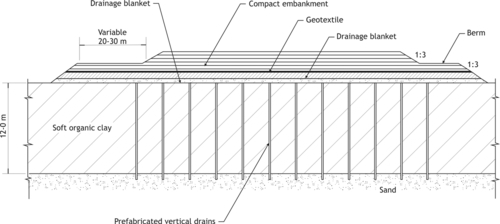
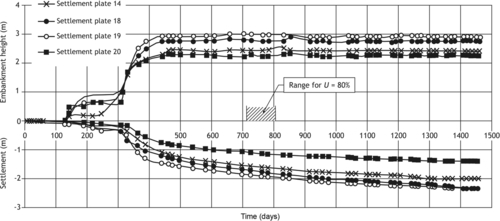
Settlements were measured by using 20 settlement plates installed before the embankment was built. Figure 5.5 shows the typical cross section of the completed embankment. The 0.60-m-thick drainage blanket provided support for the equipment used to install a prefabricated vertical drain with dimensions 0.1 m × 0.3 m, the equivalent drain diameter dw = 6.6 cm in a 1.70 m triangular grid. Figure 5.6 shows settlement–time curves obtained from settlement plates. The embankment thickness has also been recorded for each settlement measured, as shown in Fig. 5.6. The last construction stage should have been performed when the embankment achieved 80% consolidation, but a delay occurred due to nontechnical issues.
Pore pressure observations showed that the drainage blanket and the underlying soil acted as drainage interfaces, thus vertical and radial consolidation were considered when analyzing settlement data to obtain coefficients of horizontal consolidation.
5.3.2 Coefficients of consolidation
Coefficients of consolidation at each settlement plate for the period up to 720 days were obtained using the Asaoka (1978) method modified by Magnan and Deroy (1980) for combined radial and vertical drainage, for which a ratio ch/cv = 1.5 was assumed, following local experience. Other parameters used were s = ds/dw = 1.5 and kh/k′h = 2. Values of ch calculated up to 720 days for the 17 plates ranged from 3.7 to 10.3 × 10- 8 m2/s and the average value was 6.8 × 10- 8 m2/s. The majority of U values computed for this period were found to be close to 90% (Almeida et al., 2000).
The results of the coefficients of horizontal consolidation obtained from settlement data are compared here with those obtained from piezocone dissipation tests. The Houlsby and Teh (1988) method was used to obtain the ch (nc) values for the normally consolidated band, from the piezocone tests, using the soil rigidity rate Ir = 93 obtained by Oliveira (1997) and the ratio Cs/Cc = 0.10. The results of ch, obtained for 4 boreholes and 10 different depths was between 2.4 and 13.7 × 10- 8 m2/s (Almeida et al., 2000). Special radial drainage oedometer tests (Coelho, 1997; Almeida et al., 2000) have also been computed. Figure 5.7 and Table 5.3 show a good agreement between ch values obtained from the settlement analysis with the dissipation tests using the piezocone.

Table 5.3
Summary of ch values of Barra da Tijuca clay
| Method | Range of ch variation (10- 8 m2/s) | ch (average) (10- 8 m2/s) |
| Asaoka | 3.7–10.5 | 6.8 |
| Piezocone | 2.4–13.7 | 8.2 |
| Special radial oedometer tests | 3.6–6.8 | 5.0 |
Source: Almeida et al. (2000).
5.3.3 Shear strength
Two vane test campaigns were performed in the soft clay, the first in early 1996 before building the embankment and the second at the end of November 1997. Two verticals were carried out in each test campaign and all were performed (Nascimento, 1998) using the same electric vane equipment and at the same location of the site. The results of both campaigns are shown in Fig. 5.8.

To compare results from both vane test campaigns, taking into account the settlements that have occurred and the differences in depth in both test programs, the depth data was normalized with reference to the thickness of the layer at the time of the tests, thus the Su data were reduced to the same normalized depths. Values of average undrained resistance Su were computed for each normalized depth for the two test programs, which permit the calculation of the increased resistance ΔSu given in Table 5.4.
Table 5.4
Analysis of the gain in strength
| Normalized depth (m) | ΔSu (kPa) | ΔSu/Δσ′v |
| 0.35 | 6.50 | 0.25 |
| 0.40 | 8.85 | 0.34 |
| 0.45 | 12.25 | 0.47 |
| 0.50 | 11.86 | 0.46 |
| 0.55 | 8.32 | 0.32 |
| 0.60 | 1.65 | 0.06 |
| 0.65 | 1.44 | 0.05 |
| 0.70 | 1.39 | 0.05 |
| 0.75 | 4.26 | 0.17 |
In the design of embankments built in stages, it is common to compute the increased strength ΔSu as a result of the increase in effective stress Δσ′v. A conservative value ΔSu/Δσ′v = 0.22 may be adopted for the normalized increase in resistance. The ΔSu/Δσ′v values obtained for the present case are shown in Table 5.4. The computed value of Δσ′v took into account the embankment submersion due to the settlement (measured nearby the vane tests) and also the degree of consolidation U = 90% estimated at the time when the vane test was carried out (Almeida et al., 2000). More than half the top part of the clay layer, with higher initial water content, presented ΔSu/Δσ′v above 0.22. However, extremely low ΔSu/Δσ′v values were obtained for the bottom half of the clay layer, with small water content. However, the average gain in strength of the whole clay layer is close to ΔSu/Δσ′v = 0.22. Therefore, the vertical drains have contributed to the improvement in the clay layer by increasing its resistance, although the magnitude of this increase has varied along the clay layer.
5.4 Conclusion
5.4.1 Sarapuí
A test embankment has been constructed on well-studied Sarapuí soft clay site in which the rate of consolidation was accelerated using different types of vertical drains. Field observations have been made for about 10 years, and settlement and pore pressure data were back-analyzed and coefficients of horizontal consolidation calculated considering smear effects. Back-calculated ch values from settlement and pore pressure data have shown a reasonable agreement with laboratory and in situ values.
Since vertical drains accelerate primary compression, the influence of secondary consolidation appears to be smaller on back-calculated ch than on back-calculated cv (Almeida and Ferreira, 1992).
It was observed that strain rates of prefabricated drain sections were higher than those of sand drain sections.
5.4.2 Barra da Tijuca
A settlement study was performed on the behavior of Barra da Tijuca very soft clay with prefabricated vertical drains. The settlements covered a period of up to two years, when the average degree of consolidation reached around 90%.
The coefficient of horizontal consolidation ch obtained from settlement plates took into account the smear in the radial consolidation from the drain installation, as well as the vertical consolidation in parallel to the radial consolidation. Values of ch were measured in special oedometer tests with drains installed in the sample, and in dissipation tests using the piezocone to compare with field values. The three sets of values were found to be quite close, with little dispersion of the laboratory values, followed by the field readings and lastly the piezocone data. The generally good agreement obtained suggests that during the period of analysis, the secondary consolidation was negligible compared to the primary consolidation.
The increase in clay resistance, assessed by the vane tests performed before and after the construction of the embankment, showed a higher gain in Su for the top half of the clay layer with high water content and, oddly enough, a negligible gain for the bottom half of the clay layer with less water content.