High Pressure for Vacuum Consolidation Method Using Air-Water Separation System
Nipon Teerachaikulpanich1; Toshiaki Kosaka2 1 Thai Maruyama Industry Co., Ltd., Bangkok, Thailand
2 Geotechnical Engineering Department, Dia Consultants, Sendai, Japan
Abstract
Ground improvement by the vacuum consolidation method has been used widely over last decade. The original system, proposed by Kjellman Swedish engineer in 1952, was a prototype for further development in many parts of the world. The vacuum consolidation method was intensively developed from 1988 ~ 1992. Between 1990 and 2000, the system could produce a vacuum pressure at the pump and under an airtight sheet of around 80 kPa and 60 kPa, respectively. However, over time it was found that the vacuum pressure measured under an airtight sheet was gradually decreasing with time during vacuum operation, resulting in additional cost and time of construction. Therefore, the problem had to be analyzed and a resolution developed. A theoretical solution was proposed together with a practical solution known as the air-water separation system, which could be equipped with a conventional vacuum consolidation method. This chapter presents the case histories of the ground improvement by vacuum consolidation method in Japan using both a conventional system as well as an air-water separation system. A special case history with an air-water separation system is also presented, where a large consolidation settlement of approximately 10 m took place. This is a good case study for verifying the effectiveness of the air-water separation concept as well as the performance of a vacuum consolidation system. Consequently, it was found that the air-water separation system could resolve the problem of vacuum pressure decreasing inside the improved area during consolidation settlement. The high vacuum pressure measured under the airtight sheet could be produced and maintained over 80 kPa. Furthermore, the soil investigation after ground improvement confirmed the effectiveness of vacuum consolidation with an air-water separation system as a surcharge preloading method.
Acknowledgment
The authors would like to express their deepest gratitude to Mr. Kazuyoshi Nakakuma, who dedicated the rest of his life, with his colleagues, to developing vacuum consolidation with an air-water separation system. His financial support was not only spent on system development but also on field experiments and intensive soil investigations designed to obtain data and knowledge on soil mechanics related to the vacuum consolidation method over the last two decades.
10.1 Introduction
For soft ground improvement, such as peat, organic clay, and marine clay, the vacuum consolidation method, or so-called vacuum preloading, is a powerful method to accelerate consolidation progress. It can be used as a surcharge load as well as for enhancing overall ground stability during construction.
Kjellman (1952) was the first person to introduce this method. The basic components are vertical drains, a filter drainage layer, an airtight sheet, and a vacuum pump. By means of a vacuum pump, the depressurized atmospheric pressure inside the improved area is created and distributed through the vertical drains installed in the soft ground. An airtight sheet acts as the barrier to separate the atmospheric pressure inside and outside the improved area. The difference of atmospheric pressure is a loading force to consolidate the soft soil.
Based on the original concept of Kjellman, the vacuum consolidation method began being used in Japan around 1960. Further development occurred between 1988 and 1992 to enhance the performance of this method. Attention was given to the construction materials: vertical drains, airtight sheet, drainage system, and vacuum pump.
The vacuum pressure is paramount in the vacuum consolidation method. The location of vacuum pressure should be performed at two locations, the vacuum pump and under the airtight sheet. This is because the vacuum pressure measured at the pump will be always higher than inside the improved area, and the vacuum pressure under the airtight sheet will normally be lower due to system leakage. The quality of ground improvement work can be assured by carefully checking and maintaining the vacuum pressure under the airtight sheet.
Vacuum pressure measured under the airtight sheet will be around 60-80 kPa at the beginning of vacuum operation basically assumed as a design load. However, it was found that the vacuum pressure measured under the airtight sheet was gradually decreasing during the consolidation progress while the vacuum pressure measured at the pump was being relatively constant in practice. As the result, the design load was insufficient considered as the problem of this method.
This chapter presents case histories of ground improvement projects that use the vacuum consolidation method in Japan. It examines the cause of the vacuum pressure decrease and the concept of an air-water separation system. An analysis of ground improvement performance of the vacuum consolidation method with an air-water separation system is also presented.
10.2 Loss of vacuum pressure
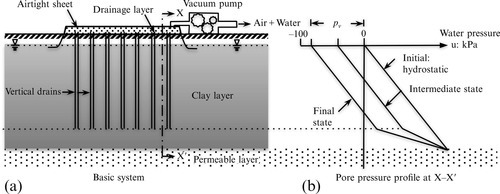
A schematic of the vacuum consolidation method developed in Japan is shown Fig. 10.1. The system is based on the original system proposed by Kjellman (1952). According to field-observed data obtained from several projects in Japan, it was found that the vacuum pressure measured under an airtight sheet was gradually decreasing during consolidation settlement. Two construction sites at different locations in Japan between 2000 and 2003 were selected as case histories (Teerachaikulpanich et al., 2013).

10.2.1 Kushiro case history
The Kushiro site was located in Hokkaido, Japan where National Highway 38 was constructed over the soft ground area.
Ground condition
The soft ground in this area consists of peat soil (6–7 m thick) where natural water content, wn = 300– 800% and unit weight, γt = 10–11 kN/m3 overlaid on a sand layer of 5–6 m thick and soft clay of 14–15 m thick. Natural water content, wn = 70–100% and unit weight, γt = 14–16 kN/m3.
Construction condition
The size of the vacuum consolidation area was 45 m × 30 m. Vertical drains were installed up to 26 m deep in a square grid pattern at intervals of 0.8 m × 0.8 m. A highway embankment of about 6.1 m high was constructed at a rate of 14.1 cm/day.
Field monitoring data
Figure 10.2(a) shows the field monitoring data. The vacuum pressure measured at the pump was about 85–92 kPa during the vacuum operation. The vacuum pressures measured under the airtight sheet were low at the beginning of operation and gradually increased to 50–60 kPa prior to the start of embankment operation, as shown in Fig. 10.2(c). The consolidation settlement induced by vacuum pressure and embankment load was about 241 cm.
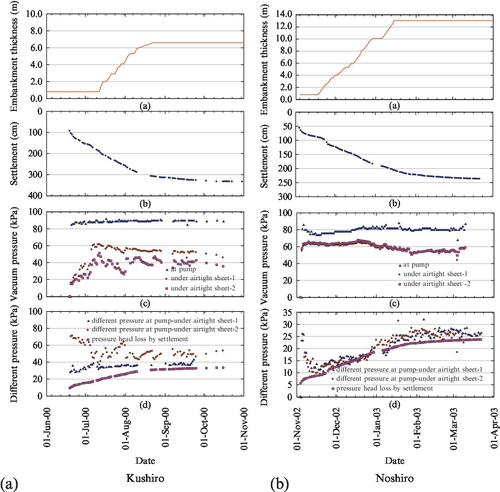
It was found that decreasing the vacuum pressure somehow correlates with the quantity of ground settlement. Figure 10.2(d) shows the vacuum pressure difference between at the pump and under the airtight sheet. The change of pressure in the elevation head calculated by settlement data was plotted as a comparison in Fig. 10.2(d). It can be seen that the amount of vacuum pressure difference between at the pump and under the airtight sheet was larger than the amount of pressure change due to elevation head loss. This is probably due to some leakage of vacuum pressure through the intermediate sand layer.
10.2.2 Noshiro case history
The Noshiro site was located in Akita, Japan. The project was a highway bypass construction over the soft ground area.
Ground condition
The soft ground in this area consists of peat soil (− 4 m thick) where the average natural water content, wn = 600% and unit weight, γt = 10–11 kN/m3, followed by soft clay (3–6 m thick) where the average natural water content, wn = 85% and unit weight, γt = 15 kN/m3.
Construction condition
The size of the vacuum consolidation area was 60 m × 60 m. Embankment thickness was about 13.0 m high and was constructed at a rate of 21 cm/day.
Field monitoring data
Figure 10.2(b) shows the field monitoring data of Noshiro. The vacuum pressure measured at the pump was about 68–88 kPa during the vacuum operation. The average vacuum pressure measured under the airtight sheets was about 60 kPa at the beginning of operation. The vacuum pressure at the pump slightly decreased during embankment backfill up to 6 m and then gradually returned to more than 80 kPa. The consolidation induced by the vacuum pressure and embankment load was about 237 cm. Figures 10.2 (b) and (d) show the vacuum pressure difference between at the pump and under the airtight sheet and elevation head loss by the consolidation settlement. It can be clearly seen that the vacuum pressure differences and elevation head loss were closer than in the Kushiro case. It could be that the loss of vacuum pressure at this site was lower than the previous one because there was no intermediated sand layer.
According to selected case histories where the conventional vacuum consolidation system was applied in Japan at different locations and under different ground conditions. It can be seen that the decreasing of vacuum pressure is caused by elevation head difference during the consolidation settlement under the vacuum consolidation systems shown in Fig. 10.1. The loss of vacuum pressure means the loss of applied load. This problem affects the quality of the ground improvement. The common solution is to put additional surcharge loading on the improved area, however, this results in an increase in construction cost and time.
10.3 Air-water separation concept
Based on the previous problem, the concept of vacuum consolidation was revised and analyzed. Figure 10.3 shows the basic pore pressure profile during the depressurization of atmospheric pressure in the vacuum consolidation system. Imai (2005) described the use of a vacuum pump and its limitations based on hydraulic fluid. Figure 10.4(a) shows a simple schematic of a vacuum pump being used to lift up water, and Fig. 10.4(b) shows the corresponding pressure diagram, where Pa and Pv are atmospheric pressure and vacuum pressure, respectively. At points A and D, the pressure is assumed to be equal to atmospheric pressure. At point B, the absolute pressure is equal to Pa-Pv during the depressurizing atmospheric pressure by means of vacuum pump. Therefore, the absolute pressure at point C is equal to B when ignores any head loss in pipe. The absolute pressure from point C is linearly increasing to point D by water head. Therefore, the maximum height of water lift-up by means of vacuum pump is equal to

Thus, the water cannot be discharged through the vacuum pump if the elevation head of B-D > H. This limitation can be solved by discharging water out below point C by the water pump, as shown in Fig. 10.4(a). Based on the previous concept, the conventional vacuum consolidation system was modified to be equipped with an air-water separation system embedded under the airtight sheet.
Figure 10.5 shows a pressure diagram comparison for a vacuum consolidation system without and with an air-water separation system. At a static condition, the hydrostatic pressure is as shown in line 2. After depressurized atmospheric pressure, the hydrostatic line will change to line 1 and line 3 for the vacuum consolidation system without and with the air-water separation system, respectively.

It can be seen that the vacuum pressure at the pump to the water pump are the same regardless of the amount of elevation head difference between the vacuum pump and the improved area.
10.4 Case history of air-water separation
The air-water separation concept was further developed for practical use. The schematic a compact vacuum consolidation (CVC) system is shown in Fig. 10.6. The first comparison between a conventional system and an air-water separation system was first carried out in Japan between 2001 and 2003 to confirm the validity of the air-water separation concept and the developed system (Kosaka et al., 2014).

10.4.1 Ground condition
Figure 10.7 shows the simplified ground profiles of conventional and air-water separation areas. The soil layer comprises peat, organic clay, sand, and soft clay. The natural water content of peat, organic clay, and clay was 250–600%, 40–200%, and 50–70%, respectively.

It’s important to note that normally, the presence of an intermediated sand layer in the improved area is not a favorable condition for the vacuum consolidation method because a high permeable layer affects the airtight condition during depressurization of the atmospheric pressure inside the improved area. In this case, it can be seen that the intermediated sand layer for the air-water separation area was thicker than at the conventional area. Therefore, it can be assumed that the vacuum pressure inside the improved area where the air-water separation system was applied may be lower than the conventional area.
10.4.2 Construction condition
The vertical drains were installed at 0.8 m × 0.8 m pitch in a rectangular pattern at a depth of 19–19.9 m.
10.4.3 Field monitoring data
The field monitoring results during vacuum operation are shown in Fig. 10.8. The embankment thickness was about 10.5 m. The thickness of each soil layer in both areas was slightly different but the obtained consolidation settlements were comparable at about 380 cm. Thus, the elevation head difference of both areas is comparable.
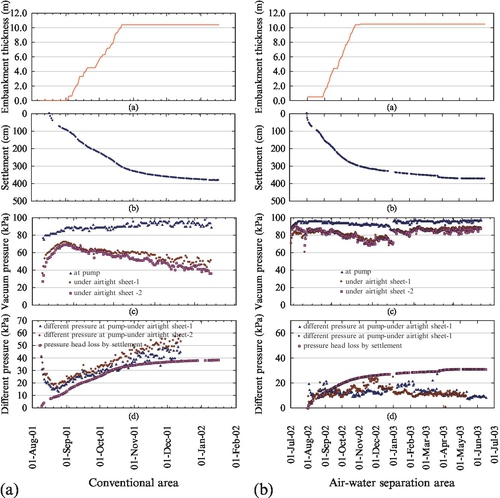
The average vacuum pressure measured at the pump for the conventional area (without an air-water separation system) was more than 80 kPa, while the vacuum pressure under the airtight sheet was gradually decreasing similar to the results presented in Section 10.2. The maximum pressure difference between the pump and under the airtight sheet was around 40–50 kPa with respect to the difference of elevation head between the vacuum pump and the improved area after the settlement. In contrast, the average vacuum pressure at the pump for the area equipped with an air-water separation area was maintained at about 90 kPa and the average vacuum pressure under the airtight sheet was maintained at a higher level during the consolidation settlement period and not related to the elevation head difference.
It was found that the average difference in pressure between the vacuum pressure at the pump and under the airtight sheet was about 18 kPa and the vacuum pressures both at the pump and under the airtight sheet were slightly decreasing until the middle of the consolidation settlement period. It then rapidly returned back to the high level. This is probably due to the cut-off of the intermediated sand layer inside the improved area out of the outside area after the settlement.
Therefore, it can be concluded that the air-water separation concept is valid and useable in practice. The vacuum pressure measured under the airtight sheet can be maintained at more than 70 kPa during the consolidation settlement, which is more powerful than the conventional vacuum consolidation method without air-water separation system that was utilized in the past.
10.5 Special case history
After the successful trial of the air-water separation system for vacuum consolidation in 2003, the use of this system has been applied to many ground improvement projects in Japan as well as in countries such as in Sri Lanka, Thailand, and Vietnam. Among those projects, the most significant was in Japan in 2010, where the consolidation settlement during construction was more than 10 m. In theory, the vacuum pressure under the airtight sheet in the conventional system should be gradually decreasing until it reaches zero after the elevation head difference between the vacuum pump and the improved area equals 100 kPa. A full-scale test embankment with well instrumentations was performed in this case study. Moreover, soil investigation programs were performed both before and after ground improvement work to evaluate the performance of ground improvement. The details are described as follows.
10.5.1 Project
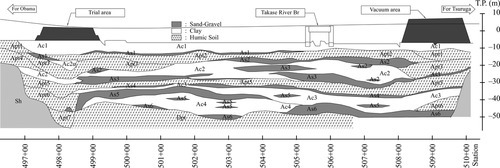
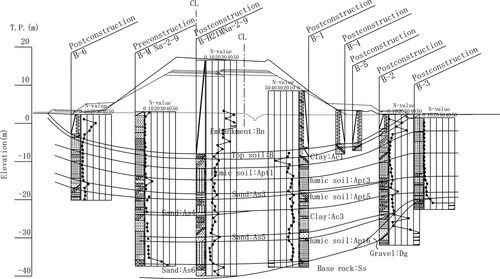
The Maizuru-Wakasa Expressway diverges from the Chugoku Expressway at Yokawa Junction and passes Fukuchiyama, Maizuru, and Obama City, and ends at Tsuruga Junction (which is connected to Hokuriku Expressway), with a total distance of 162 km. The soft ground along the construction area has a distance of 50 km, from Obama Nishi to Tsuruga. Wakasa Bay is a ria coast and many drowned valleys exist around the Mikata-goko lakes. The Mukasa area is a typical drowned valley. The geological profile is shown in Fig. 10.9. Humic soil and cohesive soil are found to form alternate layers. Cohesive soils predominate at the center part of the valley, and humic and sandy soils can also be found. At both ends of the valley, humic soil predominates with the depth of 30–40 m.
SPT-N values near the surface, with both humic and cohesive soils, were about zero, which is a required countermeasure for stability and settlement concerns during construction. Moreover, SPT-N values at deeper layers were less than 10, which is also considered to be improved. The distance of the road passing through the drowned valley is 1.3 km and most parts of the road were planned to construct the embankment at an elevation of 7–11 m.
10.5.2 Construction
Originally, the prefabricated vertical drain (PVD) with surcharge method was selected as the ground improvement work. PVDs were installed up to 34 m deep. With this method, the embankment construction rate of 3 cm/day was limited by the design criteria.
Later on, it was found that the construction time was limited. Increasing the rate of embankment construction was required to accelerate the embankment construction. Therefore, the vacuum consolidation method was selected because it could provide higher stability during construction, resulting in an increase in embankment construction rate. Moreover, vacuum pressure was also used as a surcharge load, replacing the surcharge load by embankment material. Therefore, vacuum consolidation with the air-water separation system (CVC) was selected to replace the PVD with surcharge method.
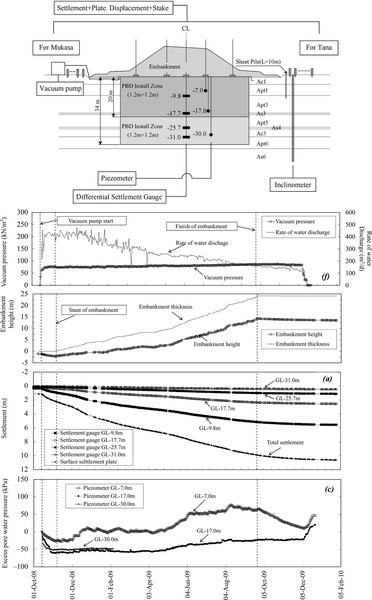
To construct the CVC system, PVDs of 7 mm thick were installed up to 20 m deep between the existing PVDs (3 mm thick), which were previously installed up to 34 m deep in a square grid pattern of 1.2 m × 1.2 m. It should be noted that the top of the existing PVDs, 3 mm, were not directly connected to the CVC system. The area of improvement was about 9000 m2. Accordingly, the vacuum consolidation system was divided into three areas with three vacuum pumps operated simultaneously. An embankment that included a surcharge backfill was designed to reach 14 m high.
10.5.3 Field monitoring data
The field monitoring instruments with time–surface settlement, differential settlement, vacuum pressure, discharge water, excess pore water pressure, and lateral displacement are shown in Fig. 10.10. A description and discussion of the field monitoring data are summarized as follows.
Vacuum operation
Vacuum pressure measured under the airtight sheet was maintained constantly at about 80 kPa along to the consolidation settlement between October 2008 and December 2009. The water discharge at the beginning of vacuum pumping was about 400 m3/day and gradually decreased during consolidation settlement to about 200 m3/day.
Surface settlement
Settlement of about 1 m was induced by vacuum consolidation prior to embankment construction. The maximum surface settlement at the termination of the vacuum operation in December 2009 was 10.6 m. Ground upheaval in the nearby area was relatively small.
Differential settlement
Large settlements were observed in the Ac1 and Apt1 layers, about 5.0 m, followed by the Ap3 layer, about 3.0 m.
Construction rate
The average embankment construction rate at the start was 3 cm/day as per the original design criteria. However, it was increased to 8 cm/day after embankment thickness was about 9 m. The total construction period was significantly shorter by more than a year compared to the trial embankment.
Excess pore water pressure
Maximum excess pore water pressure induced by the embankment load was about 50 and − 25 kPa at GL − 7.0 m (Apt1) and GL − 17.0 (Apt3) m respectively. Additionally, the excess pore water pressure at GL − 30 m (a malfunction in the middle period) was also effectively reduced by vacuum operation. Note that only PVDs for the CVC installed up to 20 m deep were directly connected to the horizontal drain and vacuum system, while the existing PVDs, installed up to 34 m deep, were not directly connected to the horizontal drain. In this case, it can be assumed that the vacuum pressure was also distributed in the sand mat passing through the existing PVD.
Correction of measured pore water pressure
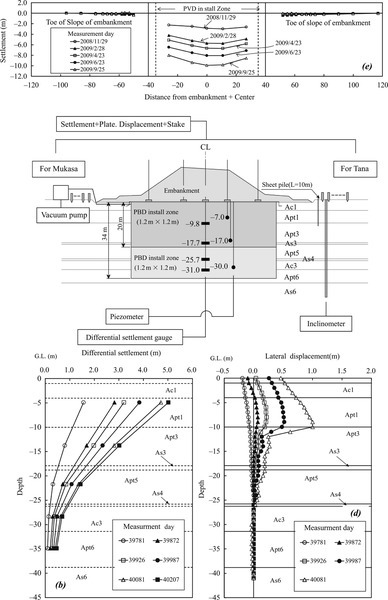
The reading of pore water pressure directly from the piezometer is required to be corrected by the location of piezometer after consolidation settlement to obtain the correct value. The data from differential settlement gauges installed at the same depth as the piezometers were used for the correction.
A corrected pore water pressure profile is shown in Fig. 10.11. It can be clearly seen that that the excess pore water pressure at piezometer at GL − 7 m was lower than the hydrostatic pressure in the beginning and was a bit higher than hydrostatic pressure during the completion of the embankment construction. In contrast, the pore water pressure at GL − 17 m was always lower than the hydrostatic line after the correction.
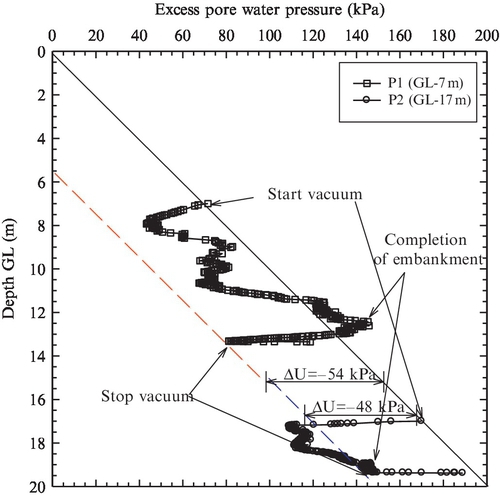
Therefore, the stability of the embankment was evaluated to be more stable than the uncorrected case. Moreover, the pore water pressure induced by embankment load was more clearly identified. The maximum excess pore water pressure of GL − 7 m at the finished level of embankment was about 20 kPa and then decreased to − 54 kPa at the termination of the vacuum operation.
For the piezometer at GL − 17, the pore water pressure was reduced to − 60 kPa before subjected to embankment load, and became about − 48 kPa at the termination of the vacuum operation. After that, the pore water pressure returned to its hydrostatic condition.
Lateral displacement
In the initial period, the vacuum consolidation induced the inward lateral displacement by about 20 cm. After the ground was subjected to the embankment load, outward movement was induced by a maximum of about 1 m. Note that the maximum lateral displacement was about 10 m deep where the tip of the sheet piles were located.
10.5.4 Postconstruction soil investigation
After the termination of the vacuum operation, postsoil investigation was carried out. The result and discussion are described as follows.
Ground deformation shape
Figure 10.12 shows the soil profile of the improvement area after termination of the vacuum operation and borehole locations. A total of nine boreholes were carried out along the cross section of the embankment. Of concern was that the large differential settlement might be observed at the boundary of the improvement area and adjacent area. However, after the inspection of the airtight sheet elevations, it was found that the settlement surface along the cross section was a smooth curve shape, probably due to the restraint effect of the reinforced layer constructed underneath the embankment.
Moreover, the surface elevation of the counterweight berm at the left side of the embankment was close to the adjacent paddy field. It was found that the settlement under the counterweight berm was about 5 m. Also, the ground surface at the counterweight berm on the right side that was leveled at the beginning of construction was upheaved after the end of construction.
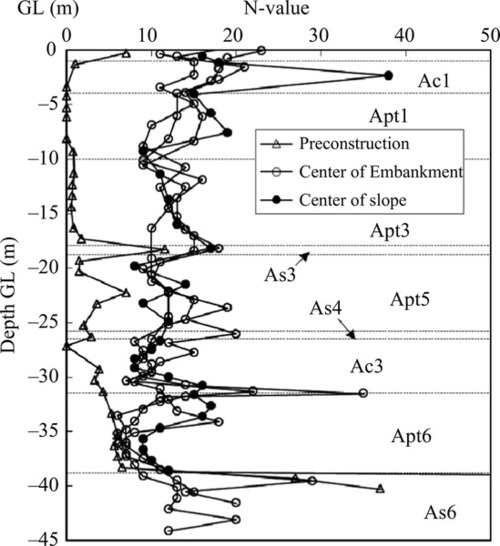
Standard penetration test
Figure 10.13 shows the SPT-N value profile both before and after improvement. Note that the design depth of improvement by vacuum consolidation is up to an elevation of − 20 m deep. It can be seen that SPT-N value was changed from 0–2 to 10–20 after improvement. Moreover, SPT-N value of the soil layer under an elevation of − 20 m to − 34 m was also changed to 10–20 and only slightly changed below 34 m. In addition, no significant difference of SPT-N value under the center of the embankment and side slope could be observed.
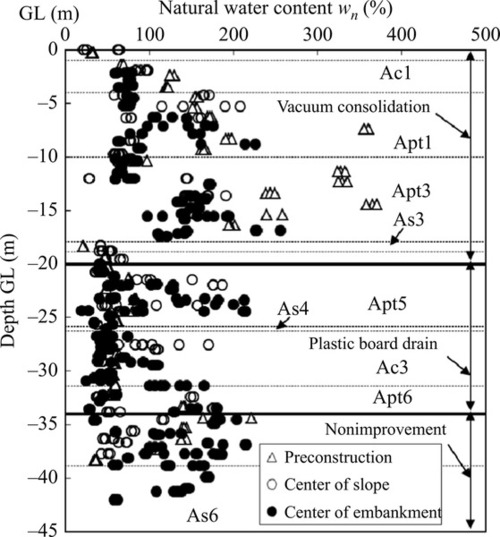
Natural water content
The natural water content was significantly decreased in the range of the vacuum consolation zone, as shown in Fig. 10.14. The maximum natural water content prior to the construction was about 400% and became about 200% after improvement. Unlike the increase of the SPT-N value from elevations of − 20 m to − 34 m, the reduction of natural water content in this zone is not clear. Also, natural water content both under the center of embankment and side slope are similar.
Undrained shear strength
Figure 10.15 illustrates the undrained shear strength from the Triaxial unconsolidated undrained test. Also, the theoretical lines are plotted based on the expression in Eq. (10.2). The solid line and dotted line represents the undrained shear strength under the center of embankment and side slope, respectively.
where
P0 = initial effective stress
ΔPemb = total stress induced by embankment load
ΔPv = total stress induced by vacuum load
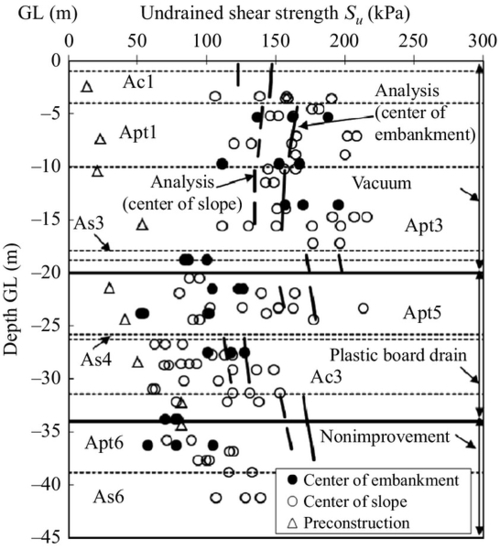
The total unit weight of embankment (γt) obtained from the field = 21.5 kN/m3 and the effective unit weight (γ′) calculated by the Boussinesq equation = 13.1 kN/m3. These values were used to calculate ΔPemb. Moreover, vacuum loads were obtained from the reduction of pore water pressure. Here, the values of ΔPv above and below the As3 layer were assumed to be 53.6 kPa and 48.2 kPa, respectively. It can be seen that the theoretical calculations are good representations of the undrained shear strength in the range of the vacuum consolidation zone, but higher than the field data lower than 20 m where the vacuum consolidation system was not applied. It can be considered the primary consolidation mostly completed in vacuum consolidation zone but quite slower outside the vacuum consolidation zone. Note that the degree of consolidation was assumed to be 100 in all calculation value.
Consolidation yield stress
The consolidation yield stress obtained from the oedometer tests are plotted, as shown earlier in Fig. 10.16, with the theoretical line calculated by Eq. (10.3).

Unlike the undrained shear strength, consolidation yield stress by oedometer tests are mostly higher than the theoretical calculation, especially in the zone improved by vacuum consolidation. It can be seen that the difference in consolidation yield stress between the center of embankment and side slope is not clear.
10.6 Conclusion
The vacuum consolidation method is a technique for soft ground improvement that utilizes the difference of atmospheric pressure. A conventional vacuum consolidation system has the limitation of preserving the vacuum pressure inside the improved area during the consolidation settlement. The case histories show that vacuum pressure measured at the pump was more than 80 kPa and the vacuum pressure measured under the airtight sheet was about 60 kPa at the beginning of vacuum consolidation. Vacuum pressure measured at the pump was likely to be constant but the vacuum pressure measured under the airtight sheet gradually decreased with time.
To resolve the problem, the concept of vacuum consolidation was analyzed to investigate the cause. It was found that the decrease of vacuum pressure is related to the elevation head difference between the vacuum pump and the improved area during the consolidation settlement. The air-water separation concept was proposed to resolve the problem and then developed for practical use.
The vacuum consolidation equipped with air-water separation system was used in many ground improvement projects in Japan as well as overseas, where the vacuum pressure under the airtight sheet was ensured to be constantly maintained at greater than 70 kPa. Among those projects, the most critical case history occurred in Japan, where the total settlement was more than 10 m during construction settlement and the vacuum pressure under the airtight sheet would become zero in the case of the conventional vacuum consolidation system. In this case, it was found that the vacuum pressure under the airtight sheet was constantly maintained at greater than 80 kPa during the consolidation settlement. Moreover, according to the postsoil investigation results, the soil properties after improvement were significantly improved. Consequently, it can be concluded that the vacuum consolidation system equipped with an air-water separation system can solve the decrease of vacuum pressure as well as provide a high vacuum pressure during consolidation settlement.