Key Issues in the Application of Vertical Drains for Sea Reclamation Using Extremely Soft Clay Slurry
Masaaki Terashi; Masaaki Katagiri Formerly of Nikken Sekkei Nakase Geotechnical Institute, Tokyo
Abstract
Kitakyushu Airport is located on a man-made island, and opened on March 16, 2006. The man-made island is located on soft marine clay deposits and the island itself was reclaimed from the sea by extremely soft clay slurry with high water content. The application of a variety of ground improvement technologies was the key component of the project from the geotechnical point of view. During the construction of seawalls surrounding the man-made island, ground improvement technologies were absolutely necessary to maintain their stability. In the reclamation phase, the acceleration of consolidation to minimize the uneven residual settlement was of prime importance. When dredged clay slurry with high water content is discharged into a pond, suspended soil particles settle loosely on the sea bottom. The dredged clay layer thus created subsequently settles, largely due to its own weight in the long term. To create a reliable foundation ground for airport facilities, the placement of good- quality fill material over the dredged clay layer and the vertical drainage to accelerate the consolidation of the layer are necessary. For the design of vertical drains in such a soft reclaimed clay ground, the accurate evaluations of the profile of reclaimed clay layer and of consolidation parameters covering a wide stress range are necessary. Based on the authors’ experience, the key issues for sea reclamation projects are pointed out along with the flow of construction. Then, taking the Kitakyushu Airport project as an example, the authors describe the ground improvement employed, the prediction method of reclaimed soil profile, determination of consolidation parameters of reclaimed clay layer, and the results of observation.
Acknowledgment
Construction of seawalls, dredging, reclamation, and airport construction were all carried out under the control of the Kyushu Regional Development Bureau of the Japan’s Ministry of Land, Infrastructure, Transport, and Tourism. The authors sincerely thank Messrs. Y. Yoshimoto, T. Ikeda, M. Nakamichi, and M. Kawano of the Kitakyushu Port and Airport Office and Messrs. M. Aso and O. Oohashi of the Kanda Port Construction Office, Kyushu Regional Development Bureau, for providing valuable information and photographs.
15.1 Introduction
Development of coastal areas in growing economies in Asia has necessitated, and will enhance, sea reclamation projects to implement a variety of infrastructures. We have already seen gigantic projects such as Seoul’s Incheon Airport, Changi Airport in Singapore, Hong Kong International Airport at Chek Lap Kok, and many others in Japan. In most of these cases, good quality hill-cut materials were used for reclaiming the sea. Although the use of hill-cut material can reduce geotechnical problems and make rapid construction easier, it may cause destruction to the environment at the borrow area and invites an increase in construction cost. Regardless of infrastructure development projects, the dredging of sea bottom sediment is performed for the maintenance of navigation channels and anchorage areas in coastal areas. The use of dredged sea bottom sediment for sea reclamation is both an environment-friendly and a cost-saving approach. This chapter describes a case history of one such undertaking in Japan, with special emphasis on the ground improvement techniques employed in the project.
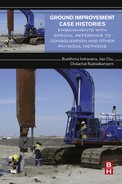
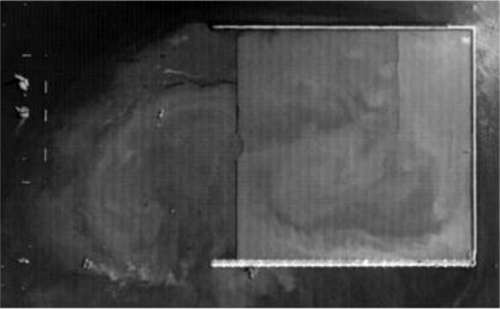
Figure 15.1 is an aerial photograph of Kitakyushu Airport under construction, taken in December 2003. It is possible to identify that the airport is being constructed on a man-made island and the extension of the runway is taking shape. The man-made island is located on soft marine clay deposits and the island itself was reclaimed from the sea by dredged clay slurry with extremely high water content. Construction of seawalls surrounding the man-made island, dredging, reclamation, and airport construction were all carried out under the supervision of the Kyushu Regional Development Bureau of Japan’s Ministry of Land, Infrastructure, Transport, and Tourism (KRDB-MLIT).
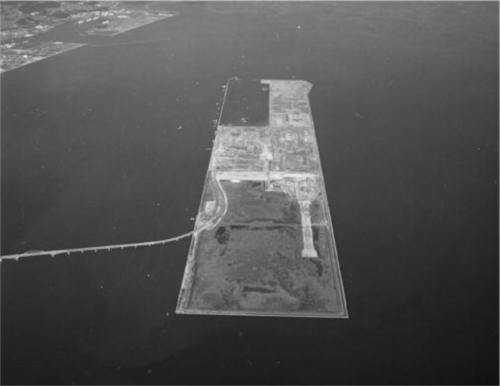
The man-made island actually consists of four areas (four separate disposal ponds), as shown in Fig. 15.2. The initial and primary purpose of these disposal ponds was to accommodate the dredged sea bottom sediments from the maintenance dredging of the nearby navigation channels and anchorage areas. Maintenance dredging is a long-lasting project as long as the area is used for marine transportation. Dredging and reclamation were carried out one after another in the sequence of K0, K1, and K2 disposal ponds. The K3 pond is still used as a disposal pond and is expected to accommodate dredged sea bottom sediments for at least 20 years from the opening of the airport.
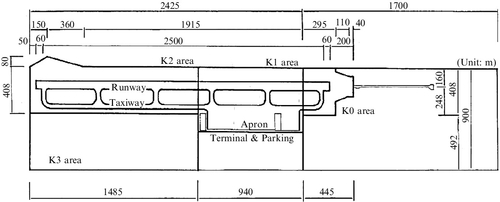
The feasibility study of the K0 disposal pond started in 1972 and the construction of seawalls for the K0 pond started in 1977. The K0 area was reclaimed from the sea for about 18 years between July 1979 and March 1997. The total amount of dredged soil measured at the original sea bottom was about 29 million cubic meters. In 1993, the master plan of locating Kitakyushu Airport on these disposal ponds was adopted. The project then had dual purposes of disposal and the relocation of an existing airport further inland. Accordingly, the K1 pond was reclaimed much faster than the K0 pond: for 32 months from October 1996 to June 1999. The reclamation of the K2 pond started in December 1998 and ended in March 2002. A timeline of these reclamation works together with the subsequent construction schedule is summarized in Fig. 15.3. The interruption of reclamation at the K2 pond was the result of partial damage to the seawall caused by an unexpected huge typhoon attack.
The first geotechnical issue was the construction of the seawall on soft seabed. The ground improvement technologies employed are only briefly touched on in Section 15.2, because the issue is not the major concern of the current chapter.
The layout of airport facilities such as a runway, a taxiway, an apron, and a terminal building on the man-made island is shown in Fig. 15.2. In the construction of airport facilities, strict measures should be taken in terms of flatness of the pavements. For example, the maximum-allowable gradient on a runway is less than 1%. The 2500-m-long runway is constructed across three areas: K0, K1, and K2. As shown in Fig. 15.3, these three ponds experienced different rates of reclamation and different elapsed time from the preloading until the construction of the runway and, thus, the residual settlement of pavement was inevitably different for each pond if no countermeasures were taken. Furthermore, the runway was to be constructed over the temporal seawall separating K0 and K1 and that between K1 and K2. The ground improvement to tame the uneven settlement was a must for assuring the requirements to the runway. The difficult geotechnical issues encountered during the reclamation to the construction of the airport facility are discussed, and the design procedure to cope with such difficulties is proposed, in Section 15.3. To evaluate the practical use of the proposed design procedure, Section 15.4 compares the prediction and performance during reclamation and primary consolidation of reclaimed clay under fill load.
After the opening of the airport, the ground surface was periodically measured to confirm the flatness of runway. Section 15.5 will discuss the residual settlement of the airport.
15.2 Seawalls surrounding the reclaimed land
15.2.1 Site conditions
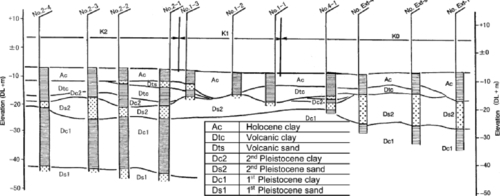
The mean water level at the reclaimed land is Datum Level (DL) + 2.0 m. The sea bottom is almost flat at around DL − 7 m and water depth gently increases offshore at a gradient of 1/3000. The ground condition is a complicated multilayer system of soft normally consolidated Holocene clay, volcanic clay, volcanic sand, second-stage Pleistocene clay, second-stage Pleistocene sand, first-stage Pleistocene clay, and first-stage Pleistocene sand appearing from the sea bottom downward. A typical soil profile is shown in Fig. 15.4. The top layer, which poses the problem of stability and settlement of the seawalls, changes its thickness from 4–10 m depending on the location, but generally increases toward the sea.
15.2.2 Type of seawalls and the ground improvement employed
Depending on the thickness of the soft clay layer and on the expected function of the seawall, roughly five different types of seawall and corresponding ground improvement techniques were used. Typical cross sections of the seawalls are summarized in Fig. 15.5 taking the K0 area as an example (Kanda Port Construction Office, 1998).
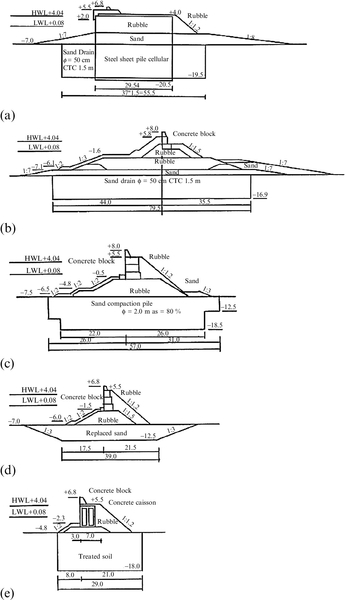
• Type I is the steel sheet pile cellular cofferdam-type revetment. In this type, sand drains were installed into the clay layer and a sand mat with 4 m thickness was placed. Then the steel sheet piles were driven down to the sandy layer beneath the soft compressible clay layer.
• Type II is the sloping rubble mound-type revetment. The revetment was constructed in stages by expecting the strength increase of clay layer with the aid of sand drains.
• Type III is a composite-type revetment with concrete blocks and rubble mound. The subsoil was improved by the sand compaction pile (SCP) method.
• Type IV is similar to Type III but the subsoil was improved by the replacement method.
• Type V is a concrete caisson underlain by rubble mound. Subsoil was improved by the deep mixing method.
• Type I and Type V were used at the locations where the berthing function is required and Types II, III, and IV were used simply to protect the island from waves.
Among the ground improvement techniques used along the seawall, there may be no need to explain the replacement of soft clay with good quality sand in Type IV and sand drain used for Types I and II. It may be appropriate to add brief descriptions on the SCP method used for Type III and deep mixing used for Type V. Both the ground improvement technologies were developed in Japan in the 1970s when Japan was enjoying a miraculous economic development. The needs of rapid construction of infrastructures enhanced research and development.
Sand compaction pile method
The equipment of the sand compaction pile (SCP) method resembles that of sand drain installation. When the tip is penetrated to a predetermined depth, the equipment is withdrawn, leaving a loose sand pile of predetermined length through its mandrel. Then, with the aid of a vibrator at the top of the mandrel, the mandrel compresses the sand pile and expands its diameter. By this process, compacted sand piles are created in situ. The compacted sand piles function to reduce settlement and to reinforce soft clay layer as a system. The technique is one of the most preferred ground improvements in Japan to tame soft ground. Aboshi et al. (1990) provided a concise state of the art of this technology.
Deep mixing method
The deep mixing method (DMM) is a kind of deep in situ admixture stabilization using hardening agents such as lime, cement, or a combination of materials. The improvement becomes possible by ion exchange at the surface of clay minerals, bonding of soil particles, and/or filling of void spaces by chemical reaction products. The strength of treated soils is of the order of 100–1000 kPa in terms of unconfined compressive strength. Research and development of the method was started in the late 1960s and was put into practice in the middle of the 1970s, before spreading to other parts of the world. Lime is replaced mostly with cement in Japan and replaced with a lime–cement mixture in Nordic countries. More recently, the combined materials of lime or cement with gypsum, fly ash, and slags have appeared and are used for particular purposes. Three decades of practice have seen the equipment improved, hardening agents changed, research efforts paid, and experience accumulated (Terashi, 2003).
15.3 Construction flow and key issues
15.3.1 Construction flow from reclamation to construction of facilities
The timeline of ground surface level from the start of reclamation with dredged clay to the opening of facilities on the reclaimed ground is shown schematically in Fig. 15.6. The horizontal axis is time, and the vertical one shows the elevation. The term of each construction stage and the change in thickness of each layer are also illustrated.
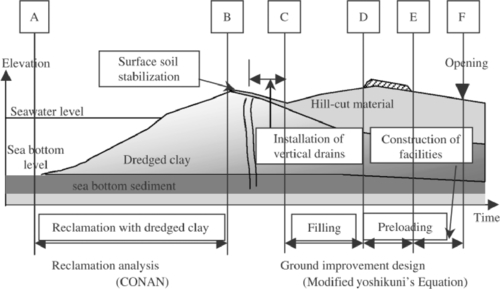
The construction stage in the figure starts after the completion of containment dikes on the sea (briefly described in the previous section). The discharge of dredged clay into the pond begins at time A and ends at time B. During this reclamation stage, suspended clay particles discharged into the pond settle loosely. While the discharging continues, the surface elevation of the dredged clay layer increases by the combined process of sedimentation and self-weight consolidation. On top of these, if the pump-dredged clay is used, the grain size sorting occurs before sedimentation. Grain size distribution changes from the outlet of discharge pipe to the spillway. Grain size sorting results in the spatial inhomogeneity of the completed reclaimed land.
Often the owners of the dredging, reclamation, and infrastructure development projects are different. The economy for one project is not always the economy for the others. The time schedule of dredging and reclamation is determined by the needs of the maintenance of navigation channel or anchorage areas, whereas the target time of the infrastructure development is determined by a separate reason. Similarly, the necessary height of the containment dikes and the area of reclaimed land may be determined by different needs. The total economy and the total construction time savings can be achieved by a well-considered initial scenario for the whole project.
If the disposal pond is constructed only for the purpose of accommodating the dredged soil, and if the life of the pond is fairly long, the engineers’ concern is the economy of dredging and transportation alone. They need only limited geotechnical information of the soil at the dredging area such as Standard Penetration Test (SPT) N values to identify the type of soil to select the most appropriate machineries for dredging and transportation. Often the selection depends on local availability of machineries. They may be satisfied with the rough prediction of volume change during the dredging to reclamation process such as by empirical “bulking factor,” which is not a function of time. However, if the infrastructure development follows the reclamation, the accurate prediction becomes important both for time and elevation.
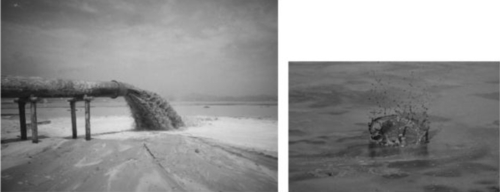
In the Kitakyushu Airport projects, the K0 pond was planned only for disposal purpose, the K1 and K2 ponds were planned to locate the airport facilities, and the K3 pond was designed only to accommodate dredged soil. In the current project, a pump dredger owned by the Kyushu Regional Development Bureau was selected. Figure 15.7 shows the outlet of the pump-dredged clay into a pond. The clay slurry has a high water content of around 2000% at the time of discharge.
Between time B and C in Fig. 15.6 is the ground improvement work stage. At time B, the settlement due to self-weight consolidation is still in progress and will take a long time to complete. To create a reliable foundation ground at a specified elevation for the structures to be built on, the placement of good quality fill material over the dredged clay layer is necessary. Most often, the surface soil stabilization and construction of working platform by sand mat precedes the placement of fill (Figs. 15.8 and 15.9).
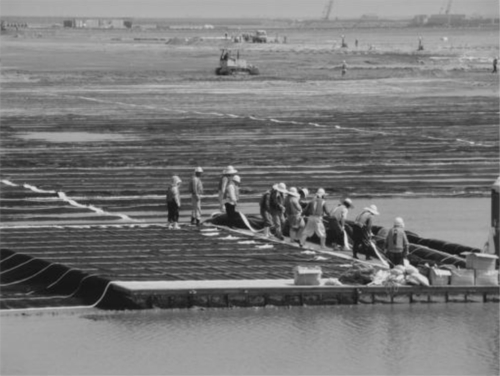

When a rapid construction is required, deep soil improvement such as by vertical drain follows the placement of sand mat for increasing consolidation rate. The sand mat also has an important function of horizontal drainage after the installation of vertical drains. During this stage, the self-weight consolidation of the reclaimed clay layer and the consolidation caused by sand mat continue. Figure 15.10 shows the sand mat surface after the installation of band-shaped drains at the K1 area. A variety of band-shaped drains are available in the Japanese market. In total, 10,000 km of band-shaped drains produced by 12 different manufacturers were installed at the project site. Figure 15.11 shows, for example, three drains whose shares in the project were large.


The placement of good quality fill material begins at time C and ends at time D, as shown earlier in Fig. 15.6. The fill material also causes additional large consolidation settlement. When the existing seabed is a thick soft clay layer, the weight of dredged clay and fill material generates the consolidation settlement of seabed as well in the long term. If the term of construction is limited, it becomes necessary to accelerate the consolidation of seabed also by vertical drainage. If the substantial portion of primary consolidation of clay layers is not attainable during this filling stage, the ground is left for consolidation during time D and E.
The construction of the structures starts at time E and ends before time F when the structures will be in operation. The performance requirement in terms of allowable residual settlement is different for a specific structure. When the residual settlements at time E and F exceed allowable value, the appropriate preloading by surcharge fill is applied at time D and left in place until time E.
15.3.2 Key issues involved
The flow of the construction stages that involve dredging, reclamation, and filling, as well as the construction of the structures, is examined in the previous subsection. The time and cost of each construction stage are extremely dependent on the consolidation of the dredged clay. The key issues in each stage will be identified in the following paragraphs.
Reclamation stage
The time and surface level relation between time A and B is a function of rate of discharged soil quantity and consolidation parameters of dredged clay. The higher the rate of discharge and the water content of dredged clay, the smaller the true soil solid volume even if the surface elevation is the same at time B. If the true soil solid volume is smaller, the magnitude of settlement of the reclaimed clay becomes larger and then will give rise to an increase in the amount of hill-cut material to achieve a specified land elevation. The choice of appropriate dredging and transporting technique is the key to increasing the true soil solid volume. The recent development in the machinery may provide an alternative approach of reducing the water content before the discharge of dredged clay.
The reclamation with dredged clay slurry is a complicated process but can be solved numerically by a generalized consolidation theory. In the present project, the numerical method named CONAN for the reclamation with dredged clay is adopted. CONAN was developed on the basis of a generalized one-dimensional consolidation theory (Imai, 1995) that can easily take the accumulation of reclaimed layers into account based on the technique proposed by Yamauchi et al. (1991). The detailed procedure of this numerical method was described by Katagiri et al. (2000). To conduct the analysis: (1) boundary conditions in terms of drainage, (2) soil condition of the seabed underlying the reclaimed clay layer, (3) reclamation time program, and (4) consolidation parameters of dredged clay that span a wide range of stress level are necessary. Therefore, soil investigation and testing of the seabed to identify (1) and (2) at the construction site should be carried out in advance of all the planning. Reclamation time program (3) is associated with the maintenance-dredging project and tends to be altered with time due to budget or unforeseen incidents. For example, as explained earlier in Fig. 15.3, the reclamation of the K2 pond was interrupted for nearly a year due to an unforeseen attack of a huge typhoon. The numerical prediction must be repeated to simulate the change(s) along with the progress of reclamation. The ordinary oedometer test is not applicable for extremely soft dredged clay. Sampling at the dredging area and the combination of multisedimentation test (MST) (Yamauchi et al., 1990) or centrifuge test (Nishimura et al., 2000) and conventional oedometer test will provide the reliable consolidation parameters for the analysis.
When the rate of discharge is slow, as in the case of the K0 disposal pond, the desiccation will take place at the surface of reclaimed clay after the elevation exceeds the water level, which will further complicate the consolidation phenomenon. The back-analysis of the reclamation process in the K0 pond provided the analytical approach for such a situation (Katagiri et al., 2001).
Ground improvement work stage
If there is ample time before the ground improvement work, detailed soil investigation and testing are carried out to determine the consolidation parameters and initial soil condition of the reclaimed layer at time B for the design of ground improvement. This is the case for the K0 area. Due to the tight time constraint and the lack of advance budget allocation, however, the design of ground improvement should be carried out with a limited soil investigation after time B, or even worse, during the reclamation stage without any actual test data. The latter was the situation for the K1 and K2 ponds. In such a situation, the numerical simulation midway between time A and B of the preceding reclamation stage (intermediate predictions) and the back-analysis of the completed reclaimed layer will provide a fairly reliable insight into the consolidation parameters and the initial soil condition for designing ground improvement at time B.
There may be a case where the effective land use program is established just before the completion of reclaimed land and suffers also from the lack of geotechnical information. In the case of rapid reclamation with clayey soil, the problem will be duplicated due to the difficulty of recovering a good quality sample at time B when a substantial portion of the reclaimed layer is still extremely soft. In such a situation, the back-analysis of the completed reclaimed layer will be effective as far as the reclamation record and water content distribution with depth at time B are available.
From the construction aspect, the most difficult part is the placement of sand mat to provide a working platform for ground improvement such as the installation of band-shaped drains. As mentioned earlier, surface improvement such as the placement of net precedes the drain installation (see Fig. 15.8). The net functions as the separator between the sand mat and extremely soft dredged clay. Only the skill of the experienced contractor can minimize the risk of a break in the net that covers the mud surface.
Preloading stage
The placement of the permanent fill starts at time C. From time C to time E, the consolidation of reclaimed clay layer will be accelerated by ground improvement such as vertical drains. However, the predicted rate of settlement and the magnitude of settlement will never be perfectly coincident with the real behavior. There are various reasons, but the most important factor in the reclaimed clay layer is its inhomogeneity, which is due to the grain size sorting during the reclamation stage. This will result in an uneven settlement of the huge reclamation area. Figure 15.12 is the uneven settlement observed in the K2 area.

The only countermeasure for an uneven settlement is to change the fill height (consolidation pressure) from place to place. The control of fill height can be done on the basis of repeated modification of the initial prediction verified through careful and dense observation of consolidation progress. The application of a cone penetration test (CPT) with pore pressure measurement is quite effective in the economy of observation (Murakawa et al., 2002; Yonezawa et al., 2004).
Construction stage of the superstructures
It is impossible to tame the residual and uneven settlement completely. In the case of Kitakyushu Airport, the runway was built over three different areas, of which the K0 to K2 areas were reclaimed in series. The degree of consolidation, the magnitude of total settlement, and the magnitude of the residual settlement differed from each other. Nevertheless, the runway should have been constructed in parallel with time and completed at the same time.
The prediction, observation, and back-analyses of changing elevation during the construction stage are important for construction control and include the modification of preload intensity and the time duration for consolidation depending on the places.
15.3.3 Design of ground improvement by vertical drains
The design procedures adopted in the Kitakyushu Airport project is shown in Fig. 15.13. As explained earlier, the design of ground improvement often precedes the completion of reclamation. In the figure, PRESENT is the time when design should be undertaken.
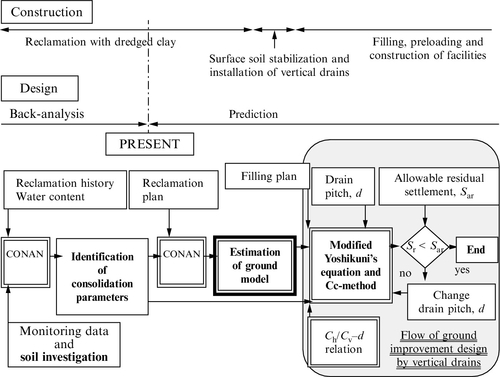
The determination of the ground model (soil profile) and consolidation parameters in such a situation should be carried out by the numerical simulation of the reclamation stage. The consolidation parameters are identified from a back-analysis of preceding reclamation with the dredged clay. Using these parameters, the soil profile of the reclaimed ground at the instance of installation of vertical drains can be predicted by the CONAN analysis. The design of preloading with vertical drains is carried out to determine the magnitude of preload and length and spacing of drains. The design should satisfy the allowable residual settlement within the given construction time. In the clay ground with vertical drains, excess pore water in the clay layer dissipates radially toward the vertical drains by horizontal flow, and the settlement of ground occurs vertically.
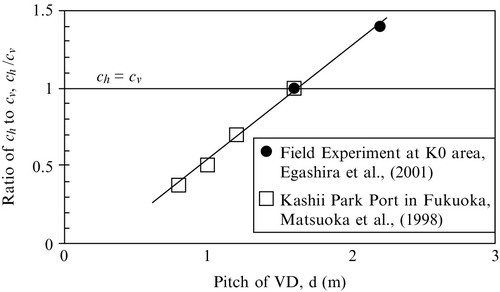
To design the consolidation process, Barron’s equation or Yoshikuni’s equation (Yoshikuni, 1979) may be used. The latter can take the well resistance and sand mat resistance into account. In either case, the horizontal coefficient of consolidation is necessary. The magnitude of settlement is estimated by the compression index, Cc. Tanaka et al. (1991), Matsuoka et al. (1998) and Egashira et al. (2001) carried out the field experiments and back-analyses to evaluate the horizontal coefficient of consolidation. These results indicated that the horizontal coefficient of consolidation was influenced by the spacing of vertical drains.
15.4 Prediction and performance: reclamation process and consolidation process under the fill load
As explained in Fig. 15.3 and Section 15.3, time constraints on the construction schedule of the K1 and K2 areas required the designer to use the design procedure proposed in Fig. 15.13. Subsections 15.4.1 to 15.4.3 discuss the determination of ground model and consolidation parameters by analyzing the measured data obtained during reclamation of the K1 area. Subsection 15.4.4 discusses the validity of ground model and consolidation parameters by comparing the prediction and performance of consolidation under fill load at the K1 area.
The design procedure adopted assumes that the reclaimed soil is uniform spatially in a single disposal pond (K1 area). However, grain sorting during reclamation invites an uneven settlement. The procedure to tame the uneven settlement is discussed in Subsection 15.4.5 taking the K2 area as example.
15.4.1 Reclamation analysis for K1 area
The reclamation analysis described in this subsection is the numerical simulation by CONAN of the formation of a reclaimed clay layer, which corresponds to the time span from A to B in Fig. 15.6.
The K1 area is 900 × 940 m in plan and the average elevation of the seabed and the thickness of the Holocene clay layer are DL − 7.7 m and +5 m before the reclamation, respectively. The sandy layer is lying beneath the Holocene clay layer. The conditions of the existing seabed at the K1 area are as follows. The Holocene clay layer before the reclamation is 3–5 m thick, and is in a normally consolidated state. The consolidation parameters are determined by the test results of undisturbed samples from the seabed, and are Cc = 1.05 and cv = 50 cm2/day. Drainage at the bottom of the Holocene clay layer is permitted.
Reclamation with the dredged clays is planned up to DL + 7 m, which corresponds to the height of the seawall. The dredged clays are from three navigation channels located near the construction site. The physical properties of the clays at the borrow area are as follows: density of soil particle ranges from 2.55–2.71 g/cm3, with the average value of 2.64 g/cm3; natural water content 73–145%, with the average value of 101%; liquid limit 47–99%; and plasticity index 26–69. For the numerical analysis, true mass of the solid part of the clays to be discharged into the pond was needed, and was calculated by the mean water content of 101% obtained from the soil investigation.
The consolidation parameters of dredged clay spanning a wide stress range were determined by the MST and the ordinary consolidation tests (OCT) conducted on only three samples taken from the borrow area (nearby navigation channels). For the initial prediction before reclamation, only the relations #1 and #A in Fig. 15.14 (hereafter called “average relations”) were available, which were determined by averaging the test results on three samples.

The dredging and reclamation plan for the K1 area was changed during the project. The total amount of dredged clay at the borrow area was not changed and was about 10 million m3. The project started with the 1996 plan, in which the reclamation term was 40 months. The reclamation term was later changed and the actual reclamation was carried out in 32 months. The initial prediction had provided valuable insight to the project but became insufficient for the design purpose of the following stages. In the intermediate analysis at 26 months, the actual record of reclamation up to 26 months and the subsequent plan at that time were used as the basis for calculation. Along with the progress of reclamation, the soil samples were taken from the K1 area after the grain size sorting during sedimentation. The consolidation parameters thus obtained had a wider range, as shown in Fig. 15.14 (Sato et al., 2000).
In the intermediate prediction analysis, the consolidation parameters are modified on the basis of “average relations” as shown in Fig. 15.14. For the compressibility, the inclination of the log f − log p relationship was changed by fixing a point at p = 1000 kPa on the average relation, as in #2 to #4. The permeability was changed by shifting the log cv − log p relationship in parallel to the average one (#A), as #B and #C. These assumed relations are within the range obtained by the samples from the K1 area. At 26 months after the start of reclamation, the intermediate prediction was performed as shown in Fig. 15.15.

This prediction is actually a back-analysis up to that period of time and the best-fit solution is utilized for the prediction in the subsequent reclamation. Fig. 15.15 shows the measured elevation of the reclaimed land monitored from the beginning of reclamation to 26 months together with some of the intermediate predictions, with different combinations of consolidation parameters shown in Fig. 15.14. The consolidation parameters used were denoted in such a way as case 2C, for example, which means a set of #2 log f − log p relationships and #C log cv − log p. The prediction by cases 2B, 2C, and 4C equally simulated the actual measurement as far as the surface elevation was concerned. The prediction by case 3C is located between case 2C and 4C. By the solution case 2C, the predicted peak of elevation would become about 8.0 m at the end of reclamation, and would be slightly larger than the designed elevation of 7.0 m.
Figure 15.16 shows the water content distribution obtained on a number of samples taken at the K1 area at 26 months. The predictions with some sets of consolidation parameters are also shown in the figure. As the grain size sorting occurs during the sedimentation process, the grain size distribution and Atterberg limits are also investigated on all the samples taken. The original characteristics of the dredged clays at the borrow area were Ip = 59–69, Fc = 43–50%, and Fs = 4–8%. The data plotted on the upper right of the figure with water content above 200% and enclosed with a circle are obtained from the samples with higher liquid limit and with larger clay fraction content (< 5 μm) in comparison with original clays. The data with lower water content on the lower left enclosed with another circle are from the samples that contained sand fraction more than 25%. When ignoring the data enclosed with two circles, the predicted water content distributions by the cases 2C, 3C, and 4C agree well with the measured ones. At this intermediate stage, the suitable set of consolidation parameters was determined as case 2C because the predicted relation for that set simulated the overall behavior until 26 months.

15.4.2 Estimation of soil profile
Figure 15.17 shows the estimated soil profile prior to ground improvement, which corresponds to time B in Fig. 15.6. The soil profile is the initial condition for the settlement analysis under the fill load with vertical drainage. The profile was obtained from the CONAN analysis using the identified consolidation parameters (case 2C) in the intermediate prediction. Figure 15.17(a) shows the excess pore pressure distribution that is defined as total overburden stress minus effective stress calculated by CONAN. The settlement of reclaimed land under the fill was calculated by considering this initial excess pore pressure distribution and load of fill, using compressibility Cc. The rate of consolidation was evaluated by the modified Yoshikuni’s equation, as mentioned earlier.
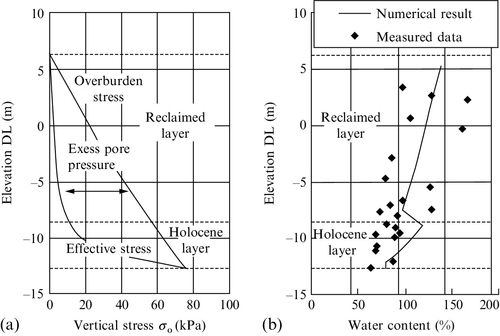
The water content distribution was also obtained from CONAN analysis as shown in Fig. 15.17(b). In this figure, the water contents measured later at 39 months are also plotted. In the Holocene clay layer, the prediction is slightly larger than the measured ones, but in the reclaimed layer, the prediction is located in the middle within the distribution of measured data. The numerical result is confirmed to agree with the measured data when the appropriate consolidation parameters are identified through the back-calculations.
15.4.3 Estimation of consolidation parameters of reclaimed land
The consolidation parameters for the settlement analysis under the fill load were estimated by extrapolating the parameters identified by the CONAN analysis during the reclamation with dredged clay. The stress level in the reclaimed land during the filling was thought to be from 1–100 kPa, and that in the reclamation stage with dredged clay was less than 3 kPa.
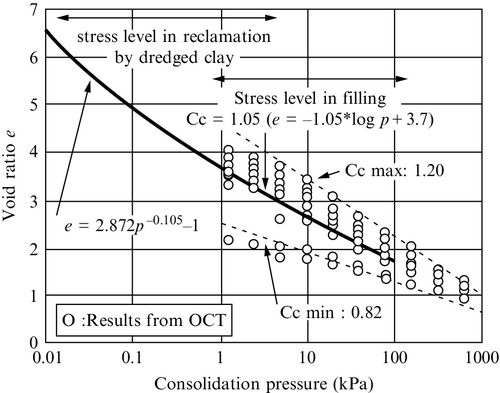
For the compressibility, extrapolation of the log f − log p relationship of reclaimed clay layer was used as shown in Fig. 15.18. The solid curve in the range from 0.01–1 kPa is the identified one, and the line over 1 kPa is linear extrapolation with Cc = 1.05. The plots in the same figure show the test results of undisturbed samples taken from the deep part of the reclaimed layer in the K1 area during the reclamation. The assumed relation is located in the middle of the test results, and is thought to be appropriate.
For the rate of consolidation, 50 cm2/day, which corresponds to the lower value of #C in Fig. 15.14(b) in the range from 1–100 kPa, was selected. The test results of undisturbed samples were distributed from 20–120 cm2/day in normally consolidated state. The coefficient of consolidation is also adequate.
For the design of ground improvement using the vertical drain, the horizontal coefficient of consolidation is necessary. In this project, the result of field experiments at the K0 area (Egashira et al., 2001) and Kashii Park Port in Fukuoka (Matsuoka et al., 1998) shown in Fig. 15.19 were used. The relationship between pitch of drain, d, and ratio of horizontal coefficient of consolidation, ch, to vertical coefficient of consolidation, cv, obtained from the consolidation tests on the sampled specimens, is linear. The ch value for the present calculation was estimated by the linear d − ch/cv relationship.
15.4.4 Evaluation of design of ground improvement
Figure 15.20 shows the monitored settlement of reclaimed land at the K1 area up to 2000 days after the completion of reclamation with dredged clay. As shown in the figure, the construction of the runway in the K1 area started at 1590 days and the opening of the airport was 2400 days after the completion of reclamation.

Two predictions are also drawn in the same figure. The dotted line is the prediction by the consolidation parameters identified through the reclamation analysis (initial prediction). Initial prediction provides the reasonable estimate on the conservative side of measured settlement–time relations. The proposed procedure of determining the initial condition and consolidation parameters from reclamation analysis is confirmed to be practically acceptable. The solid line (modified prediction) is the prediction by modified consolidation parameters based on the time–settlement relation measured at monitoring point V-1-2 T. It is recommended that the initial prediction be improved when time permits.
In the case of the K1 area, primary consolidation settlement is smaller than the initial prediction, as shown in the figure. Uneven surface elevation at the time of construction of the runway was corrected simply by partial removal of fill material.
15.4.5 Construction control to tame the uneven settlement
The reclamation by extremely soft clay soil is a complicated process, as explained earlier. The sedimentation of soil particles is always associated with the grain sorting process. Sand particles settle near the discharge outlet and colloidal particles travel down to the spillway, which result in the inhomogeneity of the reclaimed layer.
Most often, the sand particles form a layer or layers in the reclaimed soil and the thickness changes in some places. The uneven settlement as illustrated in Fig. 15.12 is not an exceptional case. As shown in Fig. 15.20, the primary consolidation will end earlier at some locations and continue at the other locations. The uneven settlement during filling stage is inevitable but not a real problem. The trouble is anticipated if the residual settlement after the completion of a superstructure would violate the function of superstructure.
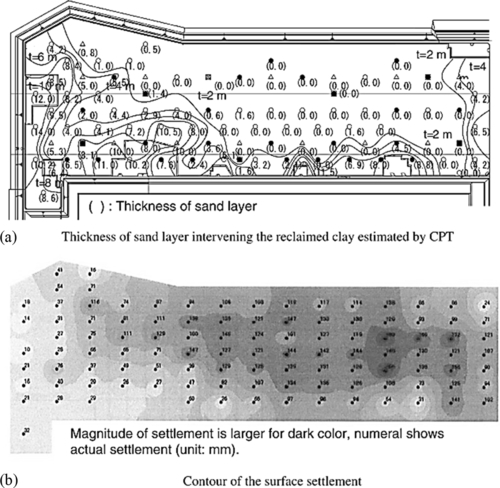
The solution for taming the residual settlement is the timely modification of the predetermined preload intensity and the time duration for consolidation in advance of the construction of a superstructure depending on the places. The modification should be based on the dense observation of the elevation. A total of 107 settlement plates were monitored in the K2 area alone. To verify the monitored settlement, the thickness of the sand layer intervening the reclaimed layer was estimated by the CPT test results and the back-analyses of the settlement–time relation were repeated.
Figure 15.21(a) shows the contour line of the thickness of sand layer estimated, and Fig. 15.21(b) shows the contour of measured settlement over the K2 area. A good coincidence was found between the estimated thickness of sand and measured settlement. The criteria for judging the sand were: (1) the magnitude of tip resistance, (2) the magnitude of pore pressure, and (3) the classification chart proposed by Robertson (1990) based on correlation between tip resistance, sleeve friction, and pore water pressure.
15.5 Residual settlement
15.5.1 Allowable residual settlement
In this project, the allowable value of residual settlement was set at 35 cm for 30 years after the opening of airport, which includes 20 cm of secondary consolidation settlement. The secondary consolidation settlement was predicted using the results of long-term consolidation tests on undisturbed alluvial and reclaimed clay samples. In the design of vertical drains, therefore, the primary consolidation settlement of the airport after its opening should satisfy 15 cm or below.
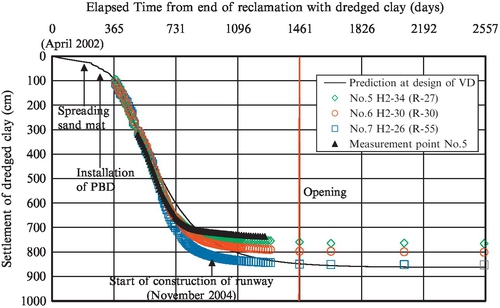
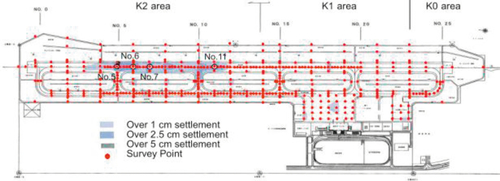
Figure 15.22 shows the settlement of reclaimed land at monitoring points 5– 7 in the K2 area as shown in Fig. 15.23. The origin of horizontal axis is the end of reclamation with dredged clay, and 1461 days is the time of opening of airport. The initial prediction of settlement of reclaimed dredged clay layer is also drawn in the same figure. The settlement of reclaimed land up to its opening is around 800 cm. From the simulation, using results of oedometer tests on undisturbed samples taken from the reclaimed layer before 0.5 years from the opening, the reclaimed clay layer at its opening is predicted to be in the normally consolidated condition without excess pore pressure. The settlement of the K2 area after the opening is thought the secondary consolidation.
The settlement of the K1 area was shown earlier in Fig. 15.20, in which the opening of the airport for the K1 area was 2400 days after the completion of reclamation. The settlement of the K1 area after the opening is thought to be similar to the secondary consolidation.
15.5.2 Settlement of airport after opening
Figure 15.23 shows the location of 447 monitoring points and the contour of surface settlement of the airport for three years from its opening on March 2006. The dark parts shows the range greater than 5 cm, and the light dark is the range from 2.5–5 cm. The most significant settlement occurs in the K2 area where the reclamation with dredged clay ended in March 2002.
Figure 15.24 shows the log time and total settlement relations of monitoring points 5–7 in the K2 area up to three years after the opening of the airport. The opening of the airport for the K2 area occurred 1461 days after the completion of reclamation. According to the log t method, the secondary consolidation settlement at monitoring point No. 5 is predicted to be 21 cm for 30 years (7 cm for 3 years after its opening and 14 cm for the coming 27 years), and that at monitoring point No. 7 is 12 cm (4 cm for 3 years and 8 cm for the coming 27 years). The slopes of log time and settlement in strain after the opening are 0–0.7%. Here, initial thickness of clay layer was set at 20 m. The coefficient of secondary consolidation obtained from long-term consolidation tests on the undisturbed samples are 0.13–0.70, and agree with the results of monitoring of the airport and long-term consolidation tests on undisturbed alluvial and reclaimed clay samples, as mentioned earlier.

Figure 15.25 shows the changes of elevation of the runway center. The horizontal axis shows the distance from the point at the north end of runway. The measured data at 0.5 year before opening (October 2005), the opening (March 2006), and 0.5, 1.5, and 3 years after the opening of airport are drawn. The predicted elevation of each point at 20 and 30 years after the opening are also shown. As shown in the figure, the elevation of the runway surface at the time of opening was determined differently for the K1 and K2 areas, still satisfying the requirement of overall flatness of the runway. The planned elevation for the K2 area was designed higher to reduce the removal volume of fill material. In the range from 900–1200 m in the K2 area, which includes monitoring points 10 and 11, an additional layer of 10 cm was left in place because 10 cm of primary consolidation settlement for a half year after the completion of runway was predicted.

The maximum settlement of about 10 cm for a half year before the opening occurred at monitoring point 11 in the K2 area, as predicted. This area is located far from the discharging points and high plasticity clay is thought to be piled up. In fact, the excess pore water pressure of reclaimed ground in this area was confirmed by oedometer tests. The settlement calculated due to the dissipation of this excess pore water pressure was approximately 10 cm as Cc = 1.05, and was equivalent to the measured settlement.
The secondary consolidation settlements around monitoring point 11 for 30 years after its opening were predicted at 12 cm by the log t method, and were confirmed in the range of allowable secondary consolidation settlement of 20 cm.
At monitoring point 5, the maximum settlement of 7 cm was generated for 3 years after its opening, as mentioned earlier. At this point, 5 cm of settlement for a half year before its opening occurred. It was confirmed that a little excess pore pressure of reclaimed clay ground before 0.5 years of opening (September 2005) existed at this point. Similar to monitoring point 11, the settlement due to dissipation of excess pore pressure was equivalent to the measured data for a half year before its opening.
The secondary consolidation settlement at monitoring point 5 was predicted as 21 cm for 30 years (7 cm for 3 years after its opening and 14 cm for the coming 27 years). The predicted secondary consolidation settlement is almost the same as the allowable value of 20 cm. The method used combined with Yoshikuni’s equation and the coefficient of secondary consolidation was confirmed to be effective.
15.6 Conclusion
Construction of the reclaimed land for the Kitakyushu Airport was started at the K0 area with the primary purpose of accommodating dredged clay slurry from maintenance dredging of nearby navigation channels and anchorage areas. Figure 15.26 shows the aerial photograph taken in August 1979. One-half of the containment dikes for the K0 area were completed and in the middle of the K0 area, the temporary sheet pile wall structure separating the half-completed pond and surrounding sea can be observed. On the upper left corner of the photo is the location for the Type V containment dike, two barges were improving the sea bottom by deep mixing.
The sea reclamation was extended to the K1 area, then to the K2 area. Figure 15.27 shows the aerial photo taken in August 1996 immediately before the reclamation started at the K1 pond. As the master plan of the airport on these reclaimed land was already determined in 1993, the dredging and reclamation project changed into rapid construction.

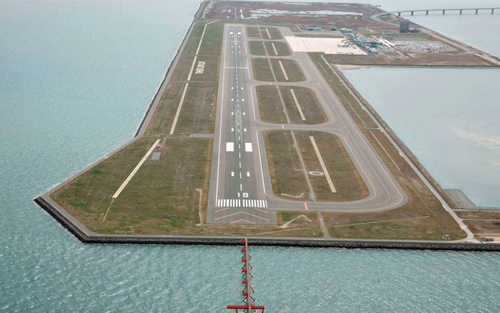
The aerial photo of the airport after its opening is shown in Fig. 15.28. The maximum additional settlements at 30 years after opening were predicted at 21 cm. This predicted secondary consolidation settlement is almost the same as the allowable value of 20 cm. The method used combined with Yoshikuni’s equation and the coefficient of secondary consolidation was confirmed to be effective.
For the construction of infrastructures on the reclaimed land with dredged clay, the key issues from a geotechnical point of view are considered along with the flow of construction stages. In particular, the determination of ground model and consolidation parameters is a serious problem if the design of ground improvement is undertaken before the completion of reclamation. The design approach in such a situation was proposed. The case records clearly demonstrated the importance of taking the key issues into account, validity of the approach, and the practical use of CONAN for the prediction of reclamation.
Since 2010, the K3 area next to the airport shown in Fig. 15.28 accepted dredged sea-bottom sediment from the Kanmon Waterway and surrounding sea routes. The remaining capacity of the K3 area decreased. To increase the capacity of the disposal pond, an extra-embankment near the seawall in the K3 area was constructed using dewatered clay lumps made of dredged material that existed in the K3 area (Moriki et al., 2011).