
Implementation and Performance of Stone Columns at Penny’s Bay Reclamation in Hong Kong
Suraj De Silva Maunsell Geotechnical Services Limited, Hong Kong
Abstract
During the 1980s, and particularly in the 1990s, many reclamations were carried out in Hong Kong to provide land for various development projects, such as the New Towns, the port, and the airport facilities and infrastructure, thereby reclaiming land well away from the original shoreline and in deeper waters. The seabed surrounding Hong Kong comprises thick deposits of highly compressible very soft marine and alluvial clays and silts. Generally, the top layers of mud are contaminated, requiring special measures during dredging, handling, and disposal. The contaminated mud can only be disposed of at designated mud pits at East Sha Chau and these pits are filling up fast. Also the disposal of the uncontaminated soft muds is becoming difficult due to the fast depleting disposal sites. Therefore, dredging and offsite disposal of mud has effectively been stopped by the Government of the Hong Kong Special Administrative Region (HKSAR). It is thus necessary to leave the soft marine mud (marine clay and silt) in place and reclaim over it. However, to increase the shear strength and to minimize future residual settlement of the reclaimed land, it is necessary to improve it with ground treatment so that the residual settlements can be limited to magnitudes that do not compromise the subsequent serviceability of the land. This chapter presents a case study where stone columns were installed to treat the mud at the Penny’s Bay reclamation project, to form the land for the Hong Kong Disneyland Theme Park (DTP), under Penny’s Bay Contract 2 for infrastructure development. Stone columns were installed to expedite the consolidation of the muds to within 2–3.5 months, the time available under the tight construction program, and to achieve the stringent residual settlement and differential settlement criteria required for the construction of the Hong Kong DTP. The stone columns were installed by the “dry” bottom feed method. A 10–12-m-high surcharge was also placed on the treated ground. This chapter discusses the installation and performance of stone columns and presents the back-calculated field coefficients of horizontal consolidation, ch(fleld), and assesses the benefits of using stone columns to accelerate the consolidation process to reduce residual settlements of reclamations constructed over soft muds.
Acknowledgments
The author thanks the Special Duties Office of the Civil Engineering Department for granting permission to publish this case history and Mr. Stephen Jones, Resident Engineer for the Penny’s Bay Project, and all those who assisted in preparing this chapter.
23.1 Introduction
The population in Hong Kong increased rapidly between the 1950s and the late 1980s. From about the early 1970s, the economy of Hong Kong also developed rapidly, increasing Hong Kong’s prosperity and the demand for better housing and other infrastructure facilities. From the early 1970s, the government embarked on a program to develop new townships in the New Territories, to the north of the Kowloon Peninsula. However, owing to the scarcity of buildable land, it was necessary to create new land through reclamation; reclaiming it from the sea. This has led to major reclamation works undertaken since the early 1970s in Shatin, Tai Po, Tuen Mun, and, more recently, in Tseung Kwan O for the development of the New Towns.
The seabed surrounding Hong Kong is underlain with very soft to soft, recent marine sediments. Owing to restrictions and difficulties in removing the mud and disposing it, it is necessary to reclaim new land by filling over the soft compressible mud. However, to minimize future settlements, the soft marine mud and clays had to be treated. After the early 1980s, when prefabricated vertical band drains became popular following their successful use at the Changi Airport reclamation in Singapore in the 1970s, the ground treatment method commonly employed was the insertion of prefabricated plastic vertical band drains to shorten the drainage paths in the mud. In some cases, surcharge was used to further accelerate the consolidation process. Two full-scale field trials were conducted in Hong Kong, in 1980 at Tseung Kwan O and in 1984 at Chek Lap Kok, to assess the performance of vertical band drains for these specific sites.
The early reclamations in Hong Kong (prior to about 1980) were carried out either by dredging the soft mud and replacing it with suitable fill, or by placing fill directly on soft mud without treatment, except preloading in some instances. Following the successful results obtained from the two field trials carried out in Hong Kong, where program constraints and residual settlement criteria permitted, the reclamations after the 1980s have been carried out using vertical band drains and surcharging; and no other ground treatment method has been tried out in Hong Kong for a major reclamation project. Therefore, a large body of valuable experience has been gathered by the geotechnical practitioners in Hong Kong on the field performance of various types and makes of prefabricated plastic vertical band drains.
One of the difficulties experienced with prefabricated band drains is the slower-than-predicted rate of consolidation of the mud in certain instances, particularly when the soft mud thickness is large, greater than about 15 m. Another problem is the higher-than-expected residual settlement of the ground after completion of the ground treatment works. These issues invariably lead to contractual difficulties when the handover is delayed due to the longer-than-expected time required for consolidation. Contractual complications also arise when the ground continues to settle far more than that predicted at the design stage.
Owing to these inherent difficulties and uncertainties experienced in some instances of band drains in the past, it was decided to install stone columns at Penny’s Bay in areas that required ground treatment, given the extremely short time available for ground treatment works and the stringent settlement criteria that had to be met after handing over the site. This chapter briefly describes the design approach adopted in the stone column design, the installation method used, and the settlement behavior of the treated ground. The settlement behavior of the treated ground was better than expected. Therefore, the settlement behavior was analyzed to back-calculate the field coefficients of horizontal consolidation, ch(fleld), of the composite ground. The possible reasons for the high ch(field) values of the composite ground when compared with the laboratory-determined coefficient of vertical consolidation cv(lab) are discussed in the following sections.
23.2 Background
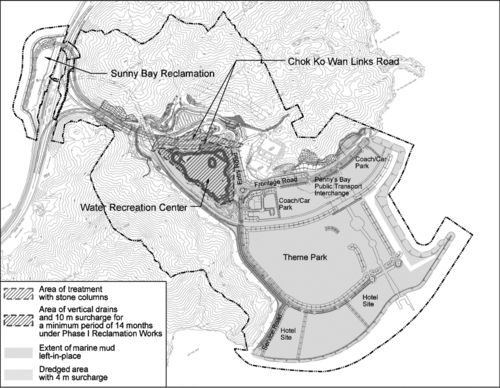
In the late 1990s, the Government of the Hong Kong Special Administrative Region (HKSAR) decided to build a Disneyland Theme Park (DTP) in Hong Kong, and Penny’s Bay was selected as the most suitable site. In mid-2000, the first contract under the “Theme Park Project,” the Phase I Reclamation Contract for 200 hectares (ha) of land was awarded. The reclamation was predominantly a dredged reclamation. But, soft mud was left in place at the northern end and some areas of it was treated with vertical band drains installed from land (after placing reclamation fill) under the Phase I reclamation contract (see Fig. 23.1). In October 2001, the infrastructure construction contracts were awarded, which included the ground treatment works under Contract Phase 2. The Penny’s Bay reclamation works and the infrastructure development works, which commenced in mid-2000 and October 2001, respectively, were essentially fast-track, high-priority land formation and infrastructure development contracts, to open the theme park on schedule.
It was essential that the formed and treated land complying to stipulated long-term total and differential settlement criteria was handed over on or before the stipulated handover dates. Thus, given the very short construction period, the time available for consolidation of the soft mud was very short; and there was no margin for error. If the performance of the ground treatment works was not adequate and if it resulted in large predicted residual settlements (larger than the residual settlement magnitudes stipulated in the contract), then the land parcel would not have been accepted by the client, resulting in a significant claim and a delay to this high-profile project. Thus, the ground treatment method adopted had to perform effectively and as predicted.
Given these stringent requirements, it was decided to adopt stone columns instead of the tried-and-tested prefabricated vertical band drains to treat the soft marine mud. The stone columns were selected because they would contribute to the consolidation of the soft mud by acting as large-diameter drainage wells within the soft mud (as compared to the small effective diameter of the vertical band drains and their potential for deterioration with time) and also because they would contribute to minimizing the settlements and differential settlements by sharing the loads and transferring it to the firmer strata beneath the soft mud.
23.3 The site
Penny’s Bay is a secluded inlet, well protected from the open sea. It is located at the northeast corner of Lantau Island, between the hills of Sze Pak Tsui and Mong Tung Hang. The calm waters of the bay have contributed to the sedimentation process and the bay is underlain with thick deposits of marine muds, comprising marine clays and silts; up to ~ 25 m at the middle of the bay. The muds are underlain with thick alluvial sediments, decomposed rock, and bedrock. Under the reclamation contract, the land was formed by hydraulically placing marine sand fill dredged from the East Lamma Channel, west Po Toi, and Wailingding—all locations within Hong Kong waters. The soft mud was fully dredged from most of the areas under the Phase I reclamation contract, such as for the seawall foundations and for the theme park area, and left in place at the northwestern corner of Penny’s Bay and under the water recreation center. In the vicinity of the former Cheoy Lee Shipyard, partial dredging of some of the contaminated mud was carried out for the purpose of treatment of the contaminated mud and subsequent land disposal. Under the Phase I reclamation contract, vertical band drains were installed in areas under the water recreation center to the south of the stone column treatment area using land plant.
However, when the design and construction contract for the infrastructure was awarded, the ground settlements were reassessed along the major approach road alignments, and it was realized that treatment would be required in certain locations to accelerate the consolidation process and to achieve the stipulated residual settlement criteria within the time available. Therefore, it was decided to install stone columns and surcharge the area indicated in Figs. 23.1 and 23.2, the area under the footprint of the main approach road to the theme park and to the north of the area treated with vertical band drains.
23.4 Ground conditions
The area where the stone columns were installed was reclaimed to an elevation of about 4–5 mPD (~ 3–4 m above the mean sea level) by placing hydraulic sand fill over soft marine mud. The present thickness of the fill layer (when measured from an elevation of 4 mPD) ranges from about 8–16 m with an average depth of about 12 m. The underlying marine mud, the thickness of which ranges from ~ 0 mud thickness encountered at some locations along the northern boundary of the ground treatment area, where it has been dredged, to a maximum of ~ 10 m, appears to have partially consolidated under the reclamation fill load.
The standard penetration test N values obtained from the marine mud layer ranged from 3 to 27 and averaged about 4. The properties of the marine mud layer determined from laboratory tests carried out prior to reclamation are shown in Table 23.1. The moisture content of the mud appears to have decreased under the reclamation fill from the values indicated in Table 23.1 when the stone columns were installed. The marine mud can be classified as highly to very highly plastic clays and silts. The compression index, Cc, ranged from 0.7–0.95. The coefficient of vertical consolidation (for virgin compression) determined from standard 1D oedometer tests ranged from 0.6–2 m2/yr with an average value of about 1 m2/yr. The marine mud is underlain with alluvial sands and gravel with occasional pockets of alluvial silt. The saprolite layer below the alluvium generally comprises silty sand and gravel-sized fragments of completely to highly decomposed granite and rhyolite. The bedrock is granite and rhyolite, which was encountered at elevations of about − 16 to − 28 mPD. Figure 23.3 shows a typical cross section of the ground conditions within the ground treatment area.
Table 23.1
Typical properties of marine mud encountered in Penny’s Bay
| Formation | Moisture content (w%) | Liquid limit, LL (%) | Plastic limit, PL (%) | Plasticity index, PI (%) | Bulk unit weight γbulk (kN/m3) | Sand content (%) | Silt content (%) | Clay content (%) |
| Marine mud | 40–100 | 44–90 | 25–45 | 19–54 | 14.5–17.5 | 5–8 | 55–70 | 25–35 |


23.5 The design approach
One of the main objectives for installing the stone columns was to speed up the consolidation process, so the function of the stone columns was to facilitate the dissipation of the excess pore pressures from the muds and to consolidate it. Therefore, the design approach adopted was the same as that used in the design of vertical band drains, where both vertical consolidation with drainage at the top and bottom of the layer and radial consolidation with drainage into the stone columns were considered. The rate of vertical consolidation was estimated using the standard Terzaghi theory and the radial consolidation was evaluated using Barron’s theory. The combined rate of consolidation was then estimated using Carillo’s theory. The reduction in the consolidation settlement of the mud layers, and thus the residual settlements, were estimated using replacement ratios and Priebe’s (1976) charts and plots.
23.6 The design
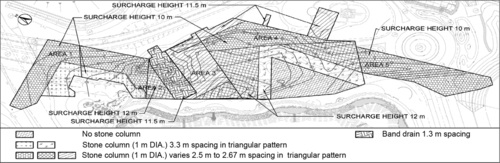
It was decided to install 1.0-m-diameter stone columns. The construction program for the infrastructure works permitted only ~ 2.5–3 months for ground treatment works. These constraints dictated the stone column spacing and the surcharge required. The stone column spacing required were 2.5, 2.67, and 3.3 m in a triangular arrangement depending on the marine mud thickness and the surcharge height adopted, corresponding to replacement ratios (as) of 14.5%, 12.7%, and 8.3%, respectively. The surcharge height ranged from 10–12 m. The layout plan of the ground treatment works design is shown in Fig. 23.4.
23.7 Installation of stone columns
23.7.1 Equipment
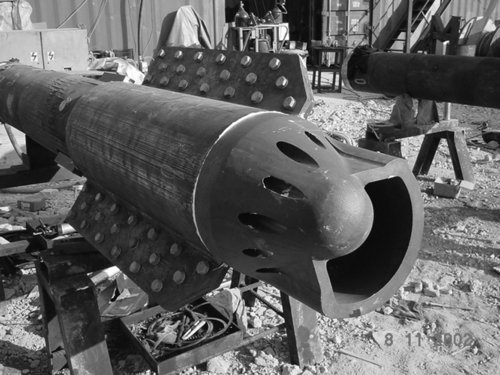
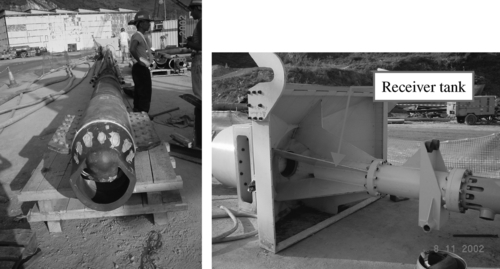
The machine used in the installation process was the penetration unit, which comprised a long slender steel tube with three parts: the vibrator or the vibroflot, the silo tube, and the receiver tank. The ground penetration down to the required depth was achieved by water jetting and “liquefying” the surrounding in situ soils by the vibroflot (see Fig. 23.5). The silo tube contained the stone supply and the receiver tank at the top of the silo was used to feed the stones to the silo tube.
Another auxiliary plant comprised a service crane, a generator providing power to the probe, an air compressor providing compressed air to the tremie pipe to push the stones out, the high-pressure pump for the supply of an air–water mix to the probe at a high pressure, and the service pump to supply water. The vibroflot consisted of a hollow cylindrical body of 300–400 mm diameter connected by means of a special elastic coupling to the silo tube. A V23 vibratory probe was used in this project. The silo tube is a pressurized tube to push out the stones into the ground. The receiver tank mounted on top of the silo tube comprised the receiver hopper, the closing mechanism, and the intermediate tank. This arrangement allows for the supply of stones to the silo tube, while maintaining a positive air pressure inside the silo tube (see Fig. 23.6).
23.7.2 Field trial
Before the installation of the working stone columns, a field trial was carried out to determine the amperage of the current consumed by the electric motor of the vibroflot to achieve a 1-m-diameter stone column within the mud encountered at the site. The average column diameter was calculated for each column in the light of the volume of stones consumed. However, since it is the loose stone volume of the stones consumed that is measured, the compaction factor, which is the volume reduction factor between the loose and the compacted gravel, must also be determined to calculate the compacted volume of stones within the column and thus the stone column diameter.
23.7.3 Installation
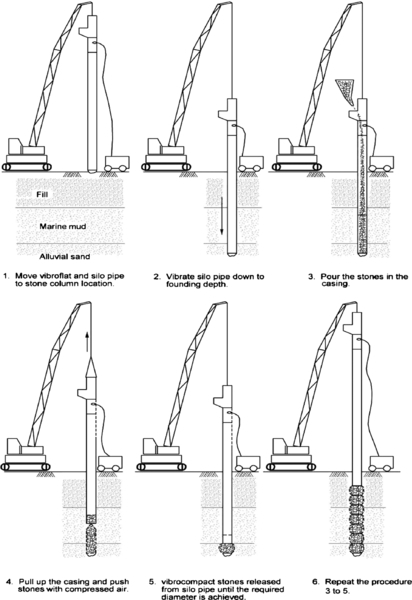
The stone columns were installed using the “dry” bottom feed method. The penetration unit was suspended from a crane and lowered into the ground; the penetration was achieved by the “liquefaction” of the surrounding ground and water jetting. The penetration unit was inserted into the ground until the stone column founding layer was reached. As the penetration unit was inserted, the current consumed by the vibroflot was recorded. The amperage of the current gives an indication of the consistency of the surrounding ground at the depth of the vibroflot. However, prior to the installation of the stone columns, piezocone penetration tests were carried out in a 20 m2 grid to establish the top and bottom of the soft mud layer and the founding level of the stone columns.
Once the penetration unit had reached the founding depth, which was about 1 m below the base of the soft sediments, the stone column was installed by pouring stones into the hopper basket and opening the trap door at the base of the casing by lifting the casing up and releasing the stones under air pressure into the ground. The volume of the stones that leaves the casing was closely monitored along with the depth of the casing. The stones that exited the casing were then vibrated and compacted into position. By monitoring the volume of stones and the length of the stone column formed and using the volume reduction factor for the compacted stones, the average diameter of that section of the stone column can be determined. More stones were pushed out of the casing and they were vibrated into position until the required diameter of the stone column was formed.
The amperage of the current consumed by the vibroflot was closely monitored, and this gives a good indirect indication of the diameter of the column being formed (when the amperage of the current consumed by the vibroflot is compared with the current consumed in the calibration tests of the field trial undertaken under similar ground conditions). This process was repeated up to the top of the column, which was about 2 m above the top of the marine mud layer and located in the sand fill, to provide an adequate hydraulic connection between the stone column and the overlying sand fill layer. Figure 23.7 is a schematic of the installation process, and Fig. 23.8 shows a typical data monitoring sheet showing the parameters that are monitored during the installation process. Note that the vertical column records the time in minutes from the commencement of penetration.
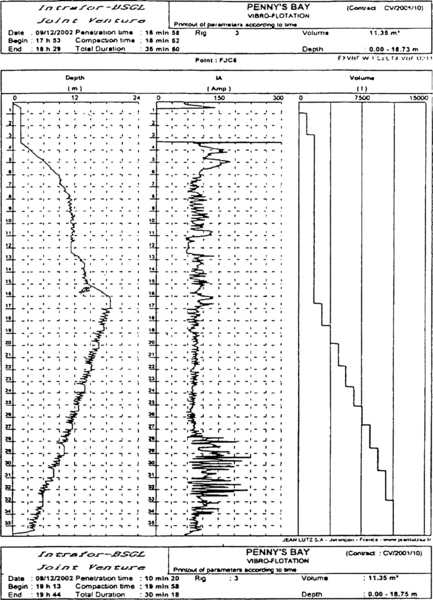
The data monitoring sheet shows that the founding depth of the stone column was about 18.75 m from ground level and this depth was reached in 17 min. Thereafter, the depth decreases as the penetration unit was retrieved while compacting stones into the ground. Thus, it can be seen that the volume of the stones increases steadily with time until the penetration unit is withdrawn to the surface and the stone column formation has been completed. It has taken a total of 36 min to form this 18.75-m-long stone column. The total volume of uncompacted stones consumed in forming the column is 11,350 liters or 11.35 m3. Since the column was terminated 2 m above the mud–sand fill interface, the total length of the stone column was about 9 m. Thus, the average diameter of the stone column formed is about 1050 mm, when compaction of the stones are also considered. When compacting the stones within the soft mud layer, the current consumed was about 90 A with a slight reduction as the depth decreased. However, a significant jump is seen when the stones and then the sand fill are compacted in the sand fill layer. The photograph in Fig. 23.9 shows the installation of stone columns in progress.
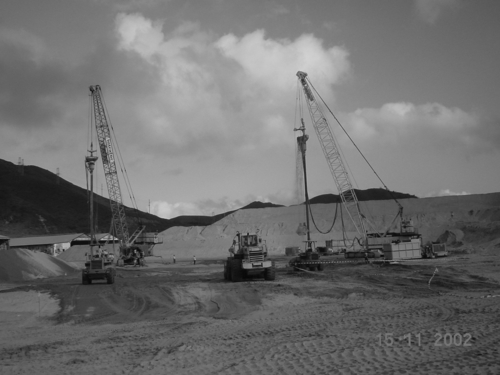
After installing the stone columns at the required spacing, the monitoring instruments were installed and the sand fill was placed to raise the ground level to a few meters above the formation level. Vibrocompaction was carried out on the sand fill layer to densify it, as part of the ground treatment works under this contract, from the top of the stone columns to the final formation level (see Fig. 23.10). After completing the deep vibrocompaction work, the surcharge was placed. The surcharge height varied from ~ 10–12 m.

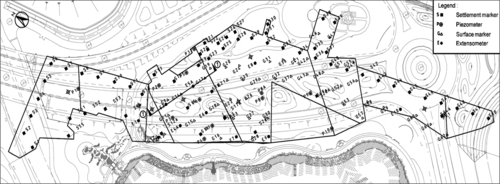
23.8 Instrumentation
The geotechnical field instruments installed to monitor the behavior of the treated ground comprised settlement plates that were installed close to the formation level before the surcharge was placed, spider magnet extensometers, vibrating wire piezometers, and ground settlement markers installed on top of the surcharge. The vibrating wire piezometers were installed within the marine mud layer between the stone columns. The instruments were monitored regularly, while the surcharge was in place but stopped when the surcharge was removed.
23.9 Behavior of the treated ground
23.9.1 General
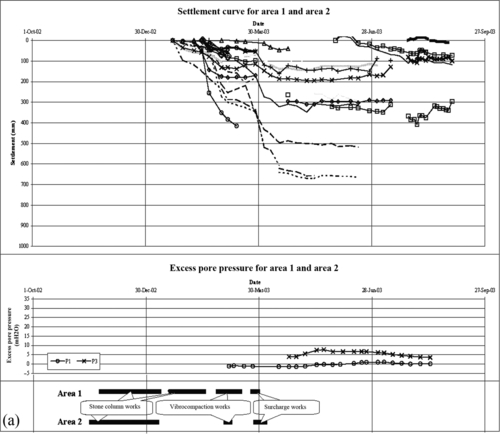
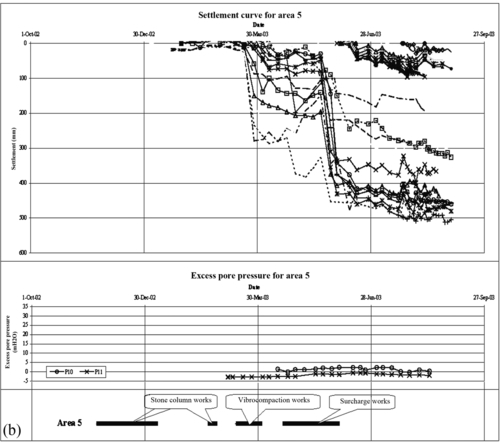
The ground settlement behavior and the piezometric regime of the treated ground were monitored regularly once the field instruments were in place. Therefore, the surface settlement markers recorded not only the consolidation settlement of the underlying strata but also the settlement of the fill as the fill layer was vibrocompacted. The spider magnet extensometers, with the magnets installed at different elevations, clearly indicate the soil layers that contributed to settlement. A typical extensometer plot is shown in Fig. 23.11. The ground settlement monitoring records along with the piezometer data from Areas 1 to 5 are presented in Figs. 23.12 and 23.13 and are discussed in the following subsections.


23.9.2 Settlement markers and piezometers
Areas 1 and 2
The total settlement measured from the surface settlement markers ranged from ~ 80–670 mm. Some of the early settlement markers indicate a sudden settlement of as much as 250–300 mm, which was due to deep vibrocompaction of the fill layer. Smaller settlements were recorded at the markers that were installed later, after the vibrocompaction works. The surcharge fill was placed between March 26 and 30, 2003, in Area 1 and the settlements increased with the additional fill and continued to settle until early June 2003. Consolidation appears to have been substantially complete within about 2 months of completing the surcharge. The piezometer P1 installed in the Area 1 did not record any excess pore pressure increase as the tip was located adjacent to a sand layer. A 4 m water head increase was recorded in piezometer P3, which dissipated in about 3 months (i.e., by mid-August 2003).
Area 3
The total settlement measured ranged from 800–1250 mm, which included the settlement due to vibrocompaction. The larger settlement compared to Area 1 was due to the greater marine mud thickness of up to ~ 10 m in the area. Because the vibrocompaction work continued until mid-May 2003, the initial settlements include the consolidation settlement and those due to densification of the sand fill. The placement of the surcharge was completed on May 10, 2003 and the increased rates of settlement seen on the settlement curves between late April 2003 and May 10, 2003 was due to the placement of the final surcharge. However, by the end of August 2003 (i.e., after ~ 3.5 months), the rates of settlements had substantially reduced, indicating that consolidation of the underlying compressible mud was substantially complete.
Analysis based on the Asaoka method indicated that the degree of consolidation achieved ranged from 98–100% in 3.5 months. All piezometers recorded increases in pore pressure ranging from 1–17.5 m in head (meters of water), with the largest being recorded at piezometer P2. A 10 m rise in head was recorded at P6. All piezometers recorded a steady and a rapid dissipation of the excess pore pressures within a period of 3.5 months. The varying pore pressure responses may be due to the stress increase at the piezometer tip locations, the drainage characteristics at and in the vicinity of the piezometer tips, and the different rates of placement of the surcharge fill.
Area 4
The total settlements measured ranged from 600–1200 mm, including settlement due to the densification of the sand fill. The formation fill was placed after completing the stone columns and the vibrocompaction was carried out between March 13 and 31, 2003. The initial rapid settlement recorded appears to be due to the initial consolidation and densification of the sand fill. The surcharge was placed between April 11, 2003 and May 10, 2003, and a sharp increase in the rate of settlement was evident during this period. The piezometers in this area did not record a sharp rise, but only about 2 m increase in head at piezometer P8, which reduced by 1 m by mid-July 2003. The settlement curves indicate that the settlements had stabilized by late July 2003; that is, after about 2.5 months of placing the surcharge. The piezometers did not indicate any excess pore pressures, possibly owing to the drainage characteristics at the tip locations.
Area 5
The total settlements in this area ranged from about 20–500 mm with substantial settlements of up to 300 mm occurring during vibrocompaction of the fill, when vibrocompaction work was carried out between mid-March 2003 and April 1, 2003. A further sharp increase in the settlement occurred when the surcharge was placed between April 19, 2003 and June 1, 2003. This settlement, which was due predominantly to the consolidation of the underlying compressible layers, appears to stabilize by late July 2003 (i.e., within ~ 2 months of placing the surcharge). A small consolidation settlement under surcharge and a faster rate of consolidation was expected in this area because the mud was thinner (ranging from 0 to ~ 5 m). The piezometers did not indicate any excess pore pressures, possibly due to the drainage characteristics at the tip locations.
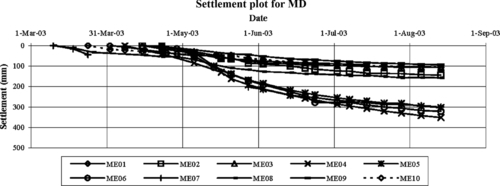
23.9.3 Spider magnet extensometers
The settlement–time plot of the composite marine mud-stone column layer was determined from the extensometer results by taking the difference in the settlements of the spider magnets placed at the top and bottom of the marine mud layers. These settlement curves are shown in Fig. 23.14. The total settlement monitored by the extensometers between March 2003 and mid-August 2003 ranged from 100–350 mm, with the settlement curves clearly indicating the settlement response to placing the surcharge between the end of April 2003 and mid-May 2003.
23.10 Method of analysis of settlements prior to surcharge removal
The settlement-versus-time curves were analyzed using Asaoka’s method to determine the degree of consolidation before a decision was made to remove the surcharge.
23.10.1 Asaoka’s method
Asaoka’s method (1978) is based on the assumption that the primary consolidation settlements follow an exponential curve of the form:
where S∞ is the ultimate primary settlement, S0 the initial settlement, S(t) the settlement at time t, and c the factor depending on the drainage paths (horizontal and vertical) and the coefficients of vertical and horizontal consolidation (cv and ch, respectively).
However, if the initial settlement is set to zero, ![]() . Thus, Eq. (23.1) reduces to,
. Thus, Eq. (23.1) reduces to,
It can be shown that the factor c in Eqs. (23.1) and (23.2) is related to the coefficients of vertical and horizontal consolidation, cv and ch. Using Carillo’s (1942) theory to combine the vertical and radial consolidation theories developed by Terzaghi (1943) and Barron (1948), respectively, it can be shown that
where D is the diameter of the influence zone of each stone column and
where n = D/d with d being the diameter of the stone columns.
Asaoka’s method consists of plotting the settlement Sn + 1 recorded at time (t + Δt) versus the settlement Sn recorded at time t, where the settlement curve is subdivided into discreet but equal time steps of time Δt. Typically, and for a constant loading, the settlements should tend to stabilize with time, thus the difference between Sn + 1 and Sn should reduce with time. The theoretical Sn + 1 versus Sn plot is shown to be a straight line with a slope gradient of β < 1. Consequently, as settlements increase with time, the plot of Sn + 1 versus Sn + 1 tends closer to the 45° line on the Sn + 1 versus Sn plot, and the best fit line through the Sn + 1 versus Sn plot ultimately crosses the 45° line. The ultimate primary settlement S∞ can then be read at this intersection. Furthermore, the slope gradient β of Asaoka’s plot is related to the factor c of the negative exponential settlement curve as follows:

where Δt is the time interval chosen for the plot and β the gradient of the Asaoka curve on Sn + 1 versus Sn plot
It should be noted that c is independent of Δt (when a high value is chosen for Δt, then β is smaller, thus Ln(β) is smaller and − Ln(β) is greater, and the ratio c remains constant). Consequently, Asaoka’s method provides all the parameters (S∞ and c) needed to solve the equation S(t) = S∞(1 − e− ct), and the primary consolidation settlement curve can be derived from the analysis. Because the ultimate settlement can be established from this method, the degree of consolidation at any given time t can be determined from the simple ratio, as follows:

where U(t) is the degree of consolidation at time t.
23.10.2 Reliability and limitations of Asaoka’s method
It is important to note that no assumption has to be made regarding soil parameters or even the geology (thickness of soil strata) to use this method. It is purely an observational approach based on settlement monitoring records. The only assumption needed for this method is that the settlements follow a negative exponential curve of the form just described. However, Asaoka’s method, as any other method based on observations, has limitations and the most important is the accuracy of available data. It should also be pointed out that this method is not reliable if the actual degree of consolidation is less than about 60%. Thus, the method should not be applied at the early stages of the consolidation process.
23.10.3 Determination of ch(field) using Asaoka’s method
Combining Asaoka’s method and the consolidation theories, it is possible to derive a coefficient of horizontal consolidation ch, using previous Eq. (23.3), that is applicable to the actual conditions in the field; and this parameter can be defined as ch(field), a value that is back-calculated from the parameter c determined from Asaoka’s plot. However, for that purpose, the following parameters must be known: cv coefficient of vertical consolidation, which can be obtained from standard oedometer vertical consolidation tests carried out in the laboratory, cv(lab), and the vertical drainage length, H, which is also known as the ground conditions are known from site investigation data.
Therefore, the field coefficient of horizontal consolidation that is determined from this method is a global field measurement of the coefficient of horizontal consolidation, which will be affected by the disturbance caused to the ground by the process of installing the stone columns, the smear effects if any, the local drainage paths created by the installation of the stone columns, the permeability of the stone/mud interface, and the vertical drainage capability and capacity of the stone columns. Thus, Eq. (23.3) can be restated as follows, using the specific parameters that will be used, and those that will be derived from it:
where ch(field) is the field coefficient of horizontal consolidation, and cv(lab) the coefficient of vertical consolidation determined from laboratory tests.
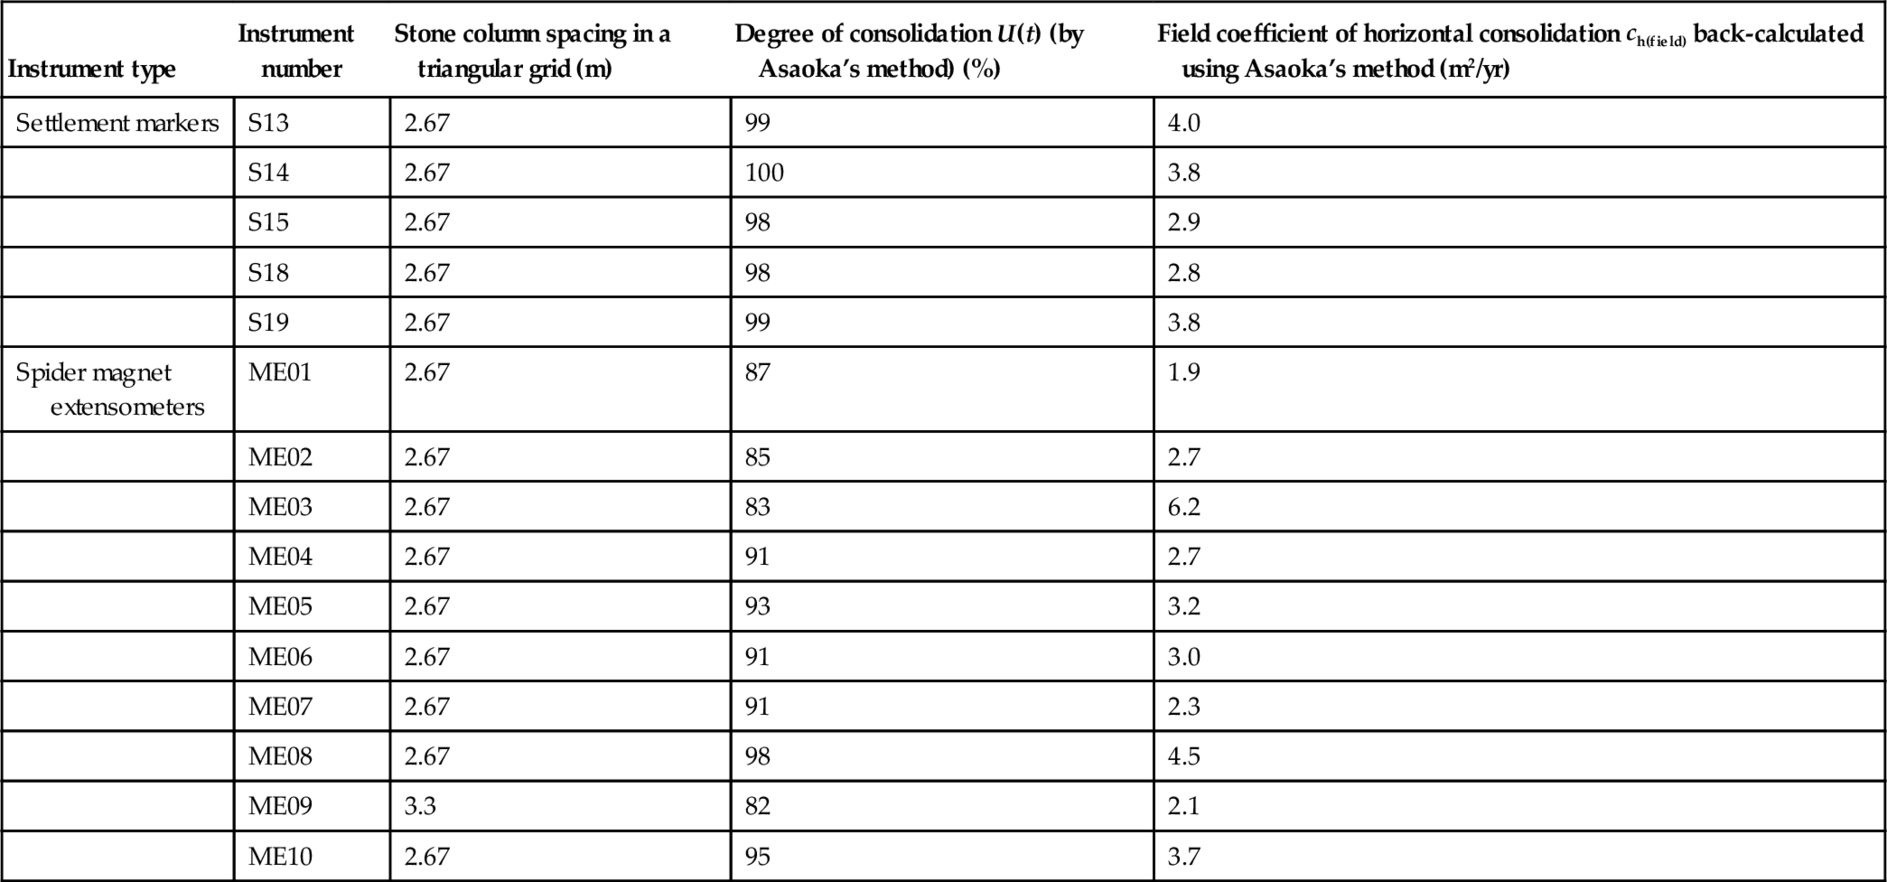
Asaoka’s method was used to analyze the settlement curves to determine the overall degree of consolidation under the surcharge load. The decision to remove the surcharge was based on these degrees of consolidation and the rates of settlements. In addition, the field coefficients of horizontal consolidations, ch(field), were also determined, or back-calculated using the approach just detailed. These results are presented in Table 23.2 and are discussed in the following section.
Table 23.2
Field coefficients of horizontal consolidation ch(field) back-calculated using Asaoka’s method
| Instrument type | Instrument number | Stone column spacing in a triangular grid (m) | Degree of consolidation U(t) (by Asaoka’s method) (%) | Field coefficient of horizontal consolidation ch(field) back-calculated using Asaoka’s method (m2/yr) |
| Settlement markers | S13 | 2.67 | 99 | 4.0 |
| S14 | 2.67 | 100 | 3.8 | |
| S15 | 2.67 | 98 | 2.9 | |
| S18 | 2.67 | 98 | 2.8 | |
| S19 | 2.67 | 99 | 3.8 | |
| Spider magnet extensometers | ME01 | 2.67 | 87 | 1.9 |
| ME02 | 2.67 | 85 | 2.7 | |
| ME03 | 2.67 | 83 | 6.2 | |
| ME04 | 2.67 | 91 | 2.7 | |
| ME05 | 2.67 | 93 | 3.2 | |
| ME06 | 2.67 | 91 | 3.0 | |
| ME07 | 2.67 | 91 | 2.3 | |
| ME08 | 2.67 | 98 | 4.5 | |
| ME09 | 3.3 | 82 | 2.1 | |
| ME10 | 2.67 | 95 | 3.7 |
23.11 Discussion
The monitoring results indicated that the consolidation of the soft muds, as demonstrated by the settlement, extensometer, and the piezometer monitoring data were satisfactory and in broad agreement with the assumptions and assessments carried out at the design stage. At the design stage it was expected that the required degree of consolidation of 70–80% under the surcharge would be achieved within 2–2.5 months; whereas in practice, 85–100% consolidation under the full surcharge load was achieved within 2–3.5 months of placing the surcharge. Therefore, the rate of consolidation appears to be faster than that estimated at the design stage. However, the design calculations did not take into account the consolidation that will be taking place while the stone columns are being installed and while the surcharge load was being placed.
The piezometers also indicated rapid dissipation of the excess pore pressures. Some of the piezometers did not register the required increase in the pore pressure, as the surcharge was placed. This was probably the result of placing or installing the piezometer tips too close to the stone columns. Though it was attempted to install the piezometers centrally between the stone columns, due to the tolerances of the verticality of the stone columns and the piezometer installation, and the variability of the stone column diameter, the piezometer tips could be up too close to the stone columns.
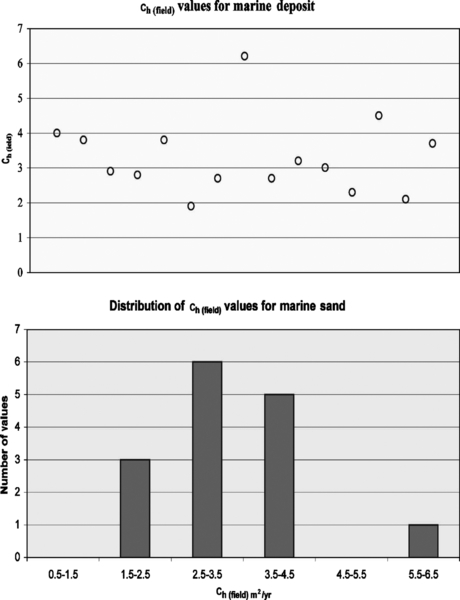
23.11.1 Determination of the field coefficient of horizontal consolidation ch(field)
When the field coefficients of horizontal consolidation, ch(field), were back-calculated (see Table 23.2) from the settlement curves of the settlement markers and the settlement of the marine mud layers (from extensometer results) using the approach detailed earlier, values ranging from 1.9–6.2 m2/yr were obtained for the marine mud with an average value of 3.3 m2/yr (see Fig. 23.15); whereas the laboratory determined vertical coefficient of consolidation cv(lab) was about 1 m2/yr. Even though the mud surrounding the stone column was significantly disturbed and remolded during the process of installing them as a result of “liquefaction” of the soft mud initially under the vibroflot, and then the lateral dilation of the hole (or the cavity expansion) under the action of compaction of the stones to create the 1-m-diameter columns, ch(field) values that are about 1.9–6.2 times larger (with an average of 3.3 times) than the cv(lab) value were obtained.
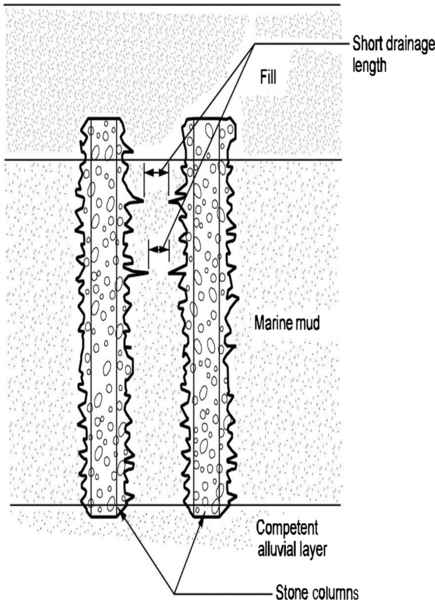
This could be due to the undulating column size (fluctuations of the column diameter) resulting in much shorter drainage paths between the columns that contribute to rapid dissipation of the excess pore pressure and thus consolidation of the mud. The substantial drainage capacity provided by the stone columns would also have facilitated the dissipation process. The rapid consolidation of the mud is then reflected in the settlement curves of the marine mud, which then corresponds to a higher equivalent ch value, or more appropriately, the ch(field) value. These ch(field) values are thus a reflection of the behavior of the treated composite ground and it is not an intrinsic material property of the in situ mud.
23.12 Conclusion
Given the tight construction program at Penny’s Bay, the time available for the treatment of the soft marine muds underlying the nondredged reclamation areas, which ranged from ~ 2 m to ~ 10 m, was very limited. In addition, after ground treatment, it was essential that the treated ground satisfied the stringent residual settlement criteria stipulated by the client, the Hong Kong International Theme Parks.
Therefore, it was decided to treat and improve the soft muds, and limit the future residual settlement of the ground by installing stone columns and surcharging the area, even though the method had not been tried previously in Hong Kong. Thus, 1-m-diameter stone columns at spacings of 2.5, 2.67, and 3.3 m were installed in a triangular grid pattern within the area needing ground treatment. The stone columns were installed using the “dry” bottom feed method with ground penetration being achieved by ground “liquefaction” and water jetting with the aid of a vibroflot. A surcharge, 10–12 m high was placed on the area treated with stone columns. The sand fill layer between the stone columns and the formation level was also vibrocompacted.
The ground monitoring results indicated very satisfactory behavior of the treated ground with the required consolidation being reached within 2–3.5 months and the settlement analyses proved that the future settlements would meet the stipulated residual settlement criteria; permitting the removal of the surcharge and the handover of the area as scheduled.
Back-analyses of the settlement data indicated that the field coefficients of horizontal consolidation, ch(field), of the treated ground ranged from ~ 1.9–6.2 m2/yr, with an average value of 3.3 m2/yr (i.e., between 1.9 and 6.2 times greater than the coefficient of vertical consolidation cv(lab) determined from standard 1D oedometer tests). The favorable overall horizontal permeability of the ground, and thus the higher field coefficients of consolidation, ch(field), may be due to the isolated shorter drainage paths created by the variable column diameter (Fig. 23.16) and the drainage provided by the large stone column.
It should be pointed out that these values of ch(field) are a function of the ground conditions and the method of installation of the ground treatment measures, which could differ from one site to another. It is recommended that field trials are conducted to establish these parameters before they are adopted in any other major project. It should also be pointed out that the marine mud had partially consolidated under the reclamation fill and the consistency of the mud could be generally described as firm with isolated locations of stiff mud.
Notation
S∞ = ultimate primary settlement
S0 = ultimate primary settlement
S(t) = settlement at time t
c = factor depending on the drainage paths (horizontal and vertical) and the coefficients of vertical and horizontal consolidation (cv and ch, respectively)
D = diameter of the influence zone of each stone column
d = diameter of the stone columns
Δt = time interval chosen for the plot
β = gradient of the Asaoka curve on Sn + 1 versus Sn plot
ch = intrinsic coefficient horizontal consolidation of marine mud
cv = intrinsic coefficient vertical of consolidation of marine mud
ch(field) = field coefficient of horizontal consolidation
cv(lab) = coefficient of vertical consolidation determined from laboratory tests