

IBM Navigator for i 7.1
This chapter introduces the following enhancements for IBM Navigator for i:
17.1 New name: IBM Navigator for i
The interface that was previously known as IBM Systems Director Navigator for IBM i underwent a significant transformation and now has tremendous usability and performance enhancements. Its new name is IBM Navigator for i.
|
Note: IBM Navigator for i is the strategic application for IBM i administration tasks. New administration tasks are supported only by the web application and will no longer be added to the System i Navigator Windows client application.
|
17.1.1 IBM i functions available on the IBM Navigator for i
Most of the functions, including plug-ins, are available through the web interface (IBM Navigator for i) and Windows client interface (System i Navigator), with the following exceptions:
•Available tasks: The following tasks are only available in IBM Navigator for i:
– Performance Data Investigator (PDI)
– PowerHA
– Clustering resource services
– Internet configuration
• IBM Web Administration for i: Allows you to manage and configure HTTP servers and application servers.
• Digital Certificate Manager: Allows you to create, distribute, and manage digital certificates.
– IBM IPP Server for i: Allows you to configure the IBM IPP server.
•Unavailable tasks: The following tasks are not available within IBM Navigator for i:
– Run SQL scripts
– Visual Explain
– Database Navigator maps
– SQL assist
– AFP manager
•Available plug-ins to IBM Navigator for i:
– IBM Advanced Job Scheduler for the System i server
– Backup Recovery and Media Services (BRMS)
– Performance Tools for System i
– System i High Availability Solutions Manager (5761-HAS)
– DB2 Content Manager OnDemand for System i
– Lotus Domino for System i servers
|
Cluster Resource Services plug-in: The Cluster Resource Services plug-in for System i Navigator from the High Availability Switchable Resources licensed program (IBM i option 41) was removed in IBM i 7.1.
|
For more information, see the IBM Navigator for i website:
17.1.2 IBM Navigator for i requirements
IBM Navigator for i is installed as part of the IBM i operating system. It is part of SS1 option 3.
The following list of IBM i license programs is recommended to use with IBM Navigator for i:
The following list of IBM i license programs is recommended to use with IBM Navigator for i:
•5770SS1 option 1, Extended Base Support
•5770SS1 option 3, Extended Base Directory Support
•5770SS1 option 12, Host Servers
•5770SS1 option 30, Qshell
•5770SS1 option 33, Portable App Solutions Environment
•5770DG1 value *BASE, IBM HTTP Server for i
•5761JV1 value *BASE, IBM Developer Kit for Java
•5761JV1 option 8, J2SE 5.0 32 bit
The actual PTFs are all packaged and delivered as part of the HTTP PTF group. In addition, a number of other PTF groups are required to ensure that all parts of the IBM Navigator for i interface function properly:
•SF99368 level 18, HTTP Server group
•SF99145 level 4, Performance Tools group
•SF99701 level 22, Database Group PTF
•SF99572 level 12, Java Group PTF
For the most current list of required PTFs for IBM Navigator for i, see the following website:
|
Internet configuration tasks: Using IBM Navigator for i to perform Internet configuration tasks using the Internet Configurations option requires additional IBM i installed licensed programs and PTFS. This is a similar requirement to IBM i Access for Web. For more information, see 18.5.1, “Requirements for using IBM i Access for Web” on page 829.
|
17.1.3 Signing on to IBM Navigator for i
You can access the IBM Navigator for i interface by typing in the URL address field of your browser:
http://systemname:2001
A sign-on window is displayed as shown in Figure 17-1.
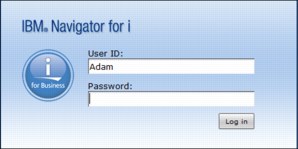
Figure 17-1 IBM Navigator for i sign-on window
If your password is expired, you can update the password on the IBM Navigator for i sign-on window, as shown in Figure 17-2.

Figure 17-2 IBM Navigator for i expired password
After you sign on, the Welcome window opens, as shown in Figure 17-3.
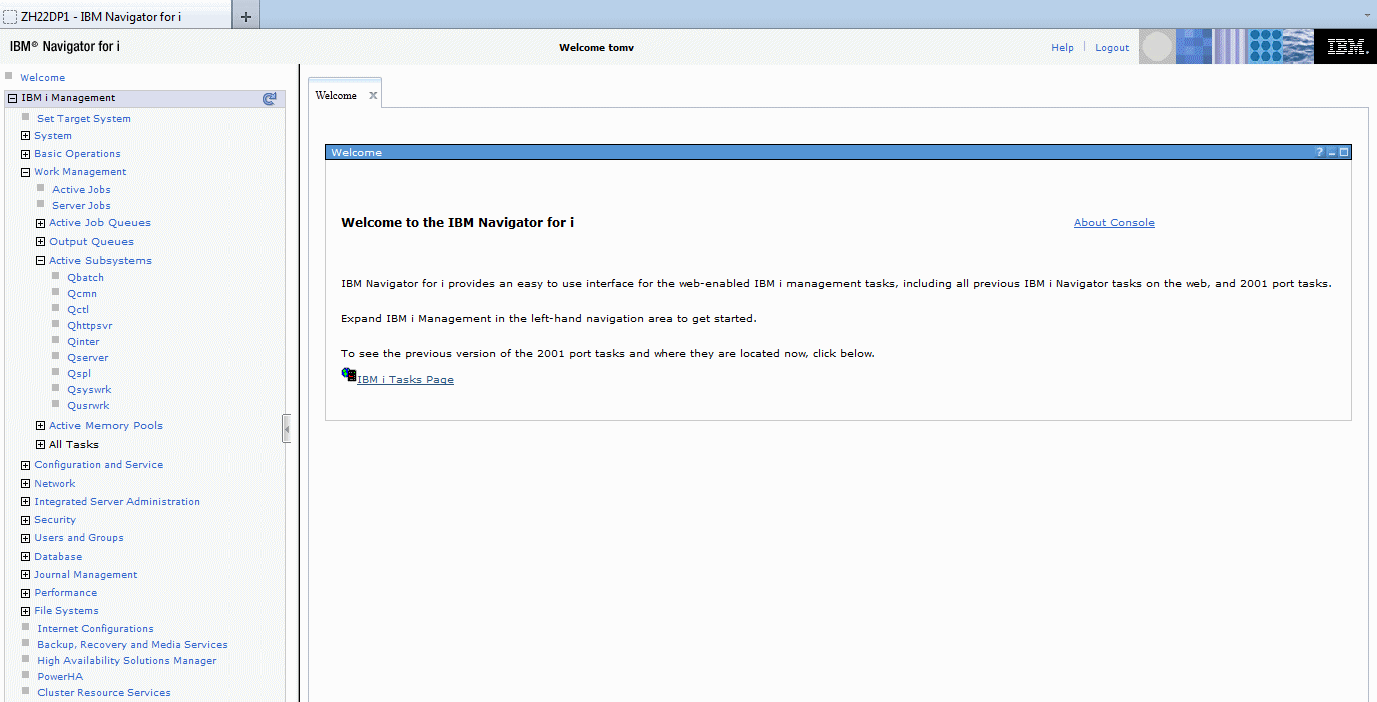
Figure 17-3 IBM Navigator for i Welcome page
17.2 Dynamic navigation
With IBM Navigator for i, you have a quick and dynamic navigation vehicle with performance and usability that is similar to the IBM i Navigator client environment, but without the need to do an installation or do any management on the client side.
The containers open quickly, and you can reach endpoints with fewer clicks. It is also possible to dynamically update the content by clicking the Reload icon as shown in Figure 17-4.
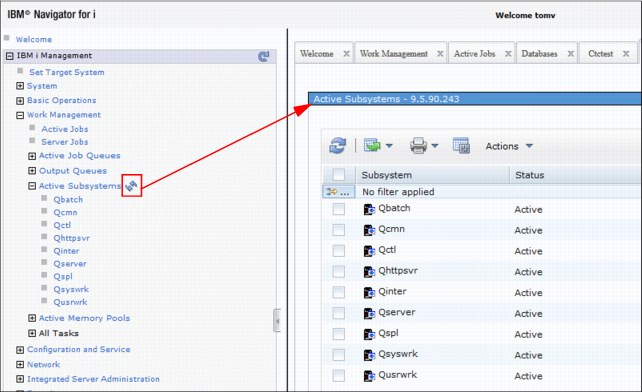
Figure 17-4 Dynamic navigation and update
Previously, the left navigation was a static list with only core functionality enabled. Now the interface has dynamic navigation, making the left frame a true navigation area.
17.3 Independent tabs
Because there are independent tabs that have their page contents cached, you can quickly switch back and forth between tabs without a refresh on the server side. You can also open a tab in a new window, as shown in Figure 17-5. Right-click the Active Jobs tab and click Open in a new window. A new browser window opens and displays the Active Jobs.

Figure 17-5 Active Jobs tab opening in a new window
17.3.1 Modern tables
IBM Navigator for i has the following new features that are related to tables and filters, as shown in Figure 17-6:
•Click column to sort.
•Right-click any row to display a list of functions.
•Fast filtering (by selecting the quick filter option).
•Hover on any row to see details.
•Select how many entries to show.
•Fast path to the page you want to see.
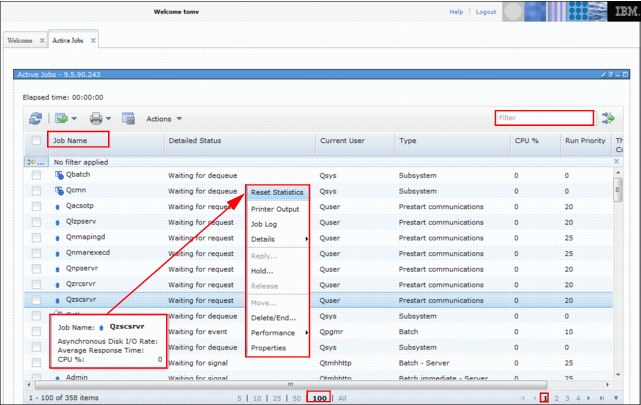
Figure 17-6 Enhancements to tables and filters
|
Note: Do not press Enter when you use the Quick filter option, as the window updates automatically when you enter the filtering argument. If you press Enter, you discard the search argument and do not get the correct output.
|
17.4 5250 emulation-related enhancements
You can now access the same 5250 emulation portlet that is included with IBM i Access for Web by using the System option within IBM i management in IBM Navigator for i, as shown in Figure 17-7. This option makes it easier to use a single interface for managing IBM i systems and partitions.

Figure 17-7 5250 emulation using the System option in IBM i management
However, as you can see in Figure 17-8, you cannot customize the 5250 emulation portlet from within the IBM Navigator for i console.

Figure 17-8 IBM Navigator for i 5250 emulation session
17.5 Set target system enhancements
IBM Navigator for i is enhanced so that you can work with multiple systems from a single interface using the Set Target System feature. You can manage an IBM i system or partition by selecting the target system. After this system or partition is selected, all data that are returned to the IBM Navigator for i interface is for this system or partition.
IBM Navigator for i can manage a target IBM i 6.1, or 7.1 system or partition. The options that are available on that target partition or system can vary depending on the IBM i release that is on that target system or partition.
As shown in Figure 17-9, click the Set Target System task in the task navigation area to specify the system or partition to be managed. Select the system or partition name, the corresponding user ID and password, and click OK.
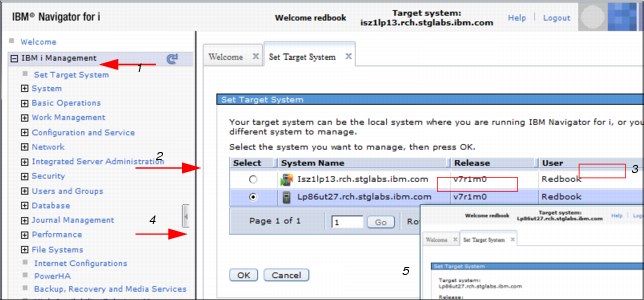
Figure 17-9 Setting the target system to manage another system or partition
The example in Figure 17-9 shows IBM Navigator for i on a IBM i 7.1 system and shows that the select target system selection changed to another system IBM i 7.1.
With the Set Target System feature, the IBM Navigator for i management server runs in one place. One single browser can be used to manage multiple environments and management is extended to previous IBM i environments.
17.6 Database enhancements
This section describes the following database enhancements:
Other database enhancements are discussed in other various locations in this book:
•QSYS2.SYSLIMITS in 5.5.15, “Tracking important system limits” on page 270
•Plan Cache properties, “Job scope plan metrics” on page 262 and “Greater insight and control” on page 263
17.6.1 On Demand Performance Center enhancements
This section describes the following enhancements:
New centralized authority model
Support is added in IBM i 7.1 for a centralized authority model that is used when you work with all the SQL performance tools.
Previously, a system security officer needed to grant the *JOBCTL user special authority so that database analysts and database administrators could use the database tools. Because the *JOBCTL authority allows a user to change many system critical settings that are unrelated to database activity, it was not an easy decision for security officers to grant this authority. In certain cases, *JOBCTL was not granted to database analysts, thus prohibiting the usage of the full set of database tools.
In IBM i 7.1, the security officer can authorize access to the database analysis tools, and the SQL Plan Cache. DB2 for i takes advantage of the function usage capability available in the operating system.
A function usage group that is called QIBM_DB was created. In IBM i 7.1, there are four function IDs in the QIBM_DB group:
•QIBM_DB_SQLADM (IBM i Database Administrator tasks)
•QIBM_DB_SYSMON (IBM i Database Information tasks)
•QIBM_DB_DDMDRDA (DDM and DRDA Application Server Access)
•QIBM_DB_ZDA (Toolbox Application Server Access)
The security officer can grant authorities by using either of the following methods:
•Granting *JOBCTL special authority
•Authorizing a user or group to the IBM i Database Administrator Function through Application Administration in IBM Navigator for i
To authorize a user or group within IBM Navigator for i, complete the following steps, as shown in Figure 17-10:
1. Expand IBM i Management.
2. Click the System category.
3. Click Application Administration.
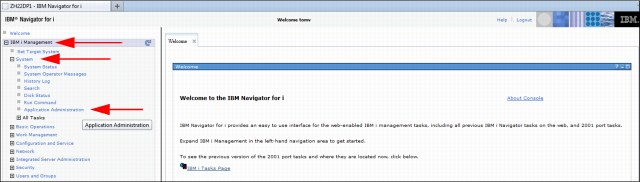
Figure 17-10 Application Administration
In the Application Administration window, complete the following steps, as shown in Figure 17-11:
1. Click Host Applications on the left side menu.
2. Expand IBM i.
3. Expand Database.
4. Click Customize from the menu to the right of Database Administrator.
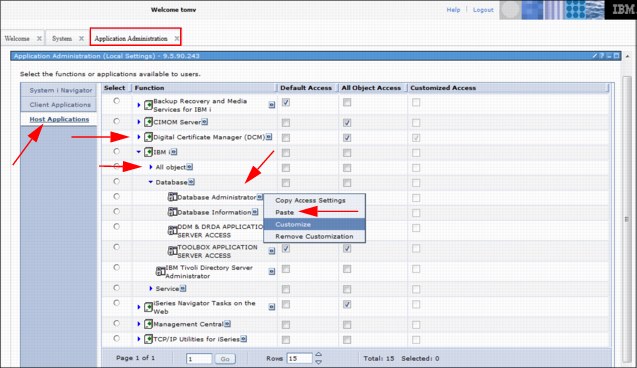
Figure 17-11 Database Administrator - Customize
You can customize the access to the Database Administrator functions, as shown in Figure 17-12.
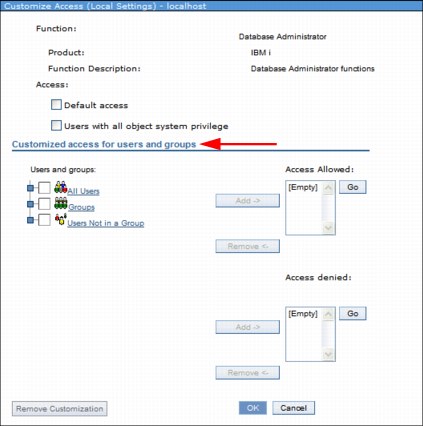
Figure 17-12 Customizing access
|
Tip: You can use the Change Function Usage (CHGFCNUSG) command, with a function ID of QIBM_DB_SQLADM, to change the list of users that are allowed to perform database administration operations. The function usage controls which groups or specific users are allowed or denied authority. The CHGFCNUSG command also has a parameter (ALLOBJAUT(*USED)) that can be used to grant function usage authority to any user who has *ALLOBJ user special authority.
|
The access customization configuration for the database administration operations can also be performed in a similar way for database information-related operations. The same is true for the DDM and DRDA Application Server Access and the Toolbox Application Server Access.
Enhanced filtering support
There are more filters for the SQL performance monitors. The new filters include the client registers filters that are shown in Figure 17-13. They allow even more granularity to help reduce the amount of data collected.

Figure 17-13 Filter the database monitor collection
SQL performance monitor enhancement
SQL Details for a Job can start a SQL Performance Monitor from the jobs list. You can select Start SQL Performance Monitor from the Select Action menu on the SQL Details for Jobs window, as shown in Figure 17-14.
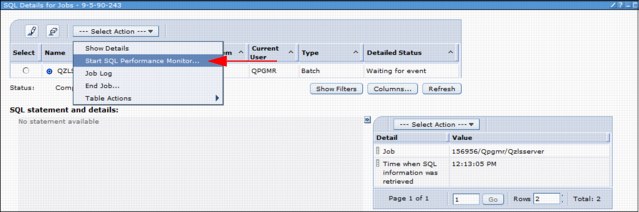
Figure 17-14 Start SQL Performance Monitor from SQL details for a job
Enhancements to Index Advisor and the indexes list
Within IBM Navigator for i, there are several enhancements to Index Advisor and the indexes list.
Index Advisor enhancements
IBM Navigator for i has the following maintained temporary index (MTI) information within the Index Advisor, which is shown in Figure 17-15:
•First Advised
Date / time when a row is first added to the Index Advisor table for this advice.
•MTI Created
Number of times that this specific MTI was created by the optimizer. MTIs do not persist across system IPLs.
•MTI Used
Number of times that this specific MTI was used by the optimizer.
•MTI Last used
The time stamp that represents the last time this specific MTI was used by the optimizer to improve the performance of a query. This field can be blank, indicating that an MTI that exactly matches this advice was never used by the queries that generated this index advice.
•MTI Used for Statistics
The number of times that this specific MTI was used by the optimizer for statistics.
•MTI Last Used for Statistics
The time stamp that represents the last time that this specific MTI was used by the optimizer to obtain statistics for a query.

Figure 17-15 Index Advisor - MTI information
Indexes list enhancements
The indexes list includes information for the last time the index was built, as shown in Figure 17-16.

Figure 17-16 Last built index information
The indexes list also includes columns for SSD (Media Preference) and Keep In Memory values, as shown in Figure 17-17.

Figure 17-17 Index columns for SSD and Keep In Memory values
For more information related to the DB2 Media Preference, see 8.4.1, “DB2 media preference” on page 411.
|
Tip: You might need to add the columns so that they show up, as they are not displayed by default. Select the Columns option in the Actions menu to add those columns.
|
17.6.2 Health center enhancements
Figure 17-18 shows an example where an SQL0901 category was added to the Environmental Limits tab, which helps to log situations where the database engine has an unknown error and more data must be collected.

Figure 17-18 SQL0901 category added to the Environmental Limits tab
Random and sequential I/O counts are collected and displayed in the Activity tab, as shown in Figure 17-19.
|
Sequential reads: The sequential reads are available on the next page of the Activity tab.
|
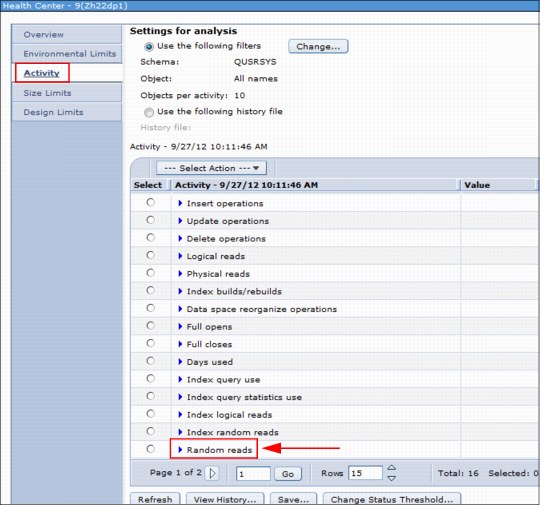
Figure 17-19 Activity tab - random and sequential reads
17.6.3 Database management enhancements
Support was added in IBM i 7.1 for the following new database features:
XML Data type column support
Support is now available for XML Data type column within the IBM Navigator for i interface, as shown in Figure 17-20.

Figure 17-20 XML Data type column support
For more information related to this support, see 5.2.1, “XML support” on page 161.
XML schema repository
An XML schema repository (XSR) was introduced to store information about an XML schema to allow for document validation or decomposition (shredding).
With IBM i 7.1, support was added for listing and working with XSRs. However, there is no support to create an XSR using this IBM Navigator for i interface.
Global variables
Support is available for global variables within the IBM Navigator for i interface, as shown in Figure 17-21.
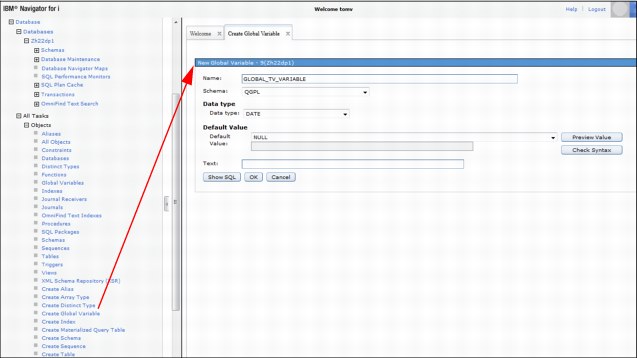
Figure 17-21 Global variable support
For more information related to global variables, see 5.2.4, “Creating and using global variables” on page 169.
Array support
Figure 17-22 shows the support that is available for array types within the IBM Navigator for i interface.
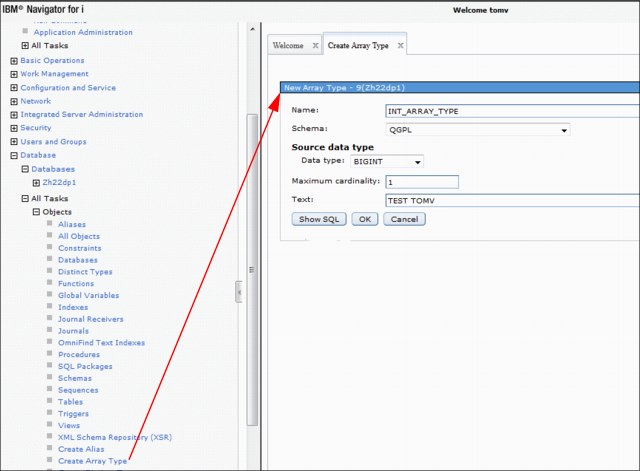
Figure 17-22 Array type support
For more information related to array support, see 5.2.5, “Support for arrays in procedures” on page 170.
FIELDPROC support
IBM i 7.1 has FIELDPROC support at the column level. To use this support, select the Implements Field procedure option when you define the column when you create or alter a table. As shown in Figure 17-23, specify the schema and the corresponding procedure name.

Figure 17-23 FIELDPROC column support
For more information related to FIELDPROC support, see 5.2.7, “FIELDPROC support for encoding and encryption” on page 174.
Three-part names support
Figure 17-24 shows an example of how to define a three-part alias by referencing a table on a remote system. The corresponding SQL statement is also displayed.
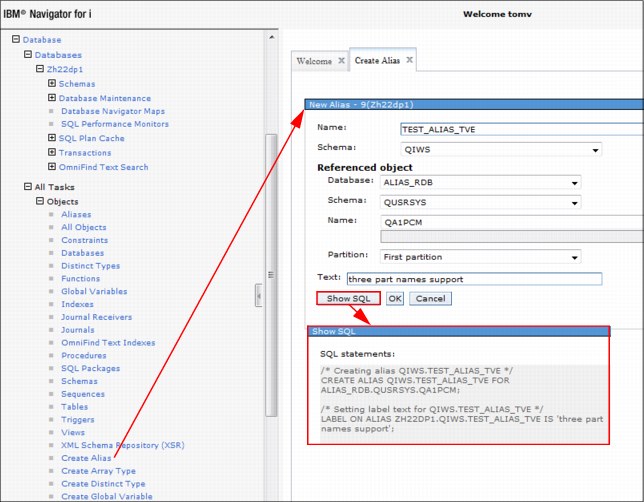
Figure 17-24 Three-part name support for an alias
|
Support availability: This support is available for a table, a view, or an alias.
|
Procedure creation and definition
You can create and define a procedure from within the Actions menu, as shown in Figure 17-25.

Figure 17-25 New procedure
There are two options available:
•SQL procedure
•External procedure
|
New menu option: There is also a new menu option called “New based on...”, which you can use to build a similar procedure from an existing one.
|
Function creation and definition
It is possible to create a function from within the Actions menu, as shown in Figure 17-26.

Figure 17-26 Create function
There are three options available:
•Sourced
•SQL
•External
Viewing and editing table contents
You can view and edit table contents from within the Actions menu, as shown in Figure 17-27.
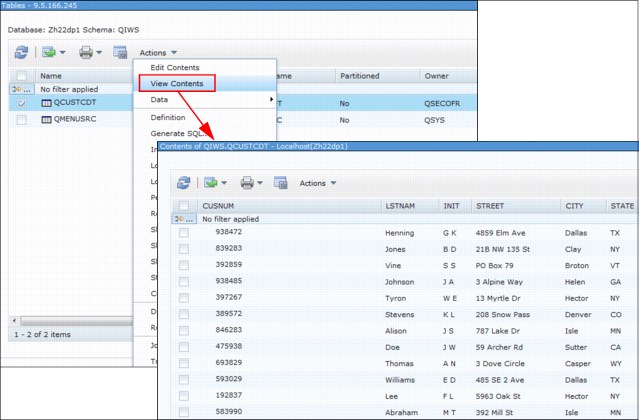
Figure 17-27 View and edit table contents
SQL privilege statements
Generate SQL supports the option to include SQL privilege statements. This output option is on by default, as shown in Figure 17-28.
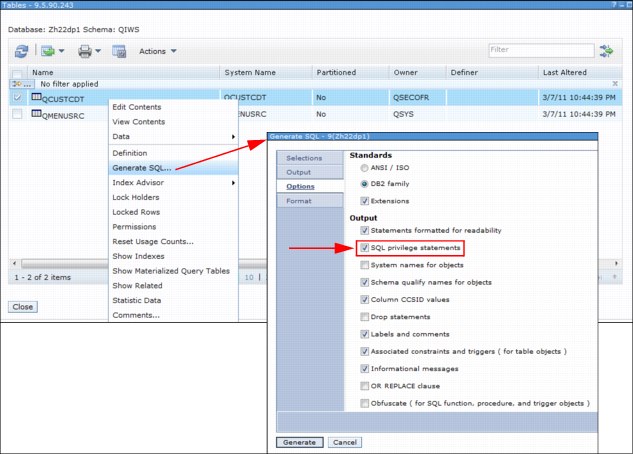
Figure 17-28 Generate SQL - including SQL privileges
Several usability enhancements
In IBM i 7.1, it is possible to save list contents to various output formats. In Figure 17-29, the list contents of all schemas within the database is saved into a comma-separated value file within the IFS of the system.
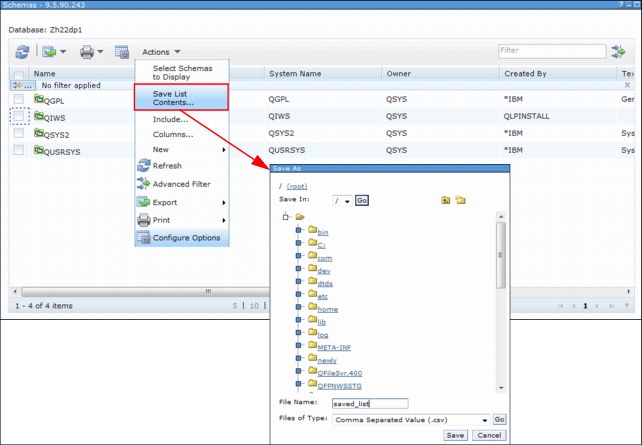
Figure 17-29 Save list contents
Figure 17-30 shows an example where it is specified that, from the list of procedures within a library, only those containing a specific text string within their name are displayed.
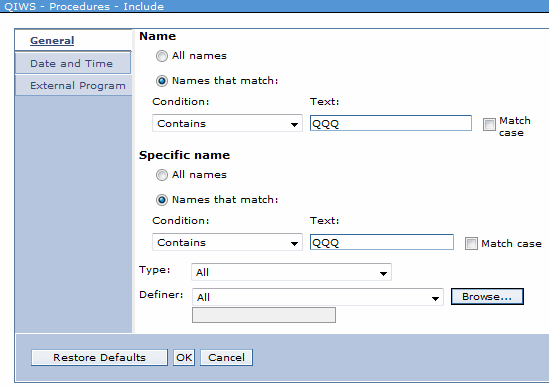
Figure 17-30 Include list support for procedures
|
List support: This list support is also available for Tables, Indexes, Aliases, Views, Functions, Triggers, Index Advice, Condensed Index Advice, SQL Plan Cache Snapshots, SQL Plan Cache Event Monitors, Schemas, Database Transactions, and Global Transactions.
|
17.6.4 Database Maintenance category enhancements
Figure 17-31 shows the new Database Maintenance category that you can use to organize database maintenance lists for table reorganizations, index builds, text search index builds, table alters, and check pending constraints.
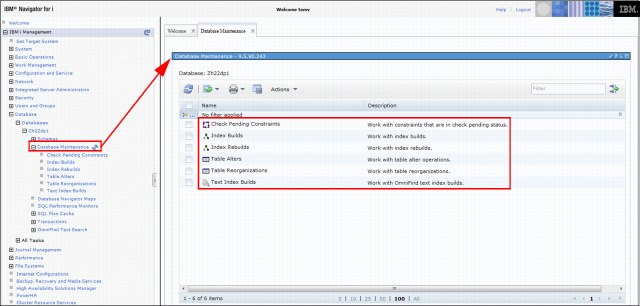
Figure 17-31 New maintenance category for database maintenance
Progress pages were added for index builds, text search index builds, and table alters. The window that is shown in Figure 17-32 shows the progress that occurs as the index is built.
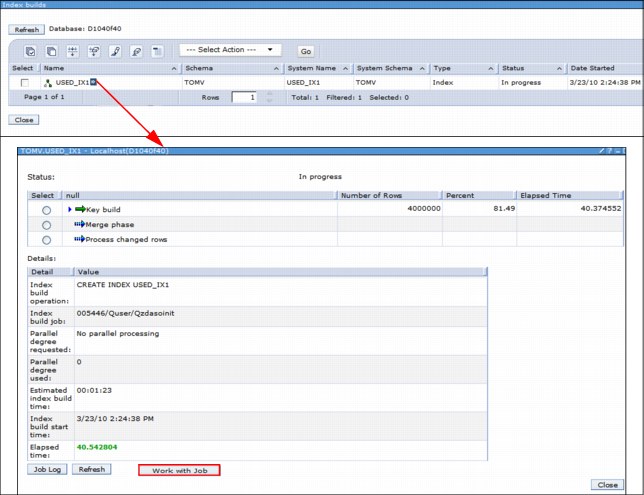
Figure 17-32 Progress page for index builds
|
Work with Job: From within this same interface, you can get to the corresponding job by clicking the Work with Job button.
|
In addition, history information is shown in the table reorganization progress window, as shown in Figure 17-33.
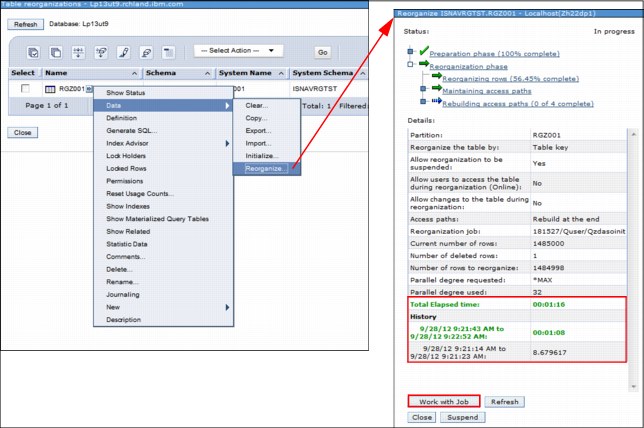
Figure 17-33 Table reorganization - history information
The Total Elapsed Time field shows the time of all the history entries plus the current entry. For example, if you start reorganizing a table, you see an entry in the history section for the current run. It is updated and shows in green.
If you choose to suspend that instance of the reorganization and resume it later, you see a row in the history section for the previous instance, and a new row for this instance.
The Total elapsed time value then includes both the previous instance of the reorganization, plus this current instance of the reorganization. The history applies to only the history of the reorganization for one instance of the reorganization of this table. It does not show the prior history of completed reorganizations of this table.
From within this same interface, you can now further drill down into the corresponding job by clicking the Work with Job button.
|
Improved functionality: The reorganize progress in releases before IBM i 7.1 required that you find the table and select to reorganize it to see whether it is being reorganized. This process is an easier way to accomplish the same task because the Table Reorganizations option in the Database Maintenance category is now available.
|
17.6.5 Long SQL schema names enhancements
Support for long schema names was added throughout the database pages to support the porting of database applications from other databases, and to support more descriptive schema names.
Figure 17-34 defines a new Long Schema Name within an IBM i 7.1 database.
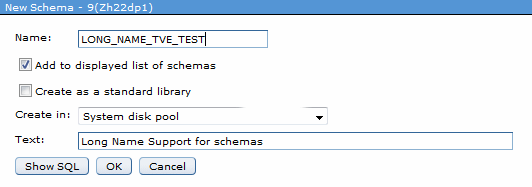
Figure 17-34 Long name support for schemas
17.6.6 OmniFind text search functions enhancements
OmniFind is a text search product that IBM i users can use to search through unstructured text that is stored in a column of a DB2 for i table. The text that is stored in the column can be either simple character text, an XML document, or any of several types of rich text documents, such as a PDF or a .doc file. You can use this product to index unstructured data without parsing it into a structured form, such as an SQL table.
Figure 17-35 shows the support that enables the management of OmniFind text search servers and indexes.

Figure 17-35 OmniFind text search support
The support for OmniFind text search in DB2 adds simpler access to non-structured data that is often stored in XML format.
For more information about OmniFind as a text search product, see 5.7, “OmniFind Text Search Server for DB2 for i (5733-OMF)” on page 285.
For more information, see the OmniFind Text Search Server for DB2 for i topic in the IBM i 7.1 Knowledge Center:
17.7 New journal management enhancements
You can now manage journal environments through IBM Navigator for i. Following is a list of the additional functions added to journal management in IBM i 7.1:
For more information related to journal management capabilities and enhancements, see 5.3, “Performance and query optimization” on page 189.
17.7.1 Show Journaled Objects function
The Show Journaled Objects function is added for a journal, as shown in Figure 17-36. This function displays the objects that are added to the journal, including files, data areas, data queues, libraries, and integrated file system objects.
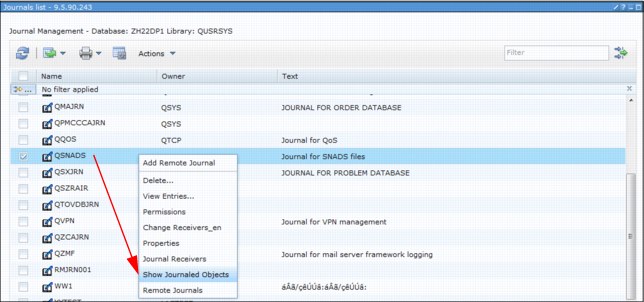
Figure 17-36 Showing journaled objects
17.7.2 Change Receivers function
The Change Receivers function is added for a journal, as shown in Figure 17-37. You can use this function to attach a new journal receiver to the journal and change the attributes of a journal, including the fixed-length data values, receiver maximum option, minimize options, and other options.
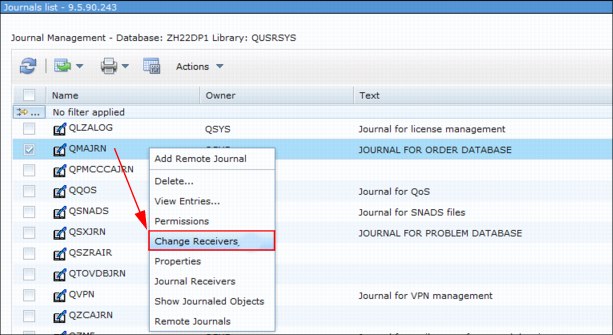
Figure 17-37 Changing receiver
17.7.3 Remote Journals function
The Remote Journals function is added for a journal, as shown in Figure 17-38. You can use this function to see a list of all the remote journals that are associated with a journal. Included in the list are the remote journal state and the delivery mode.
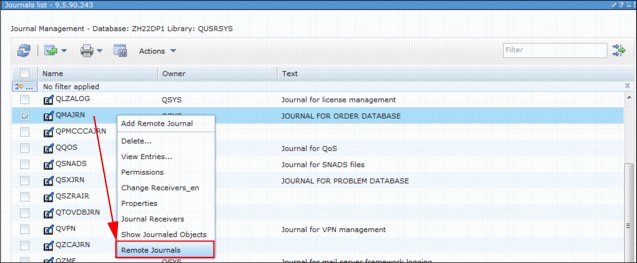
Figure 17-38 Remote journals related information
17.7.4 Add Remote Journal function
The Add Remote Journal function was added for a journal, as shown in Figure 17-39. You can use this function to define a remote journal environment.

Figure 17-39 Adding remote journal
17.7.5 Properties function
The Properties function was added for a journal receiver, as shown in Figure 17-40. You can use this function to view the attributes of a journal receiver. Included in the attributes are the sequence number of the first entry in the journal receiver, the minimize options, the fixed-length data options, and other options.
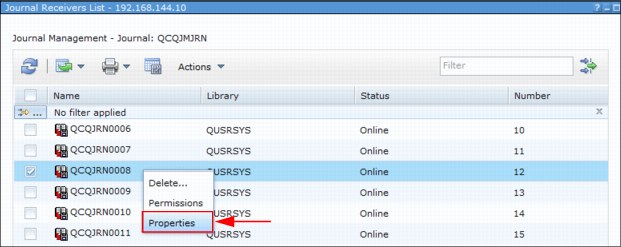
Figure 17-40 Properties action for a journal receiver
17.7.6 Activate function
The Activate function was added for remote journals, as shown in Figure 17-41. You can use this function to activate a remote journal and specify options.
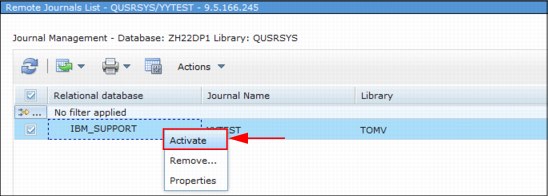
Figure 17-41 Activating a remote journal
17.7.7 Deactivate function
The Deactivate function was added for remote journals, as shown in Figure 17-42. You can use this function to deactivate a remote journal.

Figure 17-42 Deactivating a remote journal
17.7.8 Remove function
The Remove action was added for remote journals, as shown in Figure 17-43. You can use this function to remove a remote journal environment.

Figure 17-43 Removal of a remote journal
17.7.9 Properties function
The Properties function was added for remote journals, as shown in Figure 17-44. You can use this function to view the properties of a remote journal connection, which includes the delivery mode, remote journal type, connection statistics, and so on.
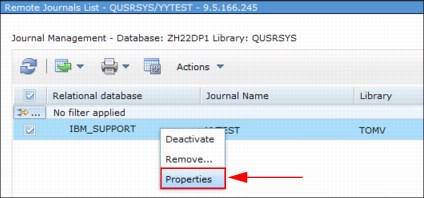
Figure 17-44 Properties for a remote journal
17.8 Integrated Server Administration enhancements
The following Integrated Server Administration topics were added to IBM Navigator for i in IBM i 7.1:
For more information related to Integrated Server Administration, see Chapter 11, “Integration with IBM BladeCenter and IBM System x” on page 479.
17.8.1 Create Server function
The Create Server function was added so that you can create the IBM i hosting environment for an iSCSI attached BladeCenter or System x server, as shown in Figure 17-45.
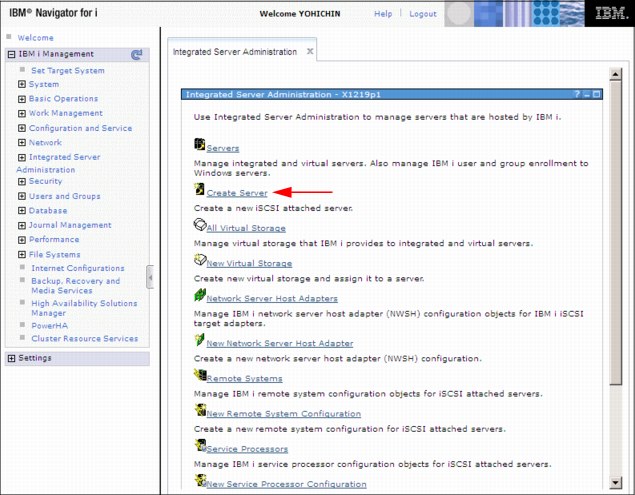
Figure 17-45 Creating a server task
The Create Server wizard starts. This function is described in more detail in 11.7.1, “Create Server task” on page 488.
17.8.2 Creating a server based on an existing server (cloning)
It is also possible to create a server that is based on an existing one. The New Based on option (cloning) is shown in Figure 17-46. It starts the Create Server wizard and creates an iSCSI-attached integrated Windows server that is based on one that was previously installed.

Figure 17-46 New Based On option (cloning) a server task
17.8.3 Delete Server function
The Delete Server function was added for deleting the IBM i hosting environment for an integrated server, as shown in Figure 17-47.

Figure 17-47 Deleting a server
17.8.4 Launch Web Console function
The Launch Web Console function was added for launching the service processor web console for an iSCSI attached integrated server, as shown in Figure 17-48.
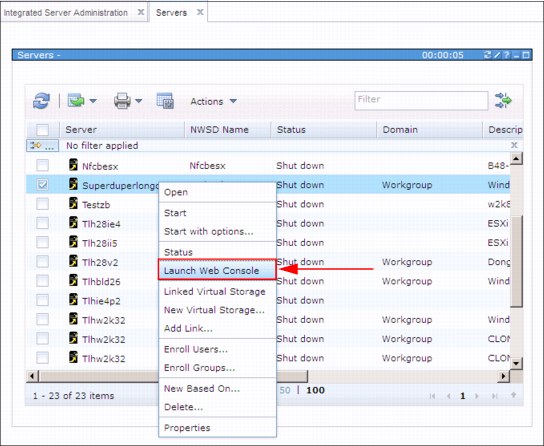
Figure 17-48 Launching the web console
Starting with IBM i 7.1, several iSCSI configuration functions were simplified. For more information about these functions, see 11.7, “IBM Navigator for i” on page 488.
17.9 Printer output enhancements
In IBM i 7.1, new functions were added to the View as PDF and Export as PDF functions.
17.9.1 View as PDF function
The View as PDF function was added so that you can view an AFPDS or SCS printer output file, as shown in Figure 17-49. You can use this function to open and view the contents of a printer output file using Adobe Acrobat Reader.
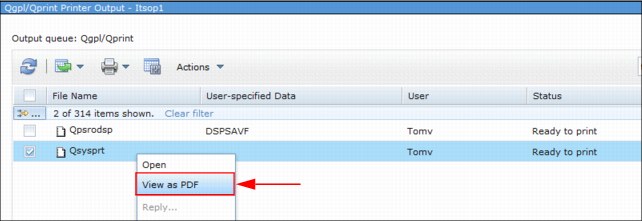
Figure 17-49 Printer output - View as PDF
17.9.2 Export as PDF function
The Export as PDF function was added to export an AFPDS or SCS printer output file, as shown in Figure 17-50.
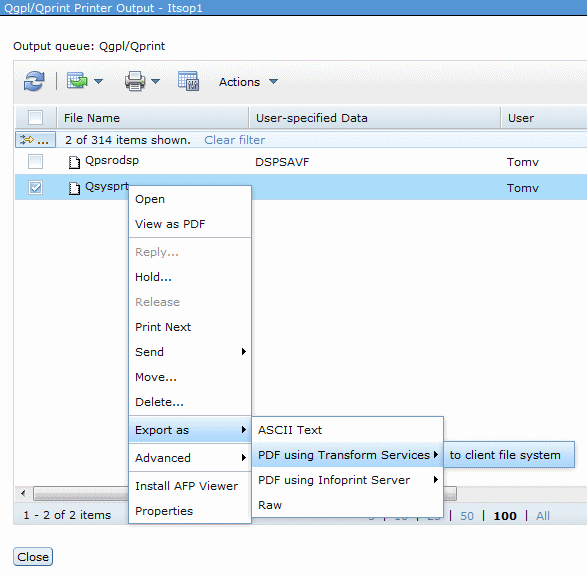
Figure 17-50 Printer output - Export as PDF
You can use the Export as PDF function to save the contents of a printer output file to the following sources:
•Your client desktop or file system
•An output queue
•The Integrated File System (IFS)
•An attachment to an email
•If more spool files are selected, output can be saved to an archive file, see Figure 17-51.
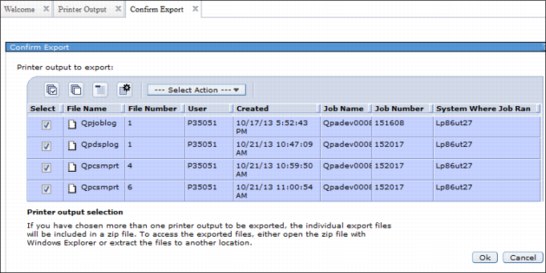
Figure 17-51 Export more spools to archive file
|
Requirement: For the last three options listed, the Infoprint Server licensed program 5722-IP1) is required. Users can use the native IBM Transform Services for i (5770-TS1) licensed program to export to the IFS, but they must map a network drive to the IFS and then select the first option, as shown in Figure 17-50 on page 713.
|
17.10 File system enhancements
Improvements have been made to the file system interface in the navigation area. The ability to drill down to find the content you are after quickly and easily is one of the most useful updates to the entire interface. If you click a folder in left navigation area, the content under that folder is shown in the right work area. You can then perform various operations on selected files or folders by right-clicking them.
In addition, a couple new features have been added:
•Editing a file. IBM Navigator for i now can do simple edits within the browser for some file types. When you right-click the file you want to edit in the right work area, the action menu is displayed. If the selected file is one that is editable, the Edit option is active. Select Edit and the selected file is displayed in a simple text editor. Make the updates that you require and save the document, or you can save the document as a new file.
Figure 17-52 shows editing a file.
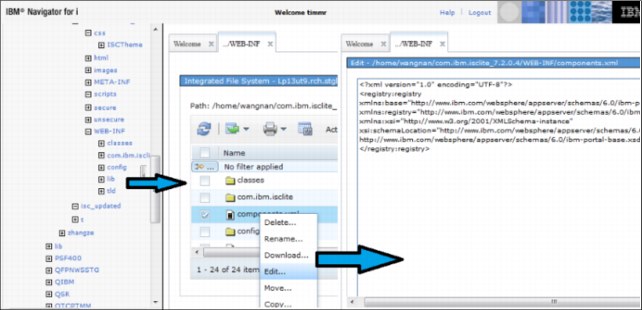
Figure 17-52 IFS editing a file
•Downloading and uploading files. One of the features that many clients like about the client Navigator is the ability to easily move files from your PC or network drivers to your IBM i file system. IBM Navigator for i now has two new functions. You can now download or upload files to your IBM i.
Right-click the file of choice, or you can highlight multiple files and right-click, to display the action list. Select Download and the download interface is shown with all the files that you have selected as shown in Figure 17-53. When you click the Download button, these selected files are downloaded to your PC. You can then determine where you want them to be located.

Figure 17-53 IFS download feature
Figure 17-54 shows the IFS upload feature.

Figure 17-54 IFS upload feature
•A temporary file system is supported. The temporary file system can be created by creating a user-defined file system (UDFS) by specifying .TMPUDFS= as the extension instead of the default .UDFS for the UDFS name field as shown in Figure 17-55.
For more information about temporary user-defined file system support, see 19.3, “Temporary user-defined file systems” on page 835.

Figure 17-55 Temporary UDFS creation
17.11 Networking enhancements
Internet Protocol version 6 (IPv6) is enabled for Remote Access Services as shown in Figure 17-56.
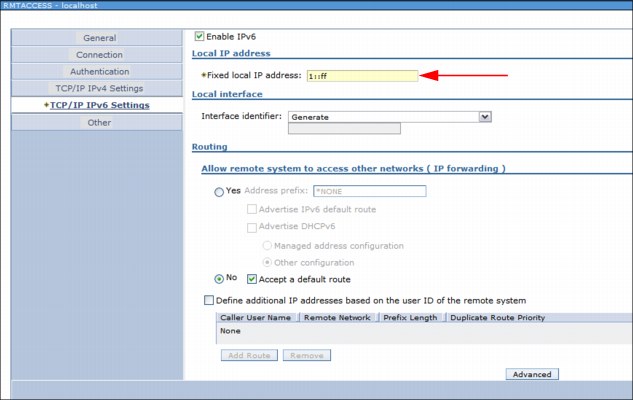
Figure 17-56 IPv6 support for remote access services
IKE version 2 is enabled for VPN, as shown in Figure 17-57.
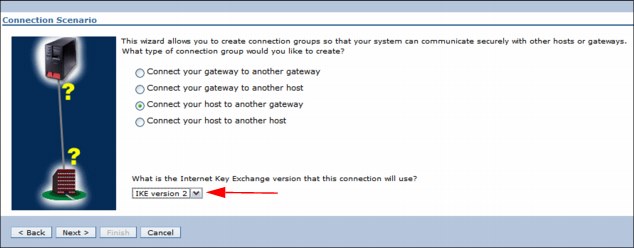
Figure 17-57 Internet key exchange V2 enablement for VPN
For more information related to networking enhancements in IBM i 7.1, see Chapter 9, “Networking enhancements” on page 425.
17.12 Disk management enhancements
There are several enhancements within IBM Navigator for i within IBM i 7.1 that are related to disk management:
|
Tip: You must follow these procedures before you can perform any disk management tasks using IBM Navigator for i or System i Navigator. For more information, see the Requirements for disk management topic in the IBM i 7.1 Knowledge Center:
|
17.12.1 Graphical view enhancements
To access the graphical view, complete the following steps:
1. From the IBM Navigator for i Welcome window (Figure 17-3 on page 674), click Configuration and Service → Disk Units.
2. Access to the Disk Unit function requires you to log in to system service tools (SST) as shown in Figure 17-58.
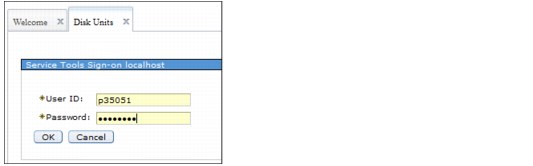
Figure 17-58 Logging in to system service tools
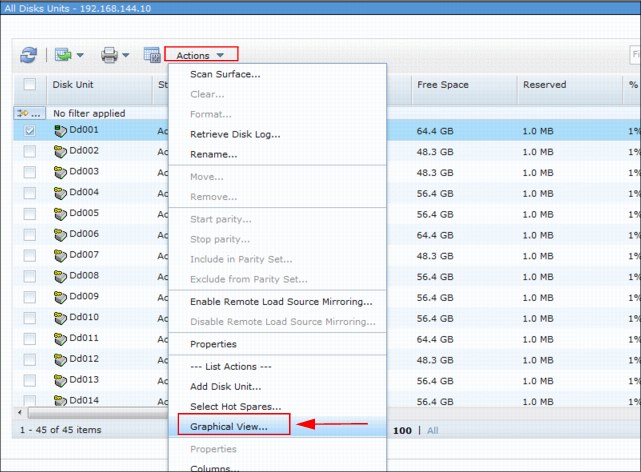
Figure 17-59 Disk Units - Graphical View menu
4. The Disk Units graphical view opens as shown in Figure 17-60.
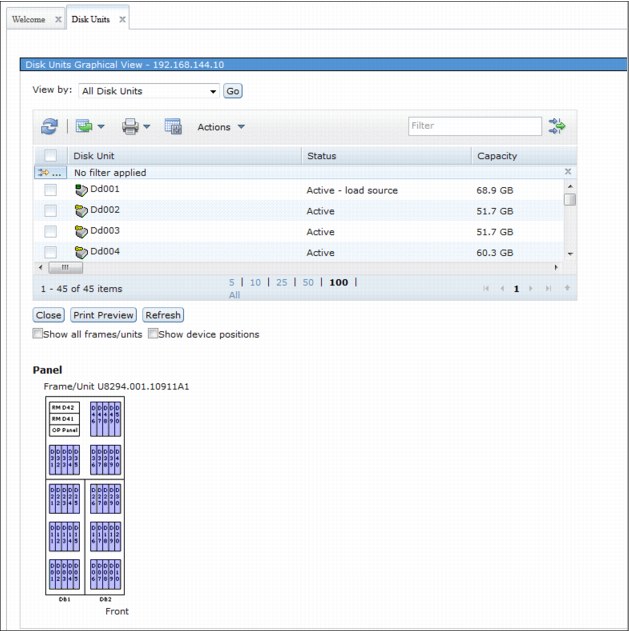
Figure 17-60 Disk Units graphical view
17.12.2 Start and stop encryption on disk pools enhancements
The Start / Stop encryption on disk pools feature is now enabled within IBM Navigator for i. You can use a change encryption key when the encryption starts as shown in Figure 17-61.
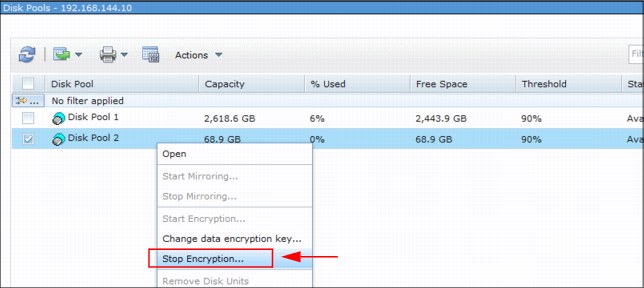
Figure 17-61 Disk management - Start / Stop encryption
17.12.3 Asynchronous delivery for Geographic Mirroring enhancements
IBM Navigator for i also provides asynchronous communications between the source and target servers for geographic mirroring, as shown in Figure 17-62.
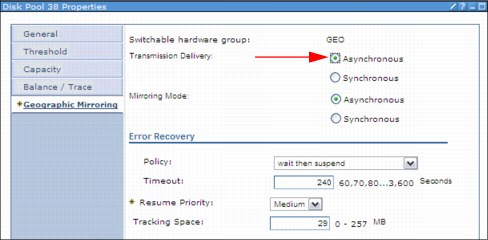
Figure 17-62 Asynchronous delivery mode
For more information related to asynchronous transmission delivery for geographic mirroring, see 4.1.6, “Asynchronous geographic mirroring” on page 135.
17.13 Rebuild data on failed disk unit in parity set
IBM Navigator for i has added a rebuild data action for the disk units list. This action provides the user the ability to rebuild data on failed disk units that belong to a failed parity set and also allows the user to easily recover from the failure.
This function is similar to the Work with Disk Unit Recovery function to rebuild device parity disk unit data. The rebuild function is now part of the web navigator interface. Figure 17-63 illustrates the rebuild data on failed disk unit in parity set.

Figure 17-63 New action of rebuild data
Figure 17-64 shows confirming the rebuild.
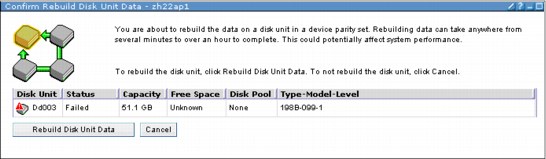
Figure 17-64 Rebuild data on a disk unit confirmation window
Figure 17-65 shows the rebuild status.
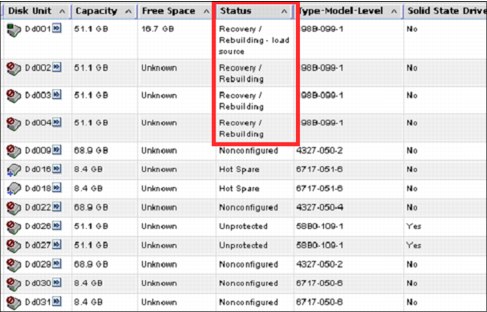
Figure 17-65 Status of the rebuild process
17.14 Creating a logical partition with IBM Navigator for i
Virtual Partition Manager provides the capability to create and manage Linux or IBM i partitions without the use of the Hardware Management Console (HMC). Virtual Partition Manager supports the needs of small and medium customers who want to add simple Linux or IBM i workloads to their server. In addition, they can isolate Linux and IBM i workloads into separate partitions.
The Virtual Partition Manager supports environments with a hosting IBM i partition and up to four client Linux or IBM i partitions. The hosting IBM i partition must own and manage all of the I/O resources. The logical partition uses virtual I/O to access disk, tape, DVD, and Ethernet resources that are owned by the hosting partition.
|
Assigning physical I/O resources: Assignment of physical I/O resources to client partitions and dynamic movement of virtual I/O resources is not supported. You must power off the client partition to move the virtual I/O resources. Memory and processor resources can be added or removed when the partition is powered on, but that requires an IPL to take effect.
|
|
HMC consideration: You cannot use Virtual Partition Manager on an IBM i server that is configured using an HMC. This means that you must disconnect your IBM i server from the HMC before you can use the Virtual Partition Manager. You can only use Virtual Partition Manager on the hosting IBM i partition. PowerVM Standard or Enterprise edition is required to support four client partitions.
|
IBM Navigator for i provides a graphical interface for Virtual Partition Manager. This function requires IBM i 7.1 Technology Refresh 6 and PTFs SI48848 and SI49568.
To create a logical partition using IBM Navigator for i, complete these steps:
1. From the IBM Navigator for i navigation area, select Configuration and Services → All Tasks → Partition Management → Create Partition. From the Partitions window, select Create Partition as shown in Figure 17-66.
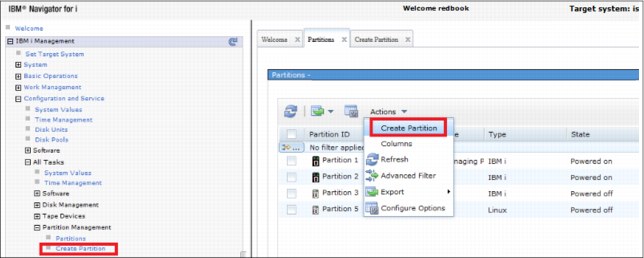
Figure 17-66 Navigator for i, Partition Management, Partitions
2. Follow the Create Partition wizard instructions, which create an IBM i or Linux partition as shown in Figure 17-67.
The Create Partition function associates virtual Ethernet connections between client partitions and the hosting partition. This association is done by specifying the same VLAN ID for virtual Ethernet adapters in both the client and hosting partitions.
IBM Navigator for i also creates and associates the required network server description (NWSD) and network storage space (NWSSTG) objects in the hosting partition. There are several options for implementing virtual Ethernet. For more information, see the following publications:
– Virtual Partition Manager A Guide to Planning and Implementation, REDP-4013, Chapter 6 “Establishing Network Connectivity for Linux Partitions” shows the proxy ARP method.
– Creating IBM i Client Partitions Using Virtual Partition Manager, REDP-4806, section entitled “Ethernet Layer-2 Bridging” shows how to set up layer-2 bridging.
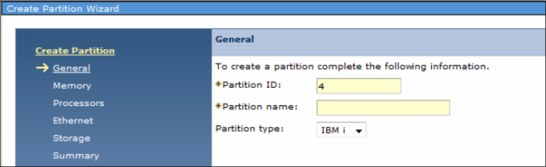
Figure 17-67 Navigator for i, Create Partition wizard
3. The last step of creating logical partition is to install operating system on your logical partition.
17.15 Tape support enhancements
To access the new Tape Devices option, in the IBM Navigator for i Welcome window, click Configuration and Service then select All Tasks, shown in Figure 17-68.
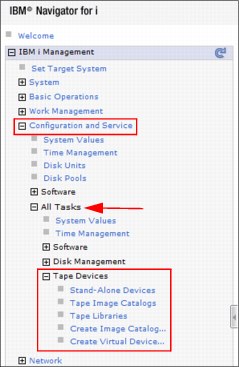
Figure 17-68 Selecting tape device options
In the Tape Devices menu, you have the following options available:
•Stand-Alone Devices offers the following possibilities:
– Make (un)available
– Look into the properties
– Upgrade the firmware
•Tape Image Catalogs offers the following possibilities:
– Add or list volumes
– Look at the properties
•Tape Libraries offers the following possibilities:
– Make (un)available
– Look into the properties
•Create Image Catalog
•Create Virtual Device
17.16 Performance enhancements
When discussing the performance enhancements within IBM Navigator for i, it is assumed that the IBM HTTP Server for i 7.1 Group PTF (SF99368) is installed on your system. More information is available on the Preventive Service Planning website:
Figure 17-69 shows the IBM Navigator for i interface that is used to work with performance-related tasks within IBM i 7.1.

Figure 17-69 Performance tasks within IBM Navigator for i
Several enhancements were made to the Performance Data Investigator (PDI), which can be accessed by selecting the Investigate Data task, shown in Figure 17-70.
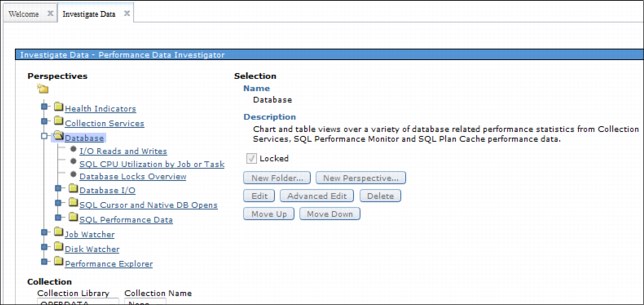
Figure 17-70 Investigate Data option
17.16.1 General health indicators
This content package helps a system administrator, an IBM i performance specialist, or a general user learn whether the partition is performing properly from a general performance management perspective or if areas of the system need to be investigated.
Main system resources and components (such as processor, DASD, and memory) and communications are analyzed. The results are displayed graphically. The main source of data for analysis is the Collection Services performance data files.
The new content package, which deals with the general health of your partition, is shown in Figure 17-71.

Figure 17-71 Health indicators
The following subsets of information are now available:
System Resources Health Indicators
You can use this perspective to determine the general health of the main system resources according to the defined thresholds. Figure 17-72 shows health indicators for CPU, Disk, Memory, and communications for the entire selected collection.
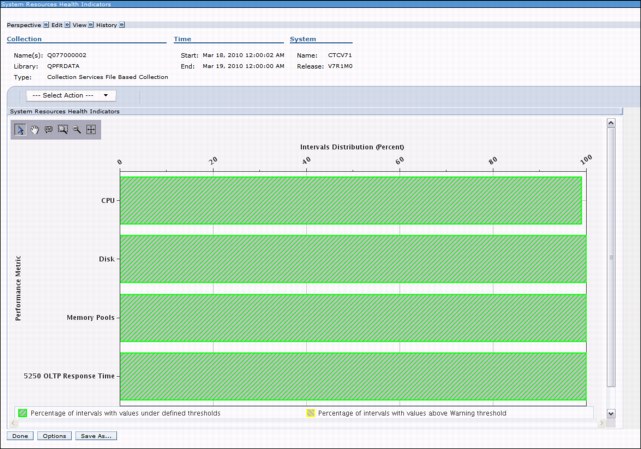
Figure 17-72 System Resources Health Indicators
You can use this perspective to quickly determine the percentage of intervals that exceeded the various defined thresholds for CPU, Disk, Memory Pools, and Response Time.
From the System Resources Health Indicators perspective, you can open the following new perspectives:
•CPU Health Indicators
•Disk Health Indicators
•Memory Pools Health Indicators
•Response Time Health Indicators
Each of these perspectives consists of key metrics that are associated with the system resource that is being investigated. The perspectives are available through the Actions menu, as shown in Figure 17-73, and are described in more detail in the following sections.
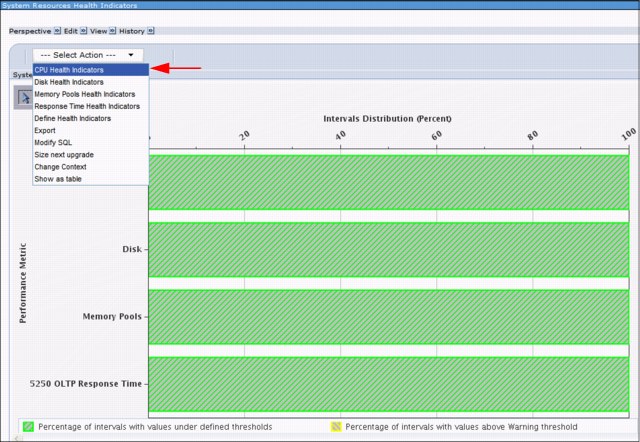
Figure 17-73 System Resources Health Indicators menu
CPU Health Indicators
You can use this perspective to determine the proportion of intervals where processor health indicators exceeded the defined thresholds. The chart in Figure 17-74 shows you processor health indicators by analyzing all collection time intervals according to the defined thresholds for processors.
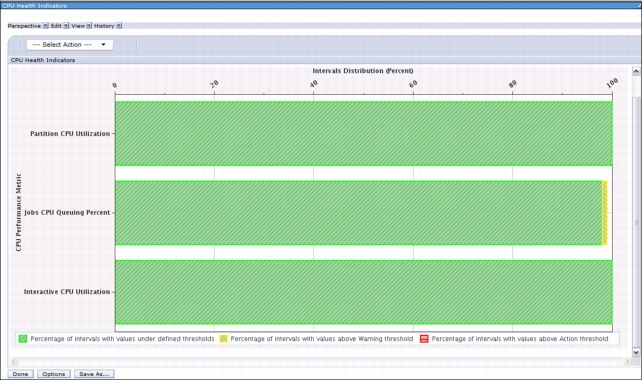
Figure 17-74 CPU Health Indicators
From the CPU Health Indicators perspective, you can open the following perspectives:
•CPU Utilization and Waits Overview
•CPU Utilization Overview
•Interactive Capacity CPU Utilization
At the top of the CPU Utilization and Waits Overview window, you can click View−> Show System Information to get the system-related information displayed in the heading of the window, as shown in Figure 17-75.

Figure 17-75 Show System Information
Disk Health Indicators
The perspective in Figure 17-76 shows disk health indicators by analyzing all collection time intervals according to the defined thresholds for the disk. This chart can be used to determine the proportion of intervals where the disk health indicators exceeded the defined thresholds.
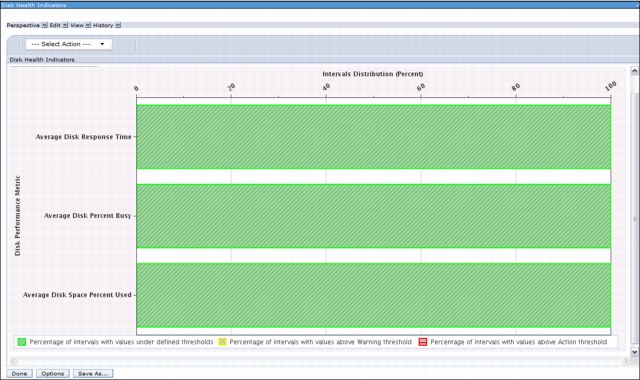
Figure 17-76 Disk Health Indicators
From the Disk Health Indicators perspective, you can open the following perspectives:
•Resource Utilization Overview
•Disk Overview by Disk Pools
•Disk Details by Disk Pools
Memory Pools Health Indicators
The perspective in Figure 17-77 shows memory pools health indicators by analyzing all collection time intervals according to the defined thresholds for memory pools. This chart can be used to determine the proportion of intervals where the memory pools health indicators exceeded the defined thresholds.
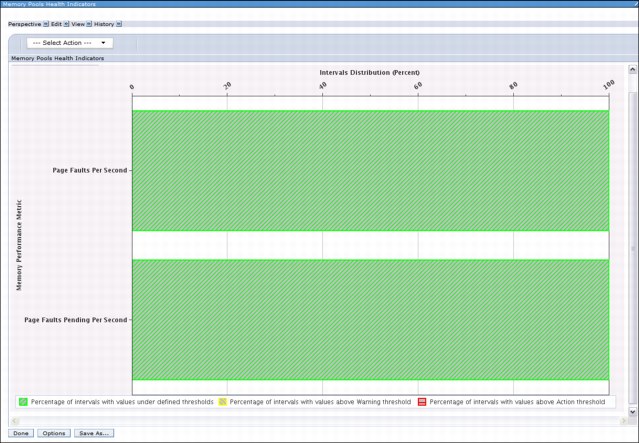
Figure 17-77 Memory Pools Health Indicators
From the Memory Pools Health Indicators perspective, you can open the following perspectives:
•Resource Utilization Overview
•Page Faults Overview
Response Time Health Indicators
Figure 17-78 shows response time health indicators by analyzing all collection time intervals according to the defined thresholds for response time. This chart can be used to determine the proportion of intervals where the response time exceeded the defined thresholds.
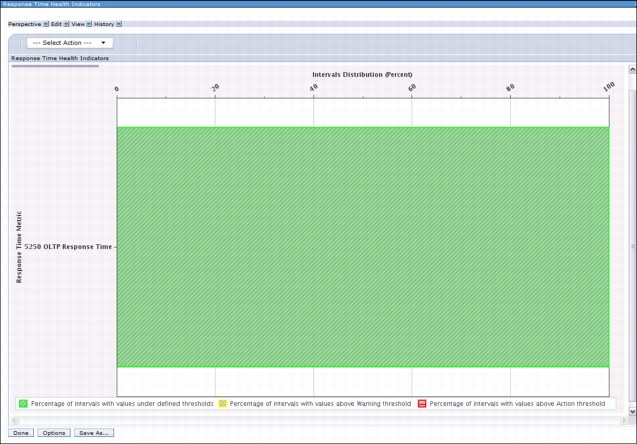
Figure 17-78 Response Time Health Indicators
From this perspective, you can open the 5250 Display Transactions Overview perspective.
Defining the health indicators thresholds
With IBM i 7.1, the health indicators can be user-defined if the IBM defaults do not meet your business requirements. They can be configured by selecting the Define Health Indicators action from the Select Action list, as shown in Figure 17-79.
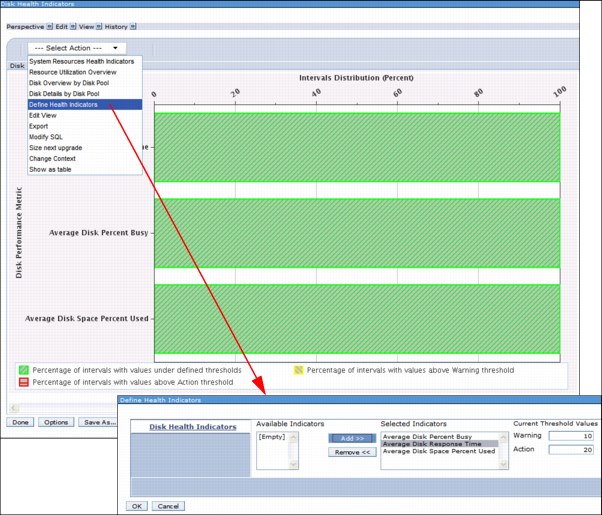
Figure 17-79 Defining the disk health indicators threshold
This new action is available from the following perspectives:
•System Resources Health Indicators
•CPU Health Indicators
•Disk Health Indicators
•Memory Pools Health Indicators
•Response Time Health Indicators
Figure 17-79 shows how to modify the disk health indicators thresholds by specifying the current threshold values as 10 for the Warning field and 20 for the Action field for the Average Disk Response Time.
By correctly defining those threshold values, you have a point of reference to visually determine whether the system is between its defined control limits. Figure 17-80 has an overview with the following Average Disk Response Time information:
•The green area shows the percentage of intervals where the Average Disk Response Time is below the defined Warning Threshold value.
•The yellow area shows the percentage of intervals where the Average Disk Response Time is above the defined Warning Threshold value and below the defined Action Threshold value.
•The red area shows the percentage of intervals where the Average Disk Response Time is above the defined Action Threshold value.
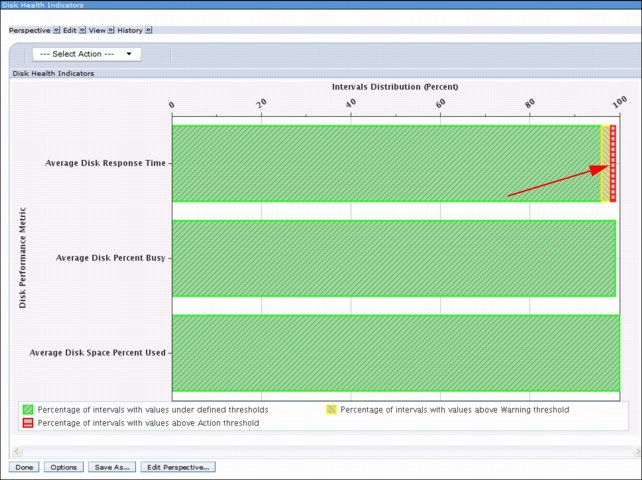
Figure 17-80 Threshold that is reached for average disk response time
It is possible to define various thresholds for a specific Graphical Health Indicator graph. Figure 17-81 shows an example of the CPU Health Indicators, where thresholds for each of the following are defined:
•Partition CPU Utilization
•Jobs CPU Utilization
•Interactive CPU Utilization
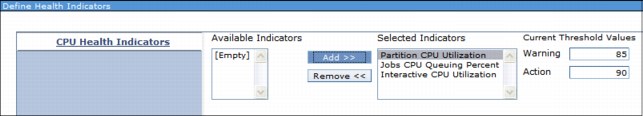
Figure 17-81 Multiple thresholds can be defined
All the individual thresholds can be added, removed, and tailored to your own specifications.
17.16.2 Viewing cross-partition processing
Collection Services can collect high-level cross-partition processor performance metrics for all logical partitions on the same single physical server regardless of the operating system that is running.
Collection Services are available on POWER6 and later servers with a minimum firmware level of xx340_061. When this data is available, it can be viewed through several perspectives that are found under the Physical System menu, which is shown in Figure 17-82.
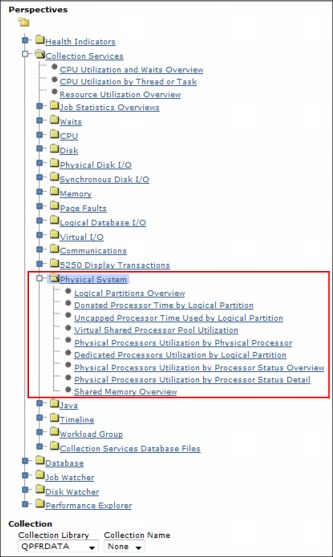
Figure 17-82 Perspectives - Physical System
There are several perspectives available under Physical System:
•Logical Partitions Overview
•Donated Processor Time by Logical Partition
•Uncapped Processor Time Used by Logical Partition
•Virtual Processor Pool Utilization
•Physical Processors Utilization by Physical Processor
•Dedicated Processors Utilization by Logical Partition
•Physical Processors Utilization by Processor Status Overview
•Physical Processors Utilization by Processor Status Detail
•Shared Memory Overview
|
Attention: Collection Services can collect high-level cross-partition processor performance metrics for all logical partitions when enabled. The performance information collection must be turned on on one of the IBM i partitions to collect the data. That partition collects data from all partitions on the same server. The setting is not required on each partition. Setting is done on the HMC Console, which is shown in Figure 17-83.
|
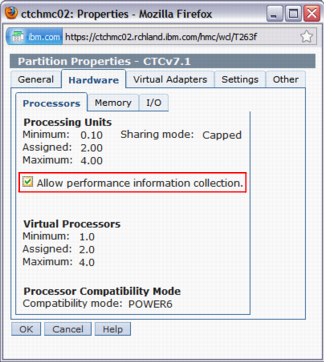
Figure 17-83 Allowing the performance information collection on the HMC
To turn on this option, from the HMC, complete the following steps:
1. Select Systems Management → Servers.
2. Click your IBM i system.
3. Select the partition profile.
4. Click Properties.
5. Click the Hardware tab.
6. Click Processors.
7. Check box Allow performance information collection.
8. Click OK.
Logical Partitions Overview
Figure 17-84 shows configuration data and processor usage for all logical partitions on the system, including operating system, number of virtual processors, partition memory, donated processor time, uncapped processor time that is used, and so on.

Figure 17-84 Logical Partitions Overview
Donated Processor Time by Logical Partition
Figure 17-85 shows the processor time that is donated by dedicated processor logical partitions that are configured to donate unused processor cycles.
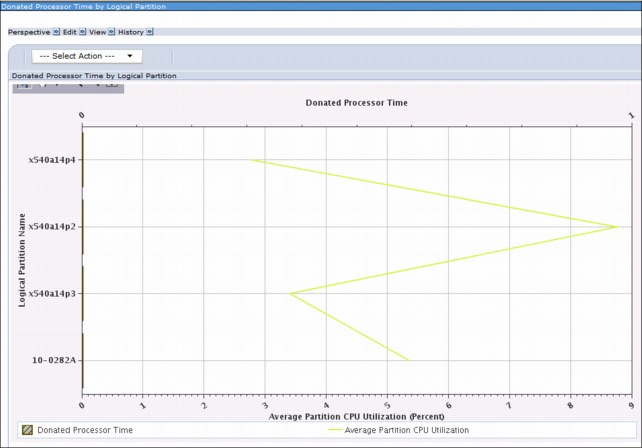
Figure 17-85 Donated Processor Time by Logical Partition
Uncapped Processor Time Used by Logical Partition
Figure 17-86 shows the uncapped processor time that was used by logical partitions in excess of their entitled processing capacity.
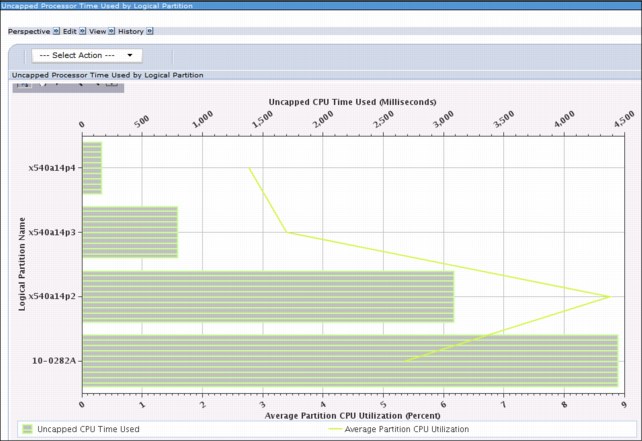
Figure 17-86 Uncapped Processor Time Used by Logical Partition
Virtual Shared Processor Pool Utilization
Figure 17-87 shows the processing capacity available and processing capacity usage for virtual shared processor pools.
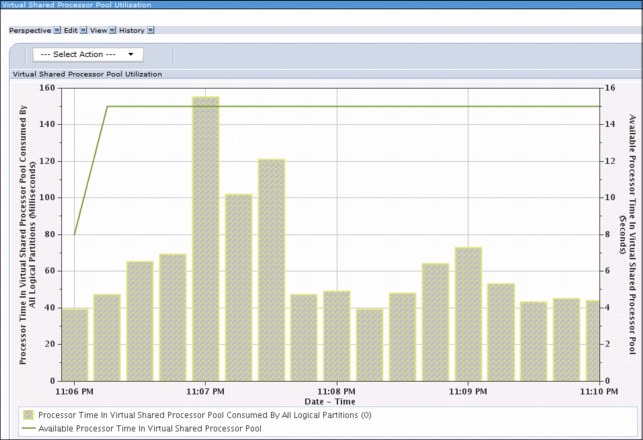
Figure 17-87 Virtual Shared Processor Pool Utilization
Physical Processors Utilization by Physical Processor
Figure 17-88 shows the usage percentage for each physical processing unit.
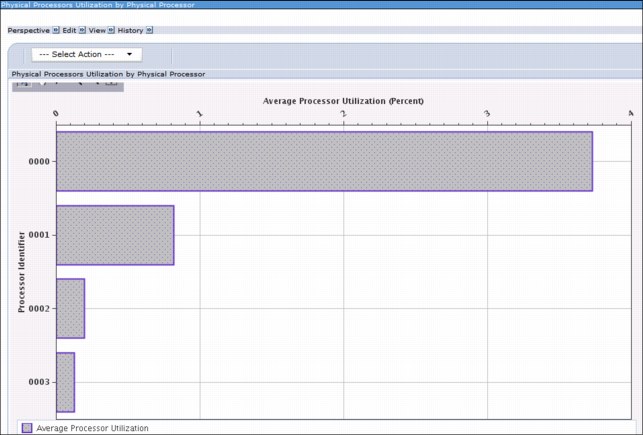
Figure 17-88 Physical Processor Utilization by Physical Processor
Dedicated Processors Utilization by Logical Partition
Figure 17-89 shows the dedicated processor usage by logical partitions.

Figure 17-89 Dedicated Processors Utilization by Logical Partition
Physical Processors Utilization by Processor Status Overview
Figure 17-90 shows a summary of processors usage for the entire collection, identifying usage for dedicated processors and for shared processors.
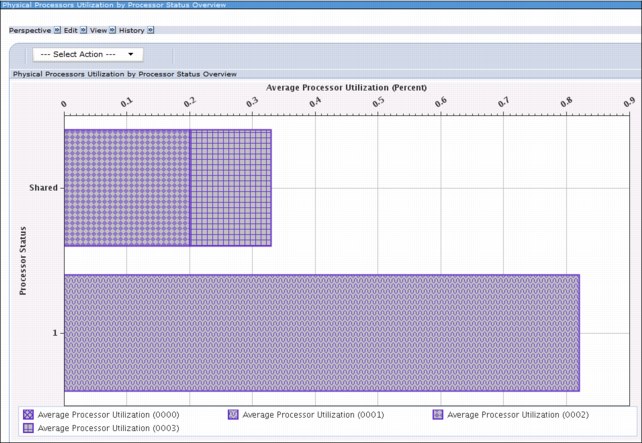
Figure 17-90 Physical Processors Utilization by Processor Status Overview
Physical Processors Utilization by Processor Status Detail
Figure 17-91 shows processor usage over time. It shows the dedicated processors and the shared processors.
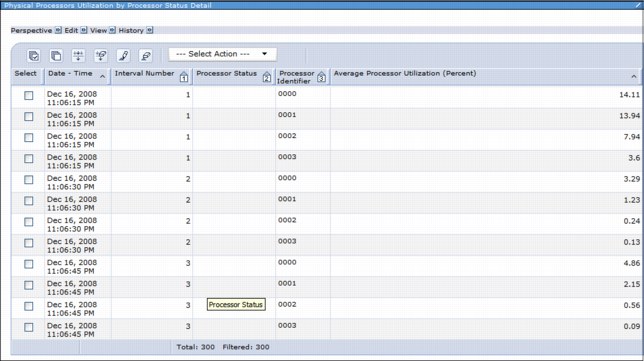
Figure 17-91 Physical Processors Utilization by Processor Status Detail
Shared Memory Overview
Figure 17-92 shows shared memory pool use by the partition on an interval-by-interval basis. This information can be used to find the partition's usage of the memory shared pool and metrics that are the sum of the activity that is caused by all partitions using the memory shared pool.
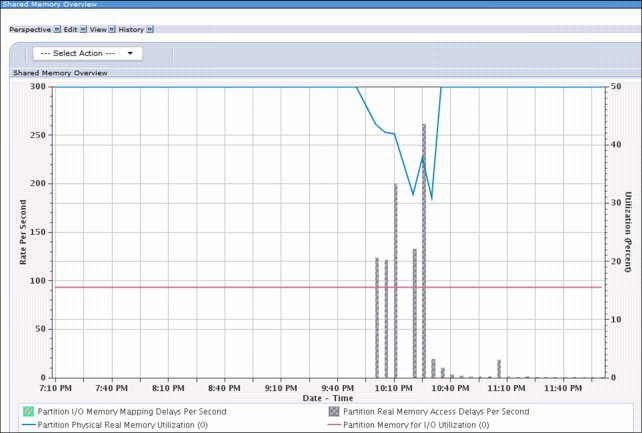
Figure 17-92 Shared memory overview
17.16.3 New Database package
There is now a robust graphical interface for the Database perspective that is enabled by Collection Services support, as shown in Figure 17-93:
•New perspectives are available within the Database perspective
•Support for SQL Plan Cache and SQL Performance Monitor database performance files
•Collection services include physical I/O breakdown by SQL activity
|
Required program: IBM i 7.1 5770-PT1 licensed program Performance Tools - Manager Feature - Option 1 must be installed to use this interface.
|
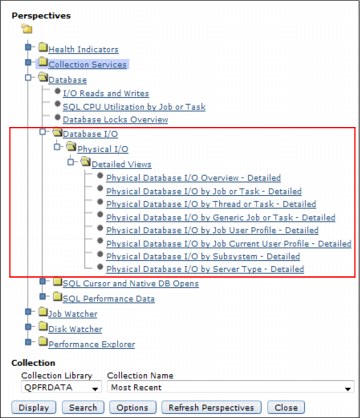
Figure 17-93 PDI - Investigate Data - Database
Database I/O
For the Physical I/O perspective, the following detailed views are available:
•Physical Database I/O Overview
•Physical Database I/O by Job or Task
•Physical Database I/O by Thread or Task
•Physical Database by Generic Job or Task
•Physical Database by Job User Profile
•Physical Database by Job Current User Profile
•Physical Database by Subsystem
•Physical Database by Server Type
Physical Database I/O Overview
This chart shows physical database I/O by SQL-related and non-SQL related synchronous and asynchronous read and write rates per second.
Physical Database I/O by Job or Task
This chart shows the breakdown of SQL-related and non-SQL related, synchronous and asynchronous, and read and write physical database I/O requests as an I/O rate per second grouped by job or task and ranked by the largest contributors. Use this chart to select contributors for further detailed investigation.
Physical Database I/O by Thread or Task
This chart shows the breakdown of SQL-related and non-SQL related, synchronous and asynchronous, and read and write physical database I/O requests as an I/O rate per second grouped by thread or task and ranked by the largest contributors. Use this chart to select contributors for further investigation.
Physical Database I/O by Generic Job or Task
This chart shows the breakdown of SQL-related and non-SQL related, synchronous and asynchronous, and read and write physical database I/O requests as an I/O rate per second grouped by the first six characters of the job or task name and ranked by the largest contributors. Use this chart to select contributing groups for further investigation.
Physical Database by Job Current User Profile
This chart shows the breakdown of SQL-related and non-SQL related, synchronous and asynchronous, and read and write physical database I/O requests as an I/O rate per second grouped by the job user profile and ranked by the largest contributors. Use this chart to select contributing groups for further investigation.
Physical Database by Subsystem
This chart shows the breakdown of SQL-related and non-SQL related, synchronous and asynchronous, and read and write physical database I/O requests as an I/O rate per second grouped by subsystem and ranked by the largest contributors. Use this chart to select contributing groups for further investigation.
Physical Database by Server Type
This chart shows the breakdown of SQL-related and non-SQL related, synchronous and asynchronous, and read and write physical database I/O requests as an I/O rate per second grouped by server type and ranked by the largest contributors. Use this chart to select contributing groups for further investigation.
This new breakdown makes it definitely much easier to notice what changed.
The graph in Figure 17-94 shows an example of the Physical Database I/O Overview chart.
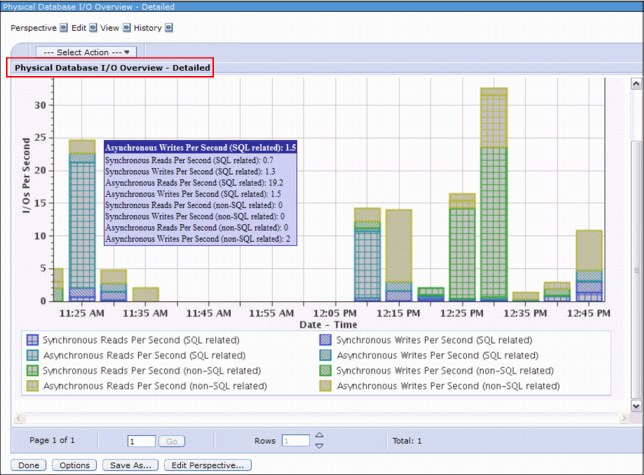
Figure 17-94 Physical Database I/O Overview
The graph in Figure 17-95 shows an example of the Physical Database I/O by Job or Task chart.
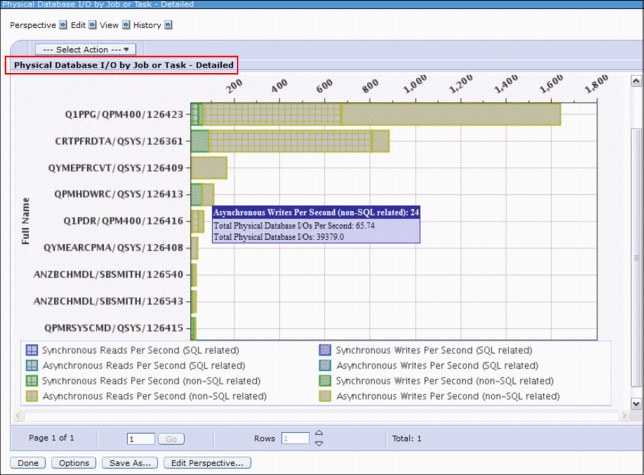
Figure 17-95 Physical Database I/O by Job or Task
SQL Performance Data
You can now find SQL Plan Cache Snapshot, SQL Plan Cache Event Monitor, and SQL Performance Monitor database files under the PDI Collection Name List, as shown in Figure 17-96.
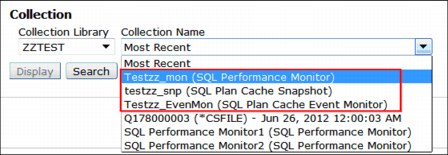
Figure 17-96 Collection Name list
Select these collections with the SQL Performance Data perspectives to view several high-level charts for a specific SQL Performance Monitor, SQL Plan Cache Snapshot, or SQL Plan Cache Event Monitor.
The SQL Plan Cache and SQL Performance Monitor folders each have two perspectives:
•SQL Overview
•SQL Attribute Mix
SQL Overview perspective
This perspective gives a comprehensive picture of how queries are running overall. The SQL Overview perspective for both SQL Plan Cache and SQL Performance Monitor database performance files has 11 views:
•Query Time Summary
•Open Summary
•Open Type Summary
•Statement Usage Summary
•Index Used Summary
•Index Create Summary
•Index Advised
•Statistics Advised
•MQT Use
•Access Plan Use
•Parallel Degree Usage
In Figure 17-97, you can see an example of the Query Time Summary view with a corresponding Open Type summary view.
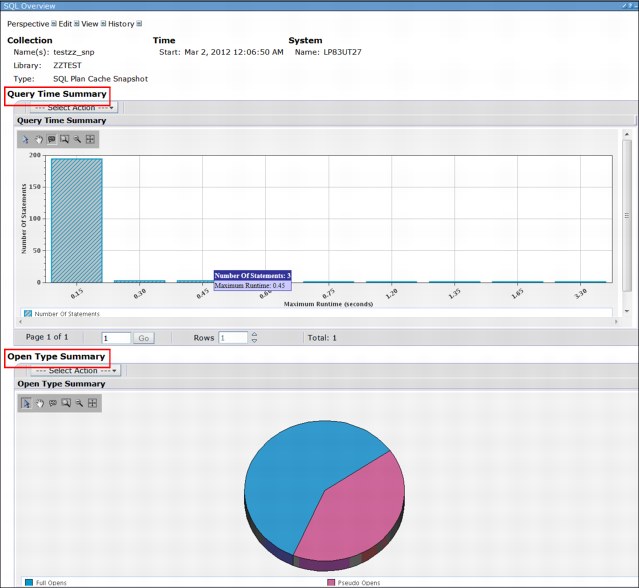
Figure 17-97 SQL Overview Perspective - views
SQL Attribute Mix Perspective
This perspective provides an indication of the nature of the users applications and queries by displaying the attribute mix. The Attribute Mix perspective has the following views available:
•Statement Summary
•Statement Type Summary
•Isolation Level Summary
•Allow Copy Data Summary
•Sort Sequence Summary
•Close Cursor Summary
•Naming Summary
•Optimization Goal
•Blocking Summary
In Figure 17-98, you can see an example of the Statement Summary view with a corresponding Statement Type Summary view.
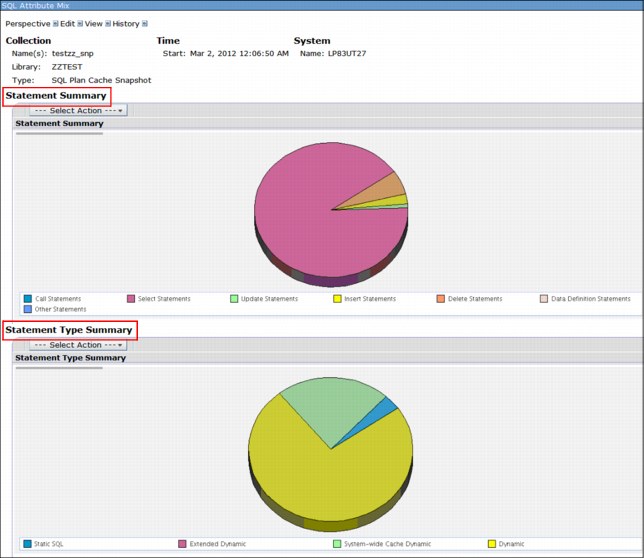
Figure 17-98 SQL Attribute Mix perspective - views
17.16.4 QAPMCONF perspective
A new perspective view of the QAPMCONF database file was added. It can be found within the Collections Services content package under the Collection Services Database Files folder, as shown in Figure 17-99.

Figure 17-99 QAPMCONF perspective view
The window that is shown in Figure 17-100 contains general information about the collections options and information about the system on which the data was collected.
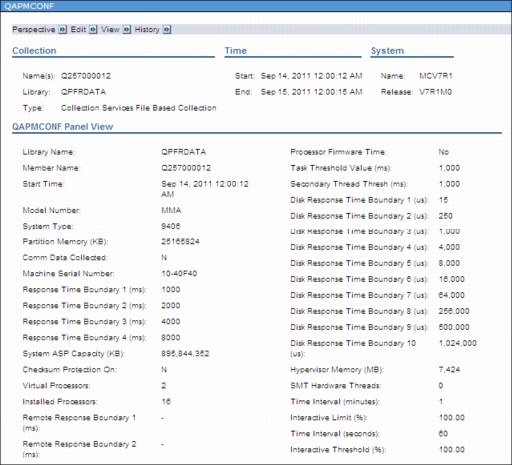
Figure 17-100 QAPMCONF perspective
17.16.5 QAPMJOBMI perspective
New fields are added to the QAPMJOBMI database file. These fields can be found within the Collections Services content package under the Collection Services Database Files folder, as shown in Figure 17-101.
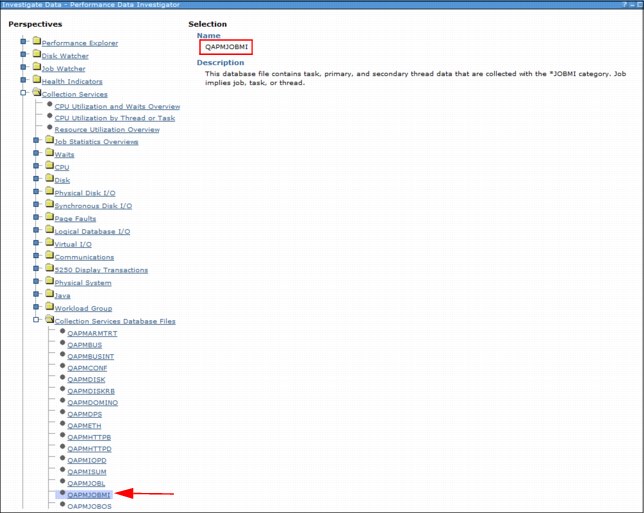
Figure 17-101 QAPMJOBMI perspective
The window that is shown in Figure 17-102 contains more information that enables improved Native versus SQL database performance isolation:
•SQL clock time (total time in SQ and below) per thread (microseconds)
•High Level SQL Statement count
•SQL unscaled CPU per thread (microseconds)
•SQL scaled CPU per thread (microseconds)
•SQL synchronous database reads per thread
•SQL synchronous non-database reads per thread
•SQL synchronous database writes per thread
•SQL synchronous non-database writes per thread
•SQL asynchronous database reads per thread
•SQL asynchronous non-database reads per thread
•SQL asynchronous database writes per thread
•SQL asynchronous non-database writes per thread
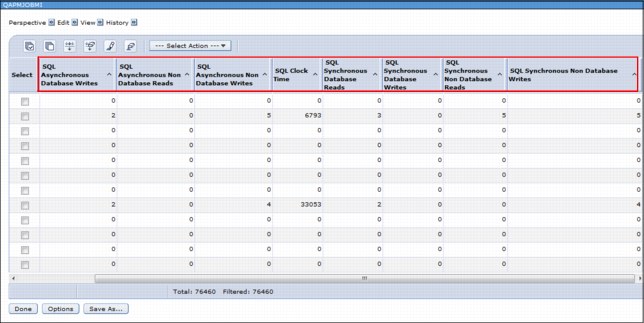
Figure 17-102 QAPMJOBMI - Native versus SQL Database performance isolation
17.16.6 Create Performance Data Report function
Within the Performance category, there is a new Create Performance Data Report function. To use this function, from the left navigation pane, click Performance → All Tasks → Reports → Create Performance Data Report as shown in Figure 17-103.
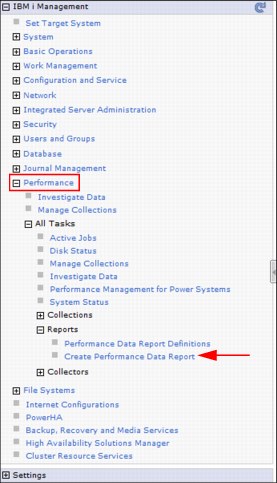
Figure 17-103 Reports - Create Performance Data Report
You have definitions that provide predefined sets of perspectives to create for a specific collection. A report definition can be selected along with the collection you are interested in to generate a .pdf or a .zip file of the perspectives, as shown in Figure 17-104. This definition makes it easy to export multiple charts or tables for collection at one time.

Figure 17-104 Create performance data report - definition
17.16.7 Image and file export
Within Performance Data Investigator, you can now export an image (charts only), a comma delimited file, or a tab delimited file. Figure 17-105 shows an example of exporting CPU Utilization and Waits Overview information to a comma delimited file. You can insert this data into a spreadsheet for later manipulation.
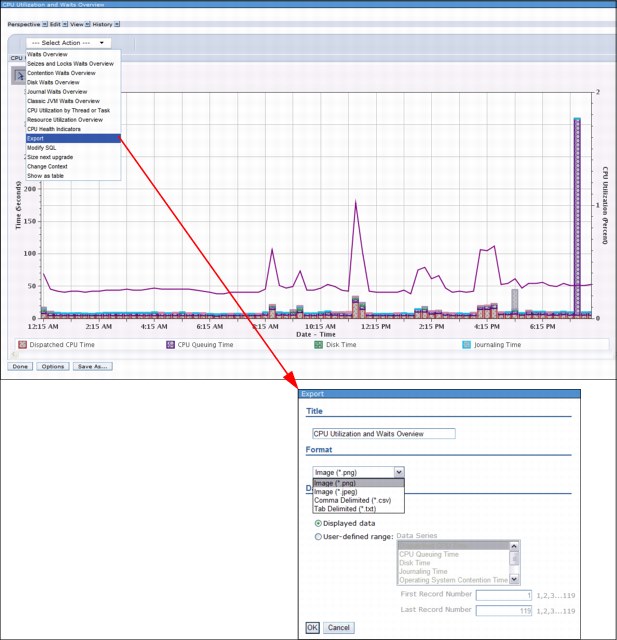
Figure 17-105 Exporting an image, comma delimited file, or a tab delimited file
This feature makes it possible to print or export your data to store it for later reference.
The export window has two main choices:
•Format, which has three options that can be specified by the user:
– An image (*.png or .jpeg) file.
– Comma-separated values (CSV), which is the default format.
– A tab delimited (*.txt) file.
•Data Range, which has three options that can be specified by the user:
– All data
This option exports the entire data set to the chosen format.
– Displayed data
This option is the default and produces smaller results, but can omit off-window information.
– User-defined range
You can use this option to specify which records and which series you want to export.
17.16.8 Sizing the next upgrade
The Investigate Data feature can now send data from your session to the Workload Estimator for use in sizing a future system using current performance characteristics.
The IBM Systems Workload Estimator is a web-based sizing tool for IBM Power Systems, System i, System p®, and System x, and is available at the following website:
Use this tool to size a new system, to size an upgrade to an existing system, or to size a consolidation of several systems.
Figure 17-106 shows an example where measured data is taken from the collection services (in this case, from CPU Utilization and Waits Overview) and Size next upgrade is selected from the Actions menu. This action opens the IBM Systems Workload Estimator window.
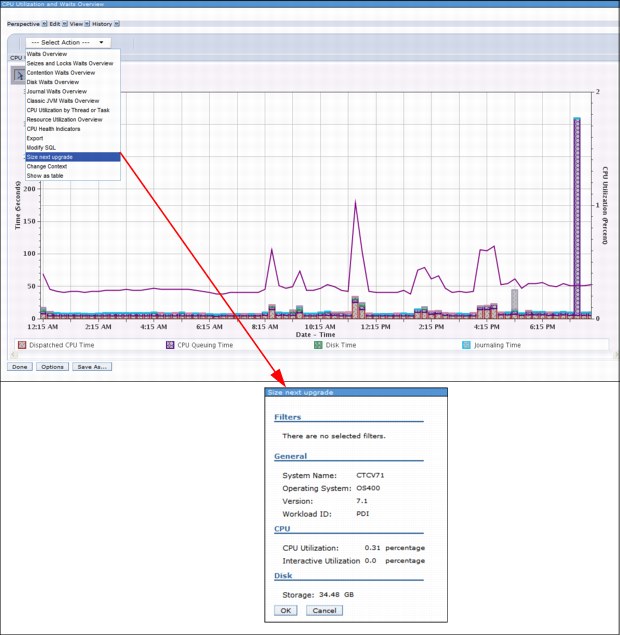
Figure 17-106 Size next upgrade
It is possible to use filters to have only a subset of collected performance data sent to the Workload Estimator. The filtering can be done by time range. Complete the following steps to accomplish this task:
1. From the CPU Utilization Overview perspective that is shown in Figure 17-107, click the first icon at the upper left of the chart to enable the select tool.
2. Select minimum and maximum points in the chart. These points are shown as two red signs that are selected, in this example, at 6:15 a.m. and 12:15 a.m.
|
Important: You must select bars of the same metric (the color / pattern must match) or each selection clears the previous selections.
|

Figure 17-107 Time range
A window where the time range is defined as filtered before opens.
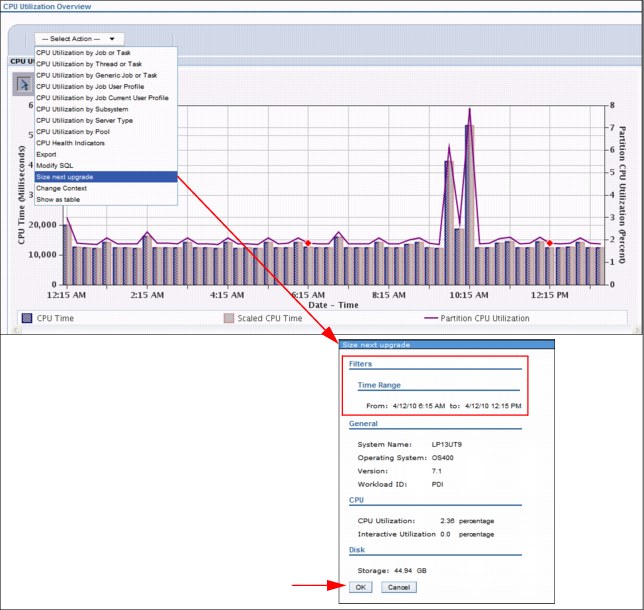
Figure 17-108 Subset of performance-related data sent to WLE
4. Click OK to send this subset of the data to Workload Estimator.
|
Note: The Size Next Upgrade action to start Workload Estimator (WLE) is now updated so that the metrics for Disk Read IO (bytes) and Write IO (bytes) calculations give more accurate information.
|
17.16.9 Timeline perspective
The timeline bars on the Timeline Overview for Threads or Tasks chart (Figure 17-109) represent the elapsed time of threads or tasks, the timeline bars are as follows:
•Dispatched CPU Time
•CPU Queuing Time
•Other Waits Time (proportions)
This perspective gives you an easy visual context of the (run time) length for jobs and the concurrency of workload on the system. Select a thread or task to view its detailed run and wait contributions.
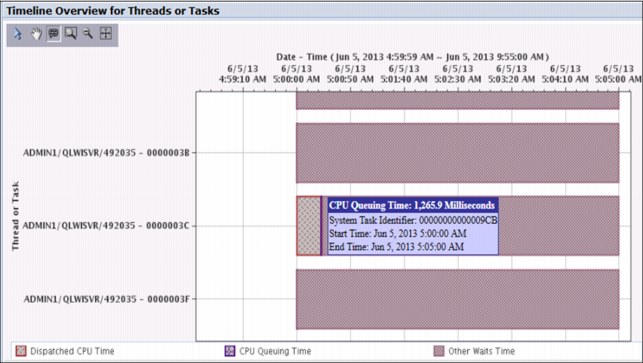
Figure 17-109 Timeline Overview graph
Timeline Overview for Threads or Tasks
Select one thread or task and see the details as shown in Figure 17-110.
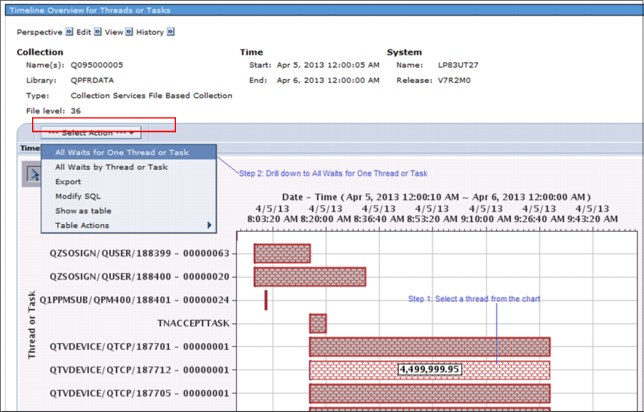
Figure 17-110 Timeline Overview for Threads or Task
Figure 17-111 shows the Waits by Job or Task. You can select the following actions:
•Waits for One Job or Task
•All Waits by Thread or Task
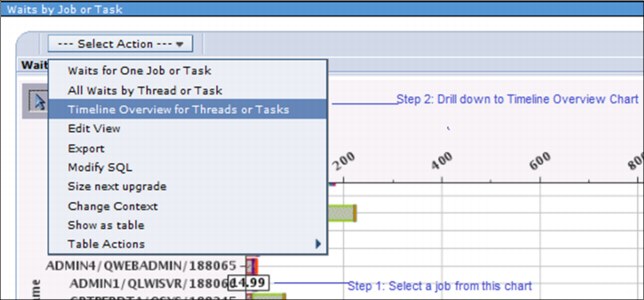
Figure 17-111 Wait by Job or Task
17.16.10 Memory perspective
This section shows three views or charts in each perspective
•Memory Pool Sizes and Fault Rates:
– View 1: Memory Pool Sizes and Fault Rates (001-004) as seen in Figure 17-112
– View 2: Memory Pool Sizes (All Pools)
– View 3: Fault Rates (All Pools)
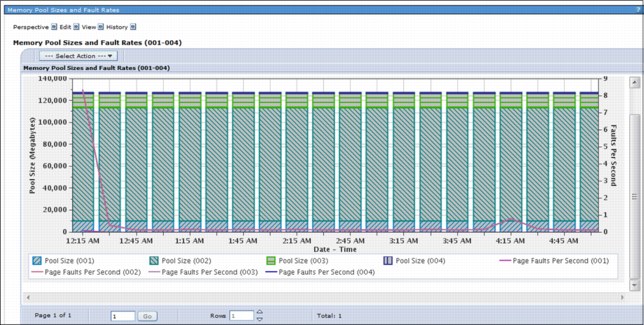
Figure 17-112 Memory Pool Sizes and Fault Rates, view one: (Pools 001-004)
•Memory Pool Activity Levels
– View 1: Memory Pool Activity Levels and Ineligible Transitions Per Second (001-004)
– View 2: Memory Pool Activity Levels (All Pools)
– View 3: Ineligible Transitions Per Second (All Pools)
Figure 17-113 shows the Memory Metric Overview for One Pool display.

Figure 17-113 Memory Metrics for One Pool: Memory metrics overview for one pool
• DB and Non-DB Page Faults
– View 1: DB and Non-DB Page Faults Overview (All Pools) as seen in Figure 17-114
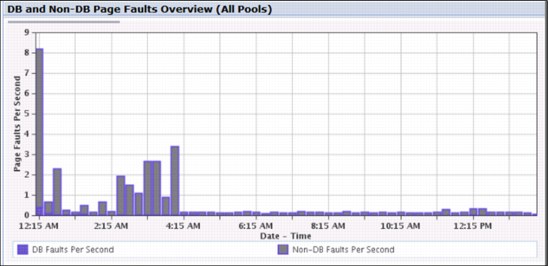
Figure 17-114 DB and Non-DB Page Fault Overview (all Pools)
– View 2: DB Page Faults (All Pools) as seen in Figure 17-115

Figure 17-115 DB Page Faults (All Pools)
– View 3: Non-DB Page Faults (All Pools) as shown in Figure 17-116

Figure 17-116 Non-DB Page Faults (All Pools)
•Memory Metrics for One Pool
– View 1: Memory Metrics Overview for One Pool
– View 2: DB and Non-DB Page Faults for One Pool
– View 3: DB and Non-DB Pages Read/Written for One Pool
17.16.11 Ethernet Link Aggregation Modified perspectives
The Ethernet Protocol Overview perspective is available in the Collection Services package under the Communications folder. The perspective charts now use a breakdown dimension to distinguish different lines as shown in Figure 17-117 on page 771.

Figure 17-117 Ethernet Protocol - aggregated link
In the Ethernet Lines Overview chart, you can click Communications Overview for One Ethernet Line from the Actions menu as shown in Figure 17-118.

Figure 17-118 Communications Overview for One Ethernet Line
|
Port Resource Names: Within the QAPMETH file, the Port Resource Name is added to the end of the file after the ETMUPF field. There is one record per line per port per interval. With the introduction of link aggregation, line names do not need to be unique within an interval. Use a Port Resource Name to uniquely associate records across intervals.
|
For more information related to Ethernet Link Aggregation, see 9.9, “Ethernet link aggregation” on page 442.
17.16.12 Workload Group perspectives
A new perspective named Dispatch Latency Totals by Workload Group is available in the Collection Services package under the Workload Group folder.
This chart shows an overview of workload group dispatch latency. It shows the total delay time for each workload group, which is the amount of time that threads that were ready to run could not be dispatched because of the group's maximum concurrent processor limit.
It has two available views (graphs):
•Dispatch Latency by Workload Group
•Dispatch Latency by Workload Group and Processors Assigned
The Display Latency Totals by Workload Group view is shown in Figure 17-119.
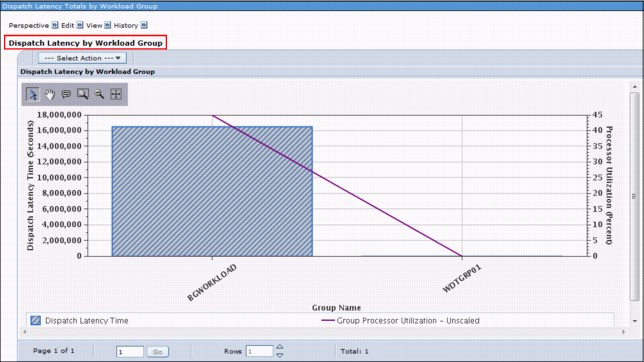
Figure 17-119 Display Latency Totals by Workload Group
The Dispatch Latency Totals by Workload Group and Processors Assigned view is shown in Figure 17-120.
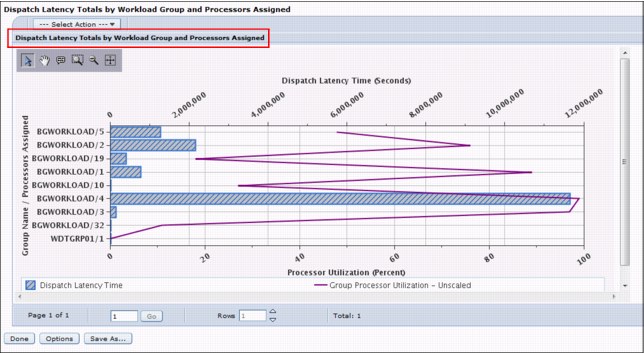
Figure 17-120 Dispatch Latency by Workload Group and Processors Assigned
From these views, you can select a Workload Group and drill down to either of the following views:
•Dispatch Latency Totals by Thread for one Workload Group.
•Dispatch Latency for One Workload Group.
The workload capping function prevents a subsystem from getting more than the capacity of the number of cores that are allocated to that workload capping group. There is nothing that causes or ensures that the threads of a capped subsystem receive the full throughput allowed. The data can be analyzed to determine whether the workload capping group limit on the number of processors that are assigned is causing wait time for the threads to complete. This function does not ensure that adding more processor cores will prevent the workload group from encountering other bottlenecks because the system is busy with other uncapped subsystem threads.
The purpose of the PDI perspectives is to show the statistics of the Workload Groups as collected by Collection Services.
For more information about Workload Groups, see 19.7, “IBM i workload groups” on page 842 and the IBM i developerWorks Wiki - IBM i Technology Updates - IBM i workload groups at:
17.16.13 Java perspectives
You now have the following available Java perspectives:
•IBM Technology for Java Memory Overview
•IBM Technology for Java Memory by Job
The charts contain general information for active Java virtual machines (JVM).
Figure 17-121 shows the IBM Technology for Java Memory Overview perspective that shows average heap sizes and memory over the entire time of the collection broken down by job. You can use this perspective to discover what jobs are using the memory so that you can look at them in more depth afterward.

Figure 17-121 IBM Technology for Java - Memory Overview
You can now select the perspective IBM Technology for Java Average Memory by Job from the Java folder and also as a drill-down menu under the existing IBM Technology for Java Memory Overview, as shown in Figure 17-122.
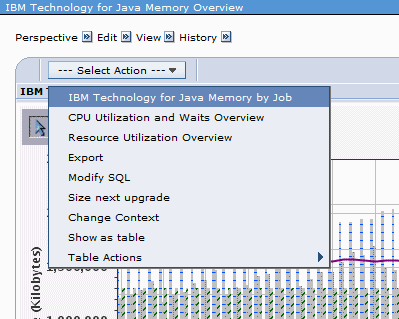
Figure 17-122 IBM Technology for Java - Memory Overview by Job
This chart shows the average heap sizes and memory over the entire time of the collection broken down by job. You can use this chart to discover what jobs are using the memory so you can look at them later.
A new perspective named IBM Technology for Java Memory for One Job is available as a drill-down menu under the IBM Technology for Java Average Memory by Job perspective. You can use this perspective to look at the heap and memory usage over time for one selected job, as shown in Figure 17-123.
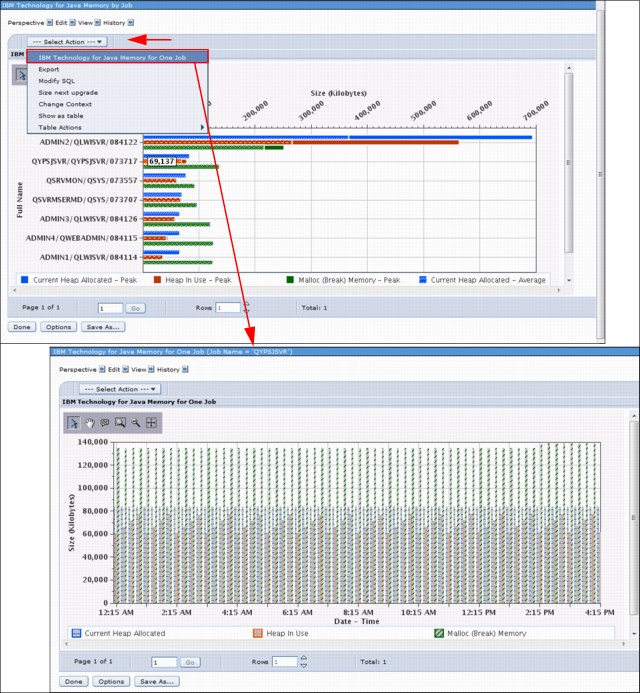
Figure 17-123 IBM technology for Java - Memory for one job
17.16.14 Disk Response Time charts
The Disk Response Time charts are a new addition to the IBM i 7.1 Collection Services Perspectives. These charts can be accessed by clicking Disk → Disk Response Time → Detailed as shown in Figure 17-124. The charts show disk I/O metrics segmented by response time and are only available for data that is collected on IBM i 7.1 or later.

Figure 17-124 Disk Response Time charts
Within this perspective, the following detailed options are available:
•Disk I/O Rates Overview
•Disk I/O Rates Overview with Cache Statistics
•Disk I/O Average Response Time Overview
•Disk I/O Total Response Time Overview
•Disk I/O Total Service Time Overview
Disk I/O Rates Overview
Figure 17-125 shows the disk I/O that is segmented by the number of I/Os that occurred when the response time was in specific ranges, and the average response time and average service time.
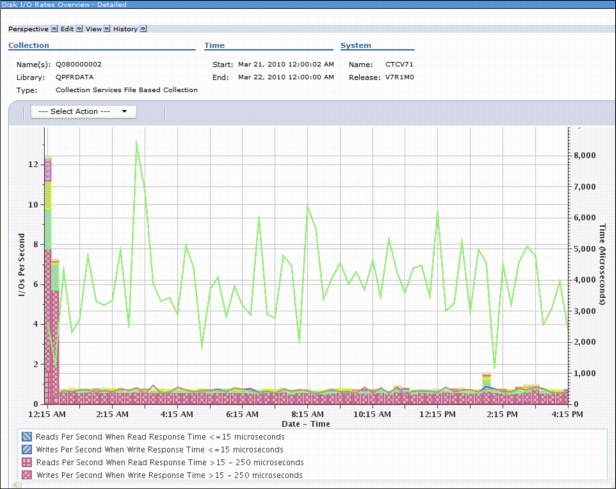
Figure 17-125 Disk I/O Rates Overview - detailed
Disk I/O Rates Overview with Cache Statistics
Figure 17-126 shows the disk I/O that is segmented by the number of I/Os that occurred when the response time was in specific ranges, and cache statistics.
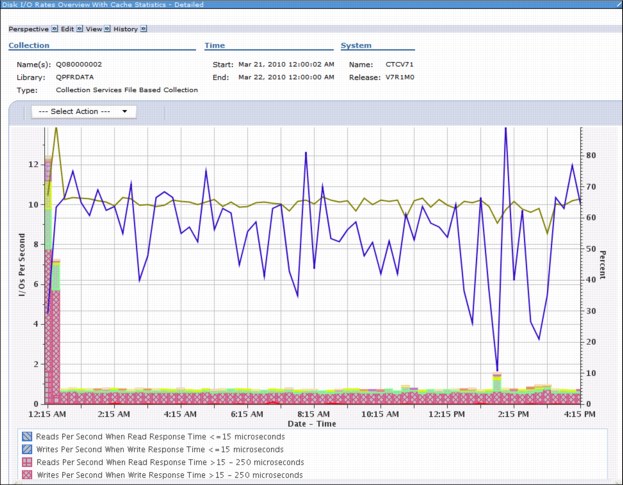
Figure 17-126 Disk I/O Rates Overview with Cache Statistics - detailed
Disk I/O Average Response Time Overview
Figure 17-127 shows the disk average response time that is segmented by the number of I/Os that occurred when the response time was in specific ranges, and average response time and average service time.

Figure 17-127 Disk I/O Average Response Time Overview - detailed
Disk I/O Total Response Time Overview
Figure 17-128 shows the disk total response time that is segmented by the number of I/Os that occurred when the response time was in specific ranges, and average response time and average service time.

Figure 17-128 Disk I/O Total Response Time Overview - detailed
Disk I/O Total Service Time Overview
Figure 17-129 shows the disk total service time that is segmented by the number of I/Os that occurred when the response time was in specific ranges, and average response time and average service time.
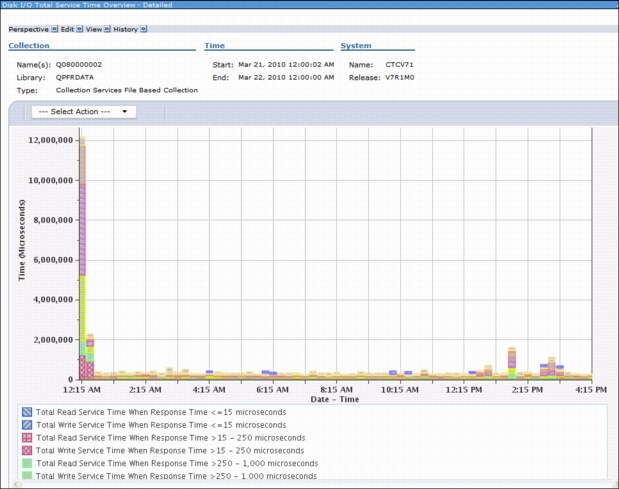
Figure 17-129 Disk I/O Total Service Time Overview - detailed
For more information about these enhancements, see “QAPMDISKRB” on page 306.
17.16.15 Interactive perspective development
You can develop new charts and tables in Investigate Data. You can add views, modify data series information, and modify SQL statements without leaving the Investigate Data window.
Adding views
To add views, complete the following steps:
1. At the bottom of the Investigate Data Perspectives window, click Options. The window that is shown in Figure 17-130 opens.
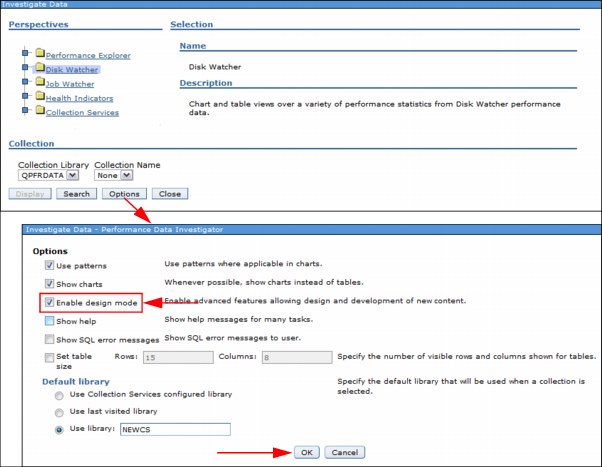
Figure 17-130 Investigate Data perspective - Options
2. Select the Enable Design Mode option and click OK. The options that are chosen here are persistent across connections for the user.
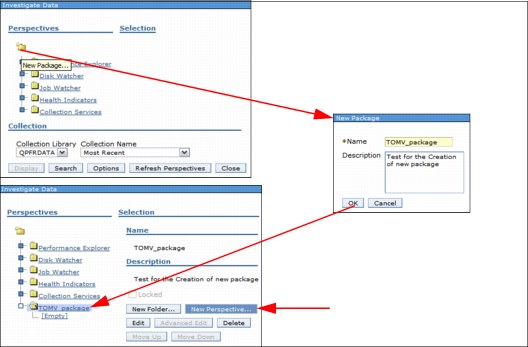
Figure 17-131 Creating a custom content package
4. In the New Package window, specify a name, and click OK. The package is created and displayed.

Figure 17-132 Add data series - Thresholds
6. Specify a name and a description for the perspective and click Add to add a view (Table or Chart) with a Data series and a corresponding Threshold.
7. Click OK in the Add View window and click OK in the New Perspective window. The customized perspective is saved and shows up in the main perspective tree list for further reference, as shown in Figure 17-133.

Figure 17-133 Customized package and perspectives added to the main perspective tree list
Modifying Data Series information
It is also possible to modify the Data Series information, as shown in Figure 17-134, by clicking Edit in the View pane in the Edit Perspective window.
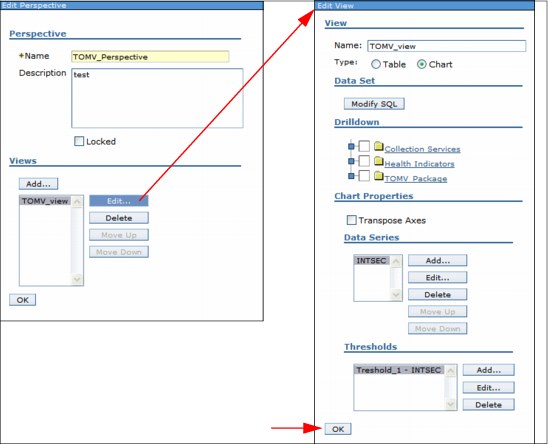
Figure 17-134 Modifying data series
After you modify the view, click OK to save the view with the changed information.
Modifying an SQL statement
You can use this feature to view and modify the current SQL and rerender its output to the window. Figure 17-135 shows an example where Modify SQL is selected from the Actions menu on the CPU Utilization and Waits Overview chart. A window opens, where the user can modify the SQL statements. Click OK to save the modifications.
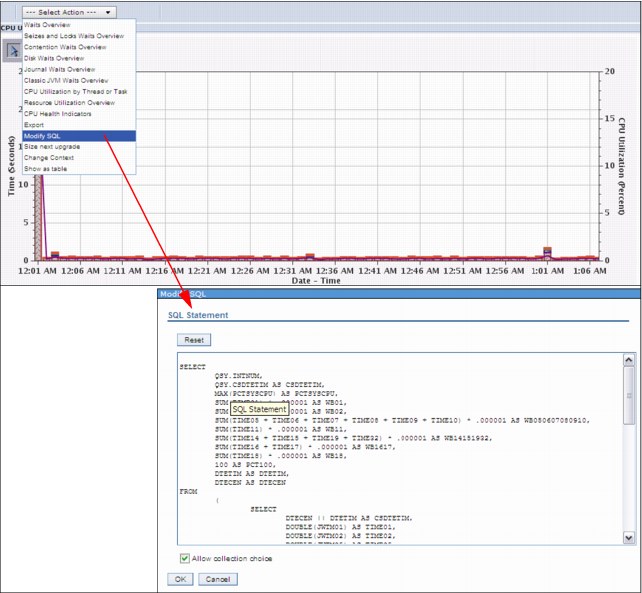
Figure 17-135 Modifying the SQL
Formatting enhancements were made to the Modify SQL window, making the text easier to read and understand. The Modify SQL action is available for charts and tables.
A new option is available on the Options window that you can use to see SQL error messages when you use the Modify SQL function, as shown in Figure 17-136.
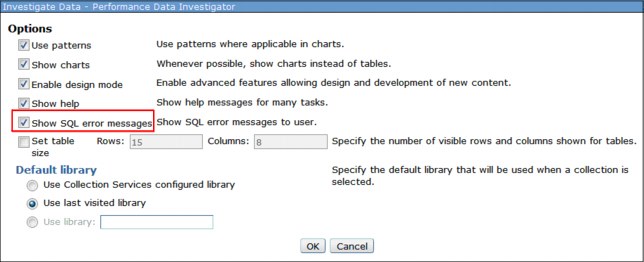
Figure 17-136 Modify SQL - new option
17.16.16 Metric finder
With the significant number of metrics that are provided by the Investigate Data feature, sometimes knowing which perspective contains the metric you want to see is not a simple task.
You can use the Metric Finder function to display perspectives that are based on a specific metric. This function is useful when you know what type of information you are looking for but do not know where to start, or where certain metrics are included.
To start this feature, click Search when you start Investigate Data, as shown in Figure 17-137. Then, choose your perspective by searching for a metric name.
|
Tip: You can specify a filter to limit the metric names included in the menu. The filter facilitates your search for one specific metric without knowing its exact name. After you enter a filter, click Apply Filter to update the metric name list. After a perspective is selected, you can display it by clicking Display.
|

Figure 17-137 Metric finder
The tree-format of perspectives is replaced with the new search function. The Search button is replaced by a List button that is used to revert to the normal window afterward.
17.16.17 Performance Explorer content package
A simple Performance Explorer content package is included to start the analysis of Performance Explorer data, as shown in Figure 17-138. You can use this feature to analyze the performance of an application program. You can use the Performance Explorer content package to view the PEX database files.

Figure 17-138 Performance Explorer content package
The following PEX Profile perspectives provide functions that are similar to what Profile Data Trace Visualizer (PDTV) offers:
•Profile by Procedure
•Profile by Component
•Hierarchical Trace Profile
•Job/Thread List
17.16.18 New metrics
Many perspectives were added to Investigate Data, and many new metrics were added to existing perspectives:
•SAN
•Virtual I/O
•Energy Management
•Communication data
SAN metrics
The Disk Response Time Charts are new in IBM i 7.1 Collection Services Perspectives, as shown in Figure 17-139. This feature is accessed by clicking Disk → Disk Response Time → Detailed. The charts show disk I/O metrics (including SAN-attached disks) that are segmented by response time and are only available for data that is collected on IBM i 7.1 or later.
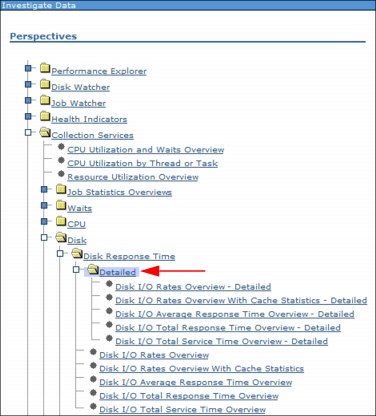
Figure 17-139 SAN metrics
For more information about these buckets, see “QAPMDISKRB” on page 306.
Virtual I/O metrics
These charts show I/O operations rates and throughput for virtual I/O devices. Figure 17-140 shows a view of virtual I/O devices categories (Adapter, Disk, Optical, and Type).
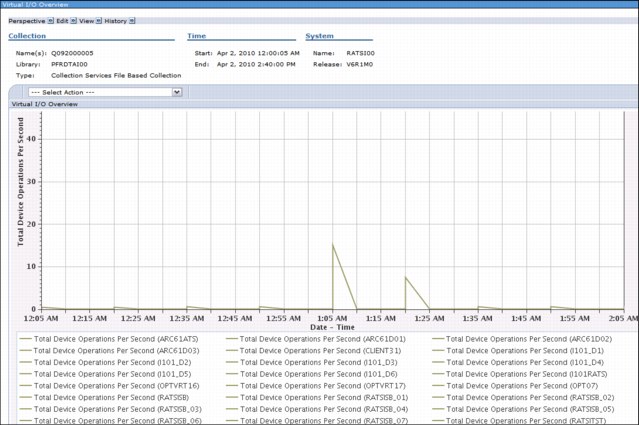
Figure 17-140 Virtual I/O metrics
Figure 17-141 shows a chart with the Virtual I/O Overview displayed by device type.

Figure 17-141 Virtual I/O overview by device type
Energy management metrics
POWER6 systems had IBM EnergyScale™ features available (such as Power Saver Mode), which made the processor frequency and voltage vary over time.
For more information about EnergyScale functionality on POWER6 and POWER7 processor-base systems, see the following website:
Use Active Energy Manager V4.2 (AEM) with IBM Systems Director 6.1 to set the power savings value for IBM Power Systems running IBM i 7.1. This power savings value is then used to achieve a balance between the power consumption and the performance of the Power Systems system.
For more information about AEM, see the following website:
Charts now have the Scaled CPU time displayed along with the CPU time. This metric is shown in the CPU Utilization Overview, as shown in Figure 17-142.
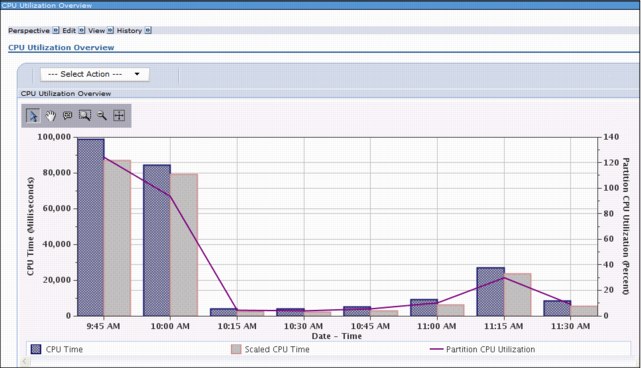
Figure 17-142 CPU use overview
Figure 17-143 shows the CPU rate (Scaled CPU: Nominal CPU Ratio) for a specific period.

Figure 17-143 CPU rate (Scaled CPU: Nominal CPU Ratio)
Communication metrics
These charts show communication lines traffic and errors for the active protocols on the partition. You can use them for a view of communication protocols and specific line information about the partition. Figure 17-144 has an example of the Ethernet Protocol Overview, where the kilobytes transmitted and received per second are shown for all Ethernet lines on the system, and the number of retries of frame and MAC errors.

Figure 17-144 Ethernet protocol overview
17.16.19 Miscellaneous enhancements
Miscellaneous changes were made to improve the overall capabilities of the performance tasks:
•Added date and time information to the Collection Name list.
•Improved integration with Active Jobs.
•Improved integration with System and Disk Status.
•New collection information at the top of each perspective.
•A new menu bar that allows for quicker navigation.
•More complete history data.
•Drill-down information is as follows:
– Job Watcher – Show Holder Information
– Job Watcher - Interval Details movement
Added date and time information to the Collection Name list
The date and time information is added to the Collection Name list on the main Investigate Data window when you select a collection, as shown in Figure 17-145.
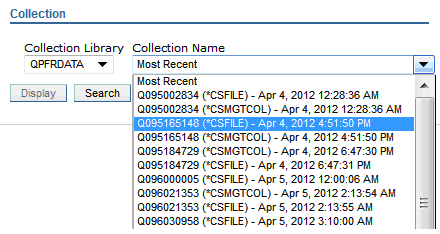
Figure 17-145 Collection name - date and time information
Improved integration with active jobs
To use this enhancement, from within the Performance category, select All Tasks and select Active Jobs from the list, as shown in Figure 17-146.

Figure 17-146 Improved integration with active jobs
From within the Active Jobs window, it is possible to go directly to performance-related information for a selected job, as shown in Figure 17-147.

Figure 17-147 Active Jobs Integration
|
Remember: When you click Investigate Job Wait Data, the chart that is rendered includes only data that pertain to that specific job. If you click Investigate Jobs Wait Data, the chart that is rendered includes all jobs that were active during that collection.
|
The following performance-related selections are available either from the menu at the right side of the selected job or from the Actions list at the top:
•Elapsed Performance Statistics
•Investigate Job Wait Data
•Start Job Watcher
Improved integration with system status and disk status
To use this enhancement, from the Performance category, click All Tasks and then either click Disk Status or System Status from the list, as shown in Figure 17-148.
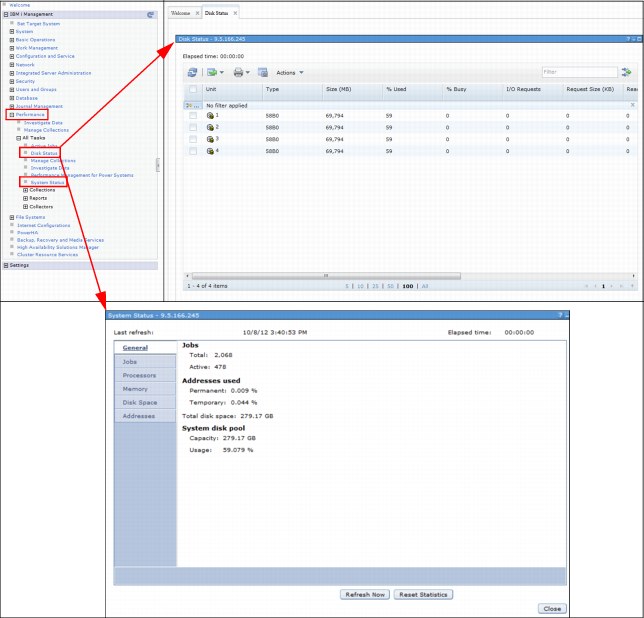
Figure 17-148 Improved integration with disk status and system status
From within System Status and Disk Status, you can go directly to the performance-related information, as shown in Figure 17-149.
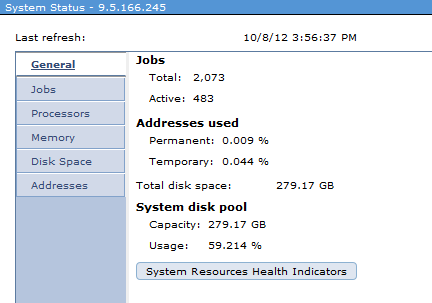
Figure 17-149 System Status and Disk Status integration
The following performance-related options are available:
•System Resources Health Indicators (from the General Tab on System Status)
•CPU Health Indicators (from the Processors tab on System Status)
•Memory Pools Health Indicators (from the Memory Tab on System Status)
•CPU Health Indicators (from the Processors Tab on System Status)
•Disk Health Indicators (from the Disk Space Tab on System Status)
•Investigate Disk Data (from the Actions list on Disk Status)
•Start Disk Watcher (from the Actions list on Disk Status)
New collection context at the top of each perspective
A new feature in Performance Data Investigator is that display collection information or collection details information can be displayed when you view a specific perspective.
By default, the name of the viewed perspective is shown as the title of the perspective window.
You might not want this information to be displayed. If so, see the View menu that has the Show Context check box, as shown in Figure 17-150. If you clear this check box, this information is hidden. This choice is preserved across sessions.

Figure 17-150 Collection information and collection details information
New menu bar
In IBM i 7.1, a menu system was added at the top of every perspective, which allows for quicker navigation, as shown in Figure 17-151.
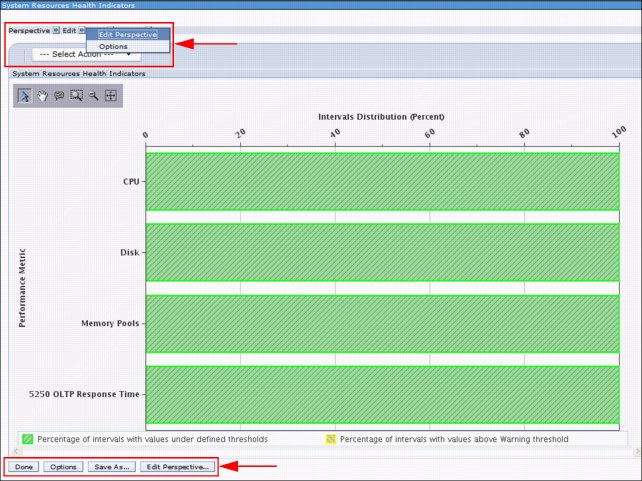
Figure 17-151 New menu bar
The new menu at the top of the perspective has the same actions available as the one at the bottom. However, it is available without needing to scroll down because the actions are sometimes rendered off-window. As such, it improves the availability of the options.
More complete history data
In IBM i 7.1, the complete History data is available, as shown in Figure 17-152, when you click History in the menu bar at the top. Start from the Memory Pools Health Indicators perspective, then drill down to the Page Faults Overview perspective and then to the Page Faults by Job User Profile perspective.
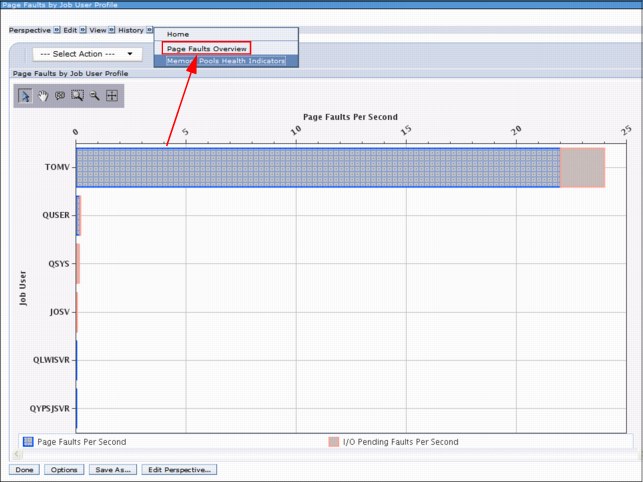
Figure 17-152 History data
From within that menu bar, it is possible to go back to the previous perspectives by clicking the corresponding item in the History Data.
Displaying holder information
From within the IBM Navigator for i, the Display holder information is available after you identify a thread or task that is holding others.
Within Investigate Data, you can click Job Watcher → Waits → All Waits by thread or task Sorted by Non-idle waits, as shown in Figure 17-153.

Figure 17-153 All Waits by thread or task Sorted by Non-idle waits
You can select one thread or task and click All Waits for One Thread or Task from the Actions menu, as shown in Figure 17-154.

Figure 17-154 All Waits for One Thread or Task
You now select one interval and perform the following actions, as shown in Figure 17-155:
•Click Interval Details for One Thread or Task.
•Click the Show Holder button for the thread or task.
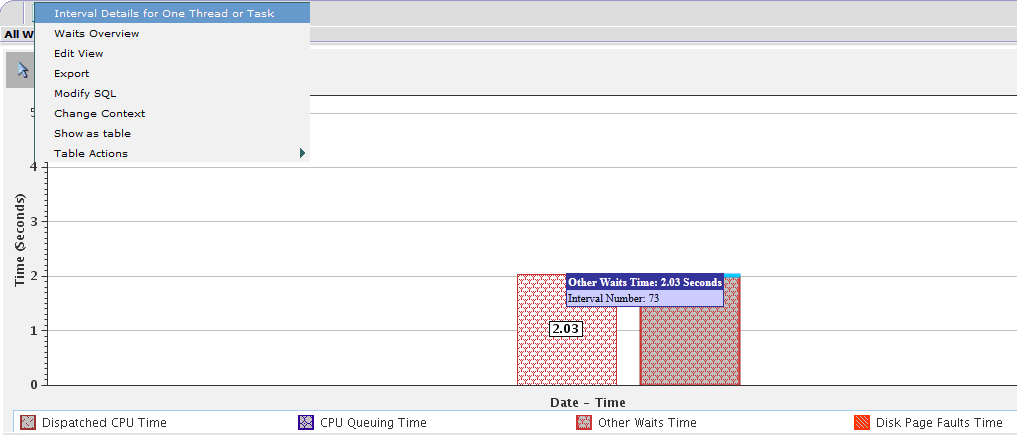
Figure 17-155 Show holder information
When you click Show Holder, the holding job or task information is displayed.
|
Selected items on charts: On certain charts (for example, Waits for one job or task), you see which job, task, or thread was selected for drill down.
|
Job Watcher - Interval Details movement
In Job Watcher, when looking at All Waits for One Thread or Task and then Interval Details for one Thread or Task, the Interval Number (Figure 17-156) can now be changed to view Interval Details for another valid interval in the collection.

Figure 17-156 Job Watcher - Interval Details movement
17.17 JS1- Advanced Job Scheduler for i enhancements
In IBM i 7.1, IBM Navigator for i has an Advanced Job Scheduler function that is equivalent to the System i Navigator client.
For more information that is related to Advanced Job Scheduler enhancements, see Chapter 12, “IBM Advanced Job Scheduler for i enhancements” on page 501.
17.18 Backup Recovery Media Services: Plug-in enhancements
IBM Navigator for i had limited Backup Recovery Media Services (BRMS) functionality in IBM i 6.1. Its capabilities were expanded into a full-featured BRMS interface, effectively bringing this web interface into parity with the client-based System i Navigator product.
For more information related to Backup Recovery Media Services enhancements, see Chapter 3, “Backup and recovery” on page 45.
..................Content has been hidden....................
You can't read the all page of ebook, please click here login for view all page.