CHAPTER 7
FINANCIAL ANALYSIS TECHNIQUES
After completing this chapter, you will be able to do the following:
- Describe tools and techniques used in financial analysis, including their uses and limitations.
- Classify, calculate, and interpret activity, liquidity, solvency, profitability, and valuation ratios.
- Describe the relationships among ratios and evaluate a company using ratio analysis.
- Demonstrate the application of DuPont analysis of return on equity, and calculate and interpret the effects of changes in its components.
- Calculate and interpret ratios used in equity analysis, credit analysis, and segment analysis.
- Describe how ratio analysis and other techniques can be used to model and forecast earnings.
- Common-size financial statements and financial ratios remove the effect of size, allowing comparisons of a company with peer companies (cross-sectional analysis) and comparison of a company’s results over time (trend or time-series analysis).
- Activity ratios measure the efficiency of a company’s operations, such as collection of receivables or management of inventory. Major activity ratios include inventory turnover, days of inventory on hand, receivables turnover, days of sales outstanding, payables turnover, number of days of payables, working capital turnover, fixed asset turnover, and total asset turnover.
- Liquidity ratios measure the ability of a company to meet short-term obligations. Major liquidity ratios include the current ratio, quick ratio, cash ratio, and defensive interval ratio.
- Solvency ratios measure the ability of a company to meet long-term obligations. Major solvency ratios include debt ratios (including the debt-to-assets ratio, debt-to-capital ratio, debt-to-equity ratio, and financial leverage ratio) and coverage ratios (including interest coverage and fixed charge coverage).
- Profitability ratios measure the ability of a company to generate profits from revenue and assets. Major profitability ratios include return on sales ratios (including gross profit margin, operating profit margin, pretax margin, and net profit margin) and return on investment ratios (including operating ROA, ROA, return on total capital, ROE, and return on common equity).
- Ratios can also be combined and evaluated as a group to better understand how they fit together and how efficiency and leverage are tied to profitability.
- ROE can be analyzed as the product of the net profit margin, asset turnover, and financial leverage. This decomposition is sometimes referred to as DuPont analysis.
- Valuation ratios express the relation between the market value of a company or its equity (for example, price per share) and some fundamental financial metric (for example, earnings per share).
- Ratio analysis is useful in the selection and valuation of debt and equity securities and is a part of the credit rating process.
- Ratios can also be computed for business segments to evaluate how units within a business are performing.
- The results of financial analysis provide valuable inputs into forecasts of future earnings and cash flow.
1. Comparison of a company’s financial results to other peer companies for the same time period is called:
A. technical analysis.
B. time-series analysis.
C. cross-sectional analysis.
2. In order to assess a company’s ability to fulfill its long-term obligations, an analyst would most likely examine:
A. activity ratios.
B. liquidity ratios.
C. solvency ratios.
3. Which ratio would a company most likely use to measure its ability to meet short-term obligations?
A. Current ratio
B. Payables turnover
C. Gross profit margin
4. Which of the following ratios would be most useful in determining a company’s ability to cover its lease and interest payments?
A. ROA
B. Total asset turnover
C. Fixed charge coverage
5. An analyst is interested in assessing both the efficiency and liquidity of Spherion PLC. The analyst has collected the following data for Spherion:
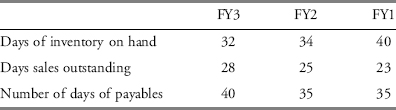
Based on this data, what is the analyst least likely to conclude?
A. Inventory management has contributed to improved liquidity.
B. Management of payables has contributed to improved liquidity.
C. Management of receivables has contributed to improved liquidity.
6. An analyst is evaluating the solvency and liquidity of Apex Manufacturing and has collected the following data (in millions of euro):
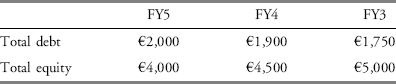
Which of the following would be the analyst’s most likely conclusion?
A. The company is becoming increasingly less solvent, as evidenced by the increase in its debt-to-equity ratio from 0.35 to 0.50 from FY3 to FY5.
B. The company is becoming less liquid, as evidenced by the increase in its debt-to-equity ratio from 0.35 to 0.50 from FY3 to FY5.
C. The company is becoming increasingly more liquid, as evidenced by the increase in its debt-to-equity ratio from 0.35 to 0.50 from FY3 to FY5.
7. With regard to the data in Problem 6, what would be the most reasonable explanation of the financial data?
A. The decline in the company’s equity results from a decline in the market value of this company’s common shares.
B. The €250 increase in the company’s debt from FY3 to FY5 indicates that lenders are viewing the company as increasingly creditworthy.
C. The decline in the company’s equity indicates that the company may be incurring losses, paying dividends greater than income, and/or repurchasing shares.
8. An analyst observes a decrease in a company’s inventory turnover. Which of the following would most likely explain this trend?
A. The company installed a new inventory management system, allowing more efficient inventory management.
B. Due to problems with obsolescent inventory last year, the company wrote off a large amount of its inventory at the beginning of the period.
C. The company installed a new inventory management system but experienced some operational difficulties resulting in duplicate orders being placed with suppliers.
9. Which of the following would best explain an increase in receivables turnover?
A. The company adopted new credit policies last year and began offering credit to customers with weak credit histories.
B. Due to problems with an error in its old credit scoring system, the company had accumulated a substantial amount of uncollectible accounts and wrote off a large amount of its receivables.
C. To match the terms offered by its closest competitor, the company adopted new payment terms now requiring net payment within 30 days rather than 15 days, which had been its previous requirement.
10. Brown Corporation had average days of sales outstanding of 19 days in the most recent fiscal year. Brown wants to improve its credit policies and collection practices and decrease its collection period in the next fiscal year to match the industry average of 15 days. Credit sales in the most recent fiscal year were $300 million, and Brown expects credit sales to increase to $390 million in the next fiscal year. To achieve Brown’s goal of decreasing the collection period, the change in the average accounts receivable balance that must occur is closest to:
A. +$0.41 million.
B. −$0.41 million.
C. −$1.22 million.
11. An analyst observes the following data for two companies:
| Company A | Company B | |
| Revenue | $4,500 | $6,000 |
| Net income | $50 | $1,000 |
| Current assets | $40,000 | $60,000 |
| Total assets | $100,000 | $700,000 |
| Current liabilities | $10,000 | $50,000 |
| Total debt | $60,000 | $150,000 |
| Shareholders’ equity | $30,000 | $500,000 |
Which of the following choices best describes reasonable conclusions that the analyst might make about the two companies’ ability to pay their current and long-term obligations?
A. Company A’s current ratio of 4.0 indicates it is more liquid than Company B, whose current ratio is only 1.2, but Company B is more solvent, as indicated by its lower debt-to-equity ratio.
B. Company A’s current ratio of 0.25 indicates it is less liquid than Company B, whose current ratio is 0.83, and Company A is also less solvent, as indicated by a debt-to-equity ratio of 200 percent compared with Company B’s debt-to-equity ratio of only 30 percent.
C. Company A’s current ratio of 4.0 indicates it is more liquid than Company B, whose current ratio is only 1.2, and Company A is also more solvent, as indicated by a debt-to-equity ratio of 200 percent compared with Company B’s debt-to-equity ratio of only 30 percent.
The following information relates to Questions 12 through 15.
The data in Exhibit A appear in the five-year summary of a major international company. A business combination with another major manufacturer took place in FY13.
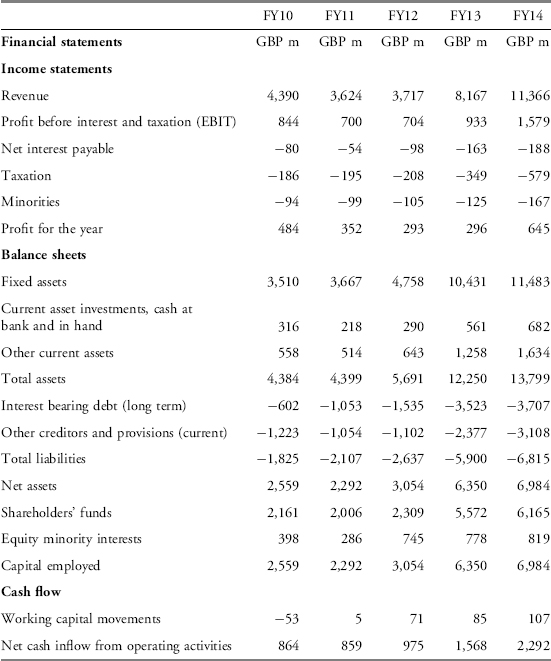
12. The company’s total assets at year-end FY9 were GBP 3,500 million. Which of the following choices best describes reasonable conclusions an analyst might make about the company’s efficiency?
A. Comparing FY14 with FY10, the company’s efficiency improved, as indicated by a total asset turnover ratio of 0.86 compared with 0.64.
B. Comparing FY14 with FY10, the company’s efficiency deteriorated, as indicated by its current ratio.
C. Comparing FY14 with FY10, the company’s efficiency deteriorated due to asset growth faster than turnover revenue growth.
13. Which of the following choices best describes reasonable conclusions an analyst might make about the company’s solvency?
A. Comparing FY14 with FY10, the company’s solvency improved, as indicated by an increase in its debt-to-assets ratio from 0.14 to 0.27.
B. Comparing FY14 with FY10, the company’s solvency deteriorated, as indicated by a decrease in interest coverage from 10.6 to 8.4.
C. Comparing FY14 with FY10, the company’s solvency improved, as indicated by the growth in its profits to GBP 645 million.
14. Which of the following choices best describes reasonable conclusions an analyst might make about the company’s liquidity?
A. Comparing FY14 with FY10, the company’s liquidity improved, as indicated by an increase in its debt-to-assets ratio from 0.14 to 0.27.
B. Comparing FY14 with FY10, the company’s liquidity deteriorated, as indicated by a decrease in interest coverage from 10.6 to 8.4.
C. Comparing FY14 with FY10, the company’s liquidity improved, as indicated by an increase in its current ratio from 0.71 to 0.75.
15. Which of the following choices best describes reasonable conclusions an analyst might make about the company’s profitability?
A. Comparing FY14 with FY10, the company’s profitability improved, as indicated by an increase in its debt-to-assets ratio from 0.14 to 0.27.
B. Comparing FY14 with FY10, the company’s profitability deteriorated, as indicated by a decrease in its net profit margin from 11.0 percent to 5.7 percent.
C. Comparing FY14 with FY10, the company’s profitability improved, as indicated by the growth in its shareholders’ equity to GBP 6,165 million.
16. Assuming no changes in other variables, which of the following would decrease ROA?
A. A decrease in the effective tax rate.
B. A decrease in interest expense.
C. An increase in average assets.
17. An analyst compiles the following data for a company:
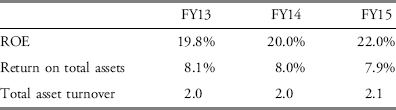
Based only on this information, the most appropriate conclusion is that, over the period FY13 to FY15, the company’s:
A. net profit margin and financial leverage have decreased.
B. net profit margin and financial leverage have increased.
C. net profit margin has decreased but its financial leverage has increased.
18. A decomposition of ROE for Integra SA is as follows:
| FY12 | FY11 | |
| ROE | 18.90% | 18.90% |
| Tax burden | 0.70 | 0.75 |
| Interest burden | 0.90 | 0.90 |
| EBIT margin | 10.00% | 10.00% |
| Asset turnover | 1.50 | 1.40 |
| Leverage | 2.00 | 2.00 |
Which of the following choices best describes reasonable conclusions an analyst might make based on this ROE decomposition?
A. Profitability and the liquidity position both improved in FY12.
B. The higher average tax rate in FY12 offset the improvement in profitability, leaving ROE unchanged.
C. The higher average tax rate in FY12 offset the improvement in efficiency, leaving ROE unchanged.
19. A decomposition of ROE for Company A and Company B is as follows:
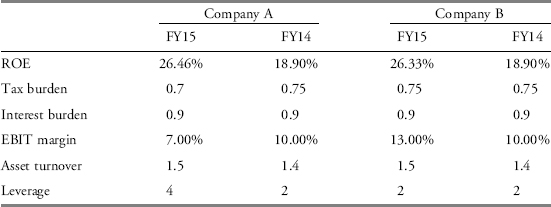
An analyst is most likely to conclude that:
A. Company A’s ROE is higher than Company B’s in FY15, and one explanation consistent with the data is that Company A may have purchased new, more efficient equipment.
B. Company A’s ROE is higher than Company B’s in FY15, and one explanation consistent with the data is that Company A has made a strategic shift to a product mix with higher profit margins.
C. The difference between the two companies’ ROE in FY15 is very small and Company A’s ROE remains similar to Company B’s ROE mainly due to Company A increasing its financial leverage.
20. What does the P/E ratio measure?
A. The “multiple” that the stock market places on a company’s EPS.
B. The relationship between dividends and market prices.
C. The earnings for one common share of stock.
21. A creditor most likely would consider a decrease in which of the following ratios to be positive news?
A. Interest coverage (times interest earned)
B. Debt to total assets
C. Return on assets
22. When developing forecasts, analysts should most likely:
A. develop possibilities relying exclusively on the results of financial analysis.
B. use the results of financial analysis, analysis of other information, and judgment.
C. aim to develop extremely precise forecasts using the results of financial analysis.