CHAPTER 9
INVENTORIES
After completing this chapter, you will be able to do the following:
- Distinguish between costs included in inventories and costs recognized as expenses in the period in which they are incurred.
- Describe different inventory valuation methods (cost formulas).
- Calculate and compare cost of sales, gross profit, and ending inventory using different inventory valuation methods and using periodic and perpetual inventory systems.
- Calculate and explain effects of inflation and deflation of inventory costs on the financial statements and ratios of companies that use different inventory valuation methods (cost formulas or cost flow assumptions).
- Explain LIFO reserve and LIFO liquidation and their effects on financial statements and ratios.
- Convert a company’s reported financial statements from LIFO to FIFO for purposes of comparison.
- Describe implications of valuing inventory at net realizable value for financial statements and ratios.
- Describe the financial statement presentation of and disclosures relating to inventories.
- Explain issues that analysts should consider when examining a company’s inventory disclosures and other sources of information.
- Analyze and compare the financial statements and ratios of companies, including those that use different inventory valuation methods.
- Inventories are a major factor in the analysis of merchandising and manufacturing companies. Such companies generate their sales and profits through inventory transactions on a regular basis. An important consideration in determining profits for these companies is measuring the cost of sales when inventories are sold.
- The total cost of inventories comprises all costs of purchase, costs of conversion, and other costs incurred in bringing the inventories to their present location and condition. Storage costs of finished inventory and abnormal costs due to waste are typically treated as expenses in the period in which they occurred.
- The allowable inventory valuation methods implicitly involve different assumptions about cost flows. The choice of inventory valuation method determines how the cost of goods available for sale during the period is allocated between inventory and cost of sales.
- IFRS allow three inventory valuation methods (cost formulas): first-in, first-out (FIFO); weighted average cost; and specific identification. The specific identification method is used for inventories of items that are not ordinarily interchangeable and for goods or services produced and segregated for specific projects. U.S. GAAP allow these three methods plus the last-in, first-out (LIFO) method. The LIFO method is widely used in the United States for both tax and financial reporting purposes because of potential income tax savings.
- The choice of inventory method affects the financial statements and any financial ratios that are based on them. As a consequence, the analyst must carefully consider inventory valuation method differences when evaluating a company’s performance over time or in comparison to industry data or industry competitors.
- A company must use the same cost formula for all inventories having a similar nature and use to the entity.
- The inventory accounting system (perpetual or periodic) may result in different values for cost of sales and ending inventory when the weighted average cost or LIFO inventory valuation method is used.
- Under U.S. GAAP, companies that use the LIFO method must disclose in their financial notes the amount of the LIFO reserve or the amount that would have been reported in inventory if the FIFO method had been used. This information can be used to adjust reported LIFO inventory and cost of goods sold balances to the FIFO method for comparison purposes.
- LIFO liquidation occurs when the number of units in ending inventory declines from the number of units that were present at the beginning of the year. If inventory unit costs have generally risen from year to year, this will produce an inventory-related increase in gross profits.
- Consistency of inventory costing is required under both IFRS and U.S. GAAP. If a company changes an accounting policy, the change must be justifiable and applied retrospectively to the financial statements. An exception to the retrospective restatement is when a company reporting under U.S. GAAP changes to the LIFO method.
- Under IFRS, inventories are measured at the lower of cost and net realizable value. Net realizable value is the estimated selling price in the ordinary course of business less the estimated costs necessary to make the sale. Under U.S. GAAP, inventories are measured at the lower of cost or market value. Market value is defined as current replacement cost subject to an upper limit of net realizable value and a lower limit of net realizable value less a normal profit margin. Reversals of previous write-downs are permissible under IFRS but not under U.S. GAAP.
- Reversals of inventory write-downs may occur under IFRS but are not allowed under U.S. GAAP.
- Changes in the carrying amounts within inventory classifications (such as raw materials, work-in-process, and finished goods) may provide signals about a company’s future sales and profits. Relevant information with respect to inventory management and future sales may be found in the Management Discussion and Analysis or similar items within the annual or quarterly reports, industry news and publications, and industry economic data.
- The inventory turnover ratio, number of days of inventory ratio, and gross profit margin ratio are useful in evaluating the management of a company’s inventory.
- Inventory management may have a substantial impact on a company’s activity, profitability, liquidity, and solvency ratios. It is critical for the analyst to be aware of industry trends and management’s intentions.
- Financial statement disclosures provide information regarding the accounting policies adopted in measuring inventories, the principal uncertainties regarding the use of estimates related to inventories, and details of the inventory carrying amounts and costs. This information can greatly assist analysts in their evaluation of a company’s inventory management.
1. Inventory cost is least likely to include:
A. production-related storage costs.
B. costs incurred as a result of normal waste of materials.
C. transportation costs of shipping inventory to customers.
2. Mustard Seed PLC adheres to IFRS. It recently purchased inventory for €100 million and spent €5 million for storage prior to selling the goods. The amount it charged to inventory expense (€ millions) was closest to:
A. €95.
B. €100.
C. €105.
3. Carrying inventory at a value above its historical cost would most likely be permitted if:
A. the inventory was held by a producer of agricultural products.
B. financial statements were prepared using U.S. GAAP.
C. the change resulted from a reversal of a previous write-down.
4. Eric’s Used Bookstore prepares its financial statements in accordance with IFRS. Inventory was purchased for £1 million and later marked down to £550,000. One of the books, however, was later discovered to be a rare collectible item, and the inventory is now worth an estimated £3 million. The inventory is most likely reported on the balance sheet at:
A. £550,000.
B. £1,000,000.
C. £3,000,000.
5. Fernando’s Pasta purchased inventory and later wrote it down. The current net realizable value is higher than the value when written down. Fernando’s inventory balance will most likely be:
A. higher if it complies with IFRS.
B. higher if it complies with U.S. GAAP.
C. the same under U.S. GAAP and IFRS.
For questions 6 through 17, assume the companies use a periodic inventory system.
6. Cinnamon Corp. started business in 2007 and uses the weighted average cost method. During 2007, it purchased 45,000 units of inventory at €10 each and sold 40,000 units for €20 each. In 2008, it purchased another 50,000 units at €11 each and sold 45,000 units for €22 each. Its 2008 cost of sales (€ thousands) was closest to:
A. €490.
B. €491.
C. €495.
7. Zimt AG started business in 2007 and uses the FIFO method. During 2007, it purchased 45,000 units of inventory at €10 each and sold 40,000 units for €20 each. In 2008, it purchased another 50,000 units at €11 each and sold 45,000 units for €22 each. Its 2008 ending inventory balance (€ thousands) was closest to:
A. €105.
B. €109.
C. €110.
8. Zimt AG uses the FIFO method, and Nutmeg Inc. uses the LIFO method. Compared to the cost of replacing the inventory, during periods of rising prices, the cost of sales reported by:
A. Zimt is too low.
B. Nutmeg is too low.
C. Nutmeg is too high.
9. Zimt AG uses the FIFO method, and Nutmeg Inc. uses the LIFO method. Compared to the cost of replacing the inventory, during periods of rising prices the ending inventory balance reported by:
A. Zimt is too high.
B. Nutmeg is too low.
C. Nutmeg is too high.
10. Like many technology companies, TechnoTools operates in an environment of declining prices. Its reported profits will tend to be highest if it accounts for inventory using the:
A. FIFO method.
B. LIFO method.
C. weighted average cost method.
11. Compared to using the weighted average cost method to account for inventory, during a period in which prices are generally rising, the current ratio of a company using the FIFO method would most likely be:
A. lower.
B. higher.
C. dependent upon the interaction with accounts payable.
12. Zimt AG wrote down the value of its inventory in 2007 and reversed the write-down in 2008. Compared to the ratios that would have been calculated if the write-down had never occurred, Zimt’s reported 2007:
A. current ratio was too high.
B. gross margin was too high.
C. inventory turnover was too high.
13. Zimt AG wrote down the value of its inventory in 2007 and reversed the write-down in 2008. Compared to the results the company would have reported if the write-down had never occurred, Zimt’s reported 2008:
A. profit was overstated.
B. cash flow from operations was overstated.
C. year-end inventory balance was overstated.
14. Compared to a company that uses the FIFO method, during periods of rising prices a company that uses the LIFO method will most likely appear more:
A. liquid.
B. efficient.
C. profitable.
15. Nutmeg Inc. uses the LIFO method to account for inventory. During years in which inventory unit costs are generally rising and in which the company purchases more inventory than it sells to customers, its reported gross profit margin will most likely be:
A. lower than it would be if the company used the FIFO method.
B. higher than it would be if the company used the FIFO method.
C. about the same as it would be if the company used the FIFO method.
16. Compared to using the FIFO method to account for inventory, during periods of rising prices, a company using the LIFO method is most likely to report higher:
A. net income.
B. cost of sales.
C. income taxes.
17. Carey Company adheres to U.S. GAAP, whereas Jonathan Company adheres to IFRS. It is least likely that:
A. Carey has reversed an inventory write-down.
B. Jonathan has reversed an inventory write-down.
C. Jonathan and Carey both use the FIFO inventory accounting method.
The following information relates to Questions 18 through 25.1
Hans Annan, CFA, a food and beverage analyst, is reviewing Century Chocolate’s inventory policies as part of his evaluation of the company. Century Chocolate, based in Switzerland, manufactures chocolate products and purchases and resells other confectionery products to complement its chocolate line. Annan visited Century Chocolate’s manufacturing facility last year. He learned that cacao beans, imported from Brazil, represent the most significant raw material and that the work-in-progress inventory consists primarily of three items: roasted cacao beans, a thick paste produced from the beans (called chocolate liquor), and a sweetened mixture that needs to be “conched” to produce chocolate. On the tour, Annan learned that the conching process ranges from a few hours for lower-quality products to six days for the highest-quality chocolates. While there, Annan saw the facility’s climate-controlled area where manufactured finished products (cocoa and chocolate) and purchased finished goods are stored prior to shipment to customers. After touring the facility, Annan had a discussion with Century Chocolate’s CFO regarding the types of costs that were included in each inventory category.
Annan has asked his assistant, Joanna Kern, to gather some preliminary information regarding Century Chocolate’s financial statements and inventories. He also asked Kern to calculate the inventory turnover ratios for Century Chocolate and another chocolate manufacturer for the most recent five years. Annan does not know Century Chocolate’s most direct competitor, so he asks Kern to do some research and select the most appropriate company for the ratio comparison.
Kern reports back that Century Chocolate prepares its financial statements in accordance with IFRS. She tells Annan that the policy footnote states that raw materials and purchased finished goods are valued at purchase cost whereas work in progress and manufactured finished goods are valued at production cost. Raw material inventories and purchased finished goods are accounted for using the FIFO (first-in, first-out) method, and the weighted average cost method is used for other inventories. An allowance is established when the net realizable value of any inventory item is lower than the value calculated.
Kern provides Annan with the selected financial statements and inventory data for Century Chocolate shown in Exhibits A through E. The ratio exhibit Kern prepared compares Century Chocolate’s inventory turnover ratios to those of Gordon’s Goodies, a U.S.-based company. Annan returns the exhibit and tells Kern to select a different competitor that reports using IFRS rather than U.S. GAAP. During this initial review, Annan asks Kern why she has not indicated whether Century Chocolate uses a perpetual or a periodic inventory system. Kern replies that she learned that Century Chocolate uses a perpetual system but did not include this information in her report because inventory values would be the same under either a perpetual or periodic inventory system. Annan tells Kern she is wrong and directs her to research the matter.
EXHIBIT A Century Chocolate Income Statements (CHF millions)
| For Years Ended 31 December | 2009 | 2008 |
| Sales | 95,290 | 93,248 |
| Cost of sales | −41,043 | −39,047 |
| Marketing, administration, and other expenses | −35,318 | −42,481 |
| Profit before taxes | 18,929 | 11,720 |
| Taxes | −3,283 | −2,962 |
| Profit for the period | 15,646 | 8,758 |
EXHIBIT B Century Chocolate Balance Sheets (CHF millions)
| For Years Ended 31 December | 2009 | 2008 |
| Cash, cash equivalents, and short-term investments | 6,190 | 8,252 |
| Trade receivables and related accounts, net | 11,654 | 12,910 |
| Inventories, net | 8,100 | 7,039 |
| Other current assets | 2,709 | 2,812 |
| Total current assets | 28,653 | 31,013 |
| Property, plant, and equipment, net | 18,291 | 19,130 |
| Other noncurrent assets | 45,144 | 49,875 |
| Total assets | 92,088 | 100,018 |
| Trade and other payables | 10,931 | 12,299 |
| Other current liabilities | 17,873 | 25,265 |
| Total current liabilities | 28,804 | 37,564 |
| Noncurrent liabilities | 15,672 | 14,963 |
| Total liabilities | 44,476 | 52,527 |
| Equity | ||
| Share capital | 332 | 341 |
| Retained earnings and other reserves | 47,280 | 47,150 |
| Total equity | 47,612 | 47,491 |
| Total liabilities and shareholders’ equity | 92,088 | 100,018 |
EXHIBIT C Century Chocolate Supplementary Footnote Disclosures: Inventories (CHF millions)
| For Years Ended 31 December | 2009 | 2008 |
| Raw Materials | 2,154 | 1,585 |
| Work in Progress | 1,061 | 1,027 |
| Finished Goods | 5,116 | 4,665 |
| Total inventories before allowance | 8,331 | 7,277 |
| Allowance for write-downs to net realizable value | −231 | −238 |
| Total inventories net of allowance | 8,100 | 7,039 |
EXHIBIT D Century Chocolate Inventory Record for Purchased Lemon Drops
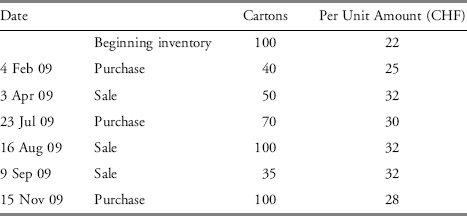
EXHIBIT E Century Chocolate Net Realizable Value Information for Black Licorice Jelly Beans
| 2009 | 2008 | |
| FIFO cost of inventory at 31 December (CHF) | 314,890 | 374,870 |
| Ending inventory at 31 December (Kilograms) | 77,750 | 92,560 |
| Cost per kilogram (CHF) | 4.05 | 4.05 |
| Net Realizable Value (CHF per Kilogram) | 4.20 | 3.95 |
While Kern is revising her analysis, Annan reviews the most recent month’s Cocoa Market Review from the International Cocoa Organization. He is drawn to the statement that “the ICCO daily price, averaging prices in both futures markets, reached a 29-year high in US$ terms and a 23-year high in SDRs terms (the SDR unit comprises a basket of major currencies used in international trade: US$, Euro, Pound Sterling and Yen).” Annan makes a note that he will need to factor the potential continuation of this trend into his analysis.
18. The costs least likely to be included by the CFO as inventory are:
A. storage costs for the chocolate liquor.
B. excise taxes paid to the government of Brazil for the cacao beans.
C. storage costs for chocolate and purchased finished goods awaiting shipment to customers.
19. What is the most likely justification for Century Chocolate’s choice of inventory valuation method for its finished goods?
A. It is the preferred method under IFRS.
B. It allocates the same per unit cost to both cost of sales and inventory.
C. Ending inventory reflects the cost of goods purchased most recently.
20. In Kern’s comparative ratio analysis, the 2009 inventory turnover ratio for Century Chocolate is closest to:
A. 5.07.
B. 5.42.
C. 5.55.
21. The most accurate statement regarding Annan’s reasoning for requiring Kern to select a competitor that reports under IFRS for comparative purposes is that under U.S. GAAP:
A. fair values are used to value inventory.
B. the LIFO method is permitted to value inventory.
C. the specific identification method is permitted to value inventory.
22. Annan’s statement regarding the perpetual and periodic inventory systems is most significant when which of the following costing systems is used?
A. LIFO.
B. FIFO.
C. Specific identification.
23. Using the inventory record for purchased lemon drops shown in Exhibit D, the cost of sales for 2009 will be closest to:
A. CHF 3,550.
B. CHF 4,550.
C. CHF 4,850.
24. Ignoring any tax effect, the 2009 net realizable value reassessment for the black licorice jelly beans will most likely result in:
A. an increase in gross profit of CHF 9,256.
B. an increase in gross profit of CHF 11,670.
C. no impact on cost of sales because under IFRS, write-downs cannot be reversed.
25. If the trend noted in the ICCO report continues and Century Chocolate plans to maintain constant or increasing inventory quantities, the most likely impact on Century Chocolate’s financial statements related to its raw materials inventory will be:
A. a cost of sales that more closely reflects current replacement values.
B. a higher allocation of the total cost of goods available for sale to cost of sales.
C. a higher allocation of the total cost of goods available for sale to ending inventory.
The following information relates to Questions 26 through 31.2
John Martinson, CFA, is an equity analyst with a large pension fund. His supervisor, Linda Packard, asks him to write a report on Karp Inc. Karp prepares its financial statements in accordance with U.S. GAAP. Packard is particularly interested in the effects of the company’s use of the LIFO method to account for its inventory. For this purpose, Martinson collects the financial data presented in Exhibits F and G.
EXHIBIT F Balance Sheet Information (US$ millions)
| As of 31 December | 2009 | 2008 |
| Cash and cash equivalents | 172 | 157 |
| Accounts receivable | 626 | 458 |
| Inventories | 620 | 539 |
| Other current assets | 125 | 65 |
| Total current assets | 1,543 | 1,219 |
| Property and equipment, net | 3,035 | 2,972 |
| Total assets | 4,578 | 4,191 |
| Total current liabilities | 1,495 | 1,395 |
| Long-term debt | 644 | 604 |
| Total liabilities | 2,139 | 1,999 |
| Common stock and paid in capital | 1,652 | 1,652 |
| Retained earnings | 787 | 540 |
| Total shareholders’ equity | 2,439 | 2,192 |
| Total liabilities and shareholders’ equity | 4,578 | 4,191 |
EXHIBIT G Income Statement Information (US$ millions)
| For Years Ended 31 December | 2009 | 2008 |
| Sales | 4,346 | 4,161 |
| Cost of goods sold | 2,211 | 2,147 |
| Depreciation and amortization expense | 139 | 119 |
| Selling, general, and administrative expense | 1,656 | 1,637 |
| Interest expense | 31 | 18 |
| Income tax expense | 62 | 48 |
| Net income | 247 | 192 |
Martinson finds the following information in the notes to the financial statements:
- The LIFO reserves as of 31 December 2009 and 2008 are $155 million and $117 million respectively; and
- The effective income tax rate applicable to Karp for 2009 and earlier periods is 20%.
26. If Karp had used FIFO instead of LIFO, the amount of inventory reported as of 31 December 2009 would have been closest to:
A. $465 million.
B. $658 million.
C. $775 million.
27. If Karp had used FIFO instead of LIFO, the amount of cost of goods sold reported by Karp for the year ended 31 December 2009 would have been closest to:
A. $2,056 million.
B. $2,173 million.
C. $2,249 million.
28. If Karp had used FIFO instead of LIFO, its reported net income for the year ended 31 December 2009 would have been higher by an amount closest to:
A. $30 million.
B. $38 million.
C. $155 million.
29. If Karp had used FIFO instead of LIFO, Karp’s retained earnings as of 31 December 2009 would have been higher by an amount closest to:
A. $117 million.
B. $124 million.
C. $155 million.
30. If Karp had used FIFO instead of LIFO, which of the following ratios computed as of 31 December 2009 would most likely have been lower?
A. cash ratio
B. current ratio
C. gross profit margin
31. If Karp had used FIFO instead of LIFO, its debt to equity ratio computed as of 31 December 2009 would have:
A. increased.
B. decreased.
C. remained unchanged.
The following information relates to Questions 32 through 37.3
Robert Groff, an equity analyst, is preparing a report on Crux Corp. As part of his report, Groff makes a comparative financial analysis between Crux and its two main competitors, Rolby Corp. and Mikko Inc. Crux and Mikko report under U.S. GAAP and Rolby reports under IFRS.
Groff gathers information on Crux, Rolby, and Mikko. The relevant financial information he compiles is in Exhibit H. Some information on the industry is in Exhibit I.
EXHIBIT H Selected Financial Information (US$ millions)
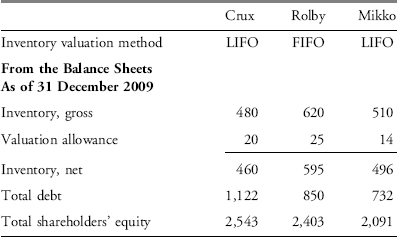
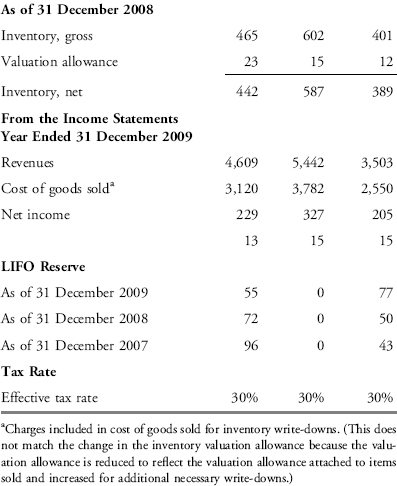
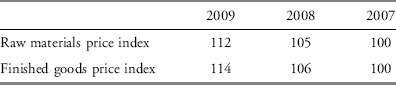
EXHIBIT I Industry Information
To compare the financial performance of the three companies, Groff decides to convert LIFO figures into FIFO figures, and adjust figures to assume no valuation allowance is recognized by any company.
After reading Groff’s draft report, his supervisor, Rachel Borghi, asks him the following questions:
Question 1: Which company’s gross profit margin would best reflect current costs of the industry?
Question 2: Would Rolby’s valuation method show a higher gross profit margin than Crux’s under an inflationary, a deflationary, or a stable price scenario?
Question 3: Which group of ratios usually appears more favorable with an inventory write-down?
32. Crux’s inventory turnover ratio computed as of 31 December 2009, after the adjustments suggested by Groff, is closest to:
A. 5.67.
B. 5.83.
C. 6.13.
33. Rolby’s net profit margin for the year ended 31 December 2009, after the adjustments suggested by Groff, is closest to:
A. 6.01%.
B. 6.20%.
C. 6.28%.
34. Compared with its unadjusted debt-to-equity ratio, Mikko’s debt-to-equity ratio as of 31 December 2009, after the adjustments suggested by Groff, is:
A. lower.
B. higher.
C. the same.
35. The best answer to Borghi’s Question 1 is:
A. Crux’s.
B. Rolby’s.
C. Mikko’s.
36. The best answer to Borghi’s Question 2 is:
A. stable.
B. inflationary.
C. deflationary.
37. The best answer to Borghi’s Question 3 is:
A. Activity ratios.
B. Solvency ratios.
C. Profitability ratios.
The following information relates to Questions 38 through 45.4
ZP Corporation is a (hypothetical) multinational corporation headquartered in Japan that trades on numerous stock exchanges. ZP prepares its consolidated financial statements in accordance with U.S. GAAP. Excerpts from ZP’s 2009 annual report are shown in Exhibits J–L.
EXHIBIT J Consolidated Balance Sheets (¥ millions)
| Year Ended 31 December | 2008 | 2009 |
| Current assets | ||
| Cash and cash equivalents | ¥542,849 | ¥814,760 |
| Inventories | 608,572 | 486,465 |
| Total current assets | 4,028,742 | 3,766,309 |
| Total assets | ¥10,819,440 | ¥9,687,346 |
| Total current liabilities | ¥3,980,247 | ¥3,529,765 |
| Total long-term liabilities | 2,663,795 | 2,624,002 |
| Minority interest in consolidated subsidiaries | 218,889 | 179,843 |
| Total shareholders’ equity | 3,956,509 | 3,353,736 |
| Total liabilities and shareholders’ equity | ¥10,819,440 | ¥9,687,346 |
EXHIBIT K Consolidated Statements of Income (¥ millions)
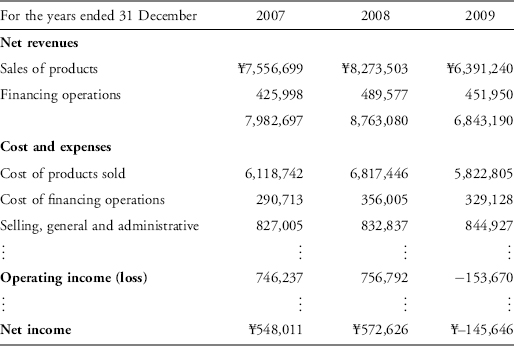
EXHIBIT L Selected Disclosures in the 2009 Annual Report
Management’s Discussion and Analysis of Financial Condition and Results of Operations
“Cost reduction efforts were offset by increased prices of raw materials, other production materials and parts.” . . . “Inventories decreased during fiscal 2009 by ¥122.1 billion, or 20.1%, to ¥486.5 billion. This reflects the impacts of decreased sales volumes and fluctuations in foreign currency translation rates.”
Management and Corporate Information
Risk Factors
Industry and Business Risks
The worldwide market for our products is highly competitive. ZP faces intense competition from other manufacturers in the respective markets in which it operates. Competition has intensified due to the worldwide deterioration in economic conditions. In addition, competition is likely to further intensify because of continuing globalization, possibly resulting in industry reorganization. Factors affecting competition include product quality and features, the amount of time required for innovation and development, pricing, reliability, safety, economy in use, customer service, and financing terms. Increased competition may lead to lower unit sales and excess production capacity and excess inventory. This may result in a further downward price pressure.
ZP’s ability to adequately respond to the recent rapid changes in the industry and to maintain its competitiveness will be fundamental to its future success in maintaining and expanding its market share in existing and new markets.
Notes to Consolidated Financial Statements
2. Summary of significant accounting policies:
Inventories. Inventories are valued at cost, not in excess of market. Cost is determined on the “average-cost” basis, except for the cost of finished products carried by certain subsidiary companies which is determined “last-in, first-out” (“LIFO”) basis. Inventories valued on the LIFO basis totaled ¥94,578 million and ¥50,037 million at 31 December 2008 and 2009, respectively. Had the “first-in, first-out” basis been used for those companies using the LIFO basis, inventories would have been ¥10,120 million and ¥19,660 million higher than reported at 31 December 2008 and 2009, respectively.
9. Inventories:
Inventories consist of the following:
| Year Ended 31 December (Yen in millions) | 2008 | 2009 |
| Finished goods | ¥403,856 | ¥291,977 |
| Raw materials | 99,869 | 85,966 |
| Work in process | 79,979 | 83,890 |
| Supplies and other | 24,868 | 24,632 |
| ¥608,572 | ¥486,465 |
38. The MD&A indicated that the prices of raw material, other production materials, and parts increased. Based on the inventory valuation methods described in Note 2, which inventory classification would least accurately reflect current prices?
A. Raw materials
B. Finished goods
C. Work in process
39. The 2008 inventory value as reported on the 2009 consolidated balance sheet if the company had used the FIFO inventory valuation method instead of the LIFO inventory valuation method for a portion of its inventory would be closest to:
A. ¥104,698 million.
B. ¥506,125 million.
C. ¥618,692 million.
40. What is the least likely reason why ZP may need to change its accounting policies regarding inventory at some point after 2009?
A. The U.S. SEC is likely to require companies to use the same inventory valuation method for all inventories.
B. The U.S. SEC is likely to prohibit the use of one of the methods ZP currently uses for inventory valuation.
C. One of the inventory valuation methods used for U.S. tax purposes may be repealed as an acceptable method.
41. If ZP had prepared its financial statement in accordance with IFRS, the inventory turnover ratio (using average inventory) for 2009 would be:
A. lower.
B. higher.
C. the same.
42. Inventory levels decreased from 2008 to 2009 for all of the following reasons except:
A. LIFO liquidation.
B. sales volume decreased.
C. fluctuations in foreign currency translation rates.
43. Which observation is most likely a result of looking only at the information reported in Note 9?
A. Increased competition has led to lower unit sales.
B. There have been significant price increases in supplies.
C. Management expects a further downturn in sales during 2010.
44. Note 2 indicates that, “Inventories valued on the LIFO basis totaled ¥94,578 million and ¥50,037 million at 31 December 2008 and 2009, respectively.” Based on this, the LIFO reserve should most likely:
A. increase.
B. decrease.
C. remain the same.
45. The Industry and Business Risk excerpt states that, “Increased competition may lead to lower unit sales and excess production capacity and excess inventory. This may result in a further downward price pressure.” The downward price pressure could lead to inventory that is valued above current market prices or net realizable value. Any write-downs of inventory are least likely to have a significant effect on the inventory valued using:
A. weighted average cost.
B. first-in, first-out (FIFO).
C. last-in, first-out (LIFO).
1 Item set developed by Karen O’Connor Rubsam, CFA (Fountain Hills, AZ, U.S.A.).
2 Item set developed by Rodrigo Ribeiro, CFA (Montevideo, Uruguay).
3 Item set developed by Rodrigo Ribeiro, CFA (Montevideo, Uruguay).
4 Item set developed by Karen O’Connor Rubsam, CFA (Fountain Hills, Arizona, U.S.A.).