
15. JavaFX Charts
Before JavaFX, Swing developers had to rely on third-party libraries for chart components. Now that JavaFX is part of the JDK, developers can use the JavaFX Charts API to visualize data in their applications. And with the NetBeans Platform, you have the beauty of JavaFX charts and the architectural advantages of a sophisticated framework that lets you build applications with integrated JavaFX and Swing content.
This chapter shows you how to use the JavaFX Charts API with the NetBeans Platform. You’ll learn how to create modular, loosely-coupled applications that display data with a wide variety of chart types in separate windows. You’ll also learn how to apply JavaFX features such as animation, effects, and event handling to enhance your application.
What You Will Learn
• Use JavaFX charts in a NetBeans Platform application.
• Structure modules that display chart data.
• Structure a NetBeans Platform application with multiple chart windows, keeping chart modules and data loosely coupled.
• Create a service provider for modules to access chart data from the Global Services Lookup.
• Explore each JavaFX chart.
• Style JavaFX charts with CSS.
• Add effects, animations, and event handlers to charts or individual display artifacts within a chart.
• Enable data editing in a Swing JTable or JavaFX chart window, and propagate these data changes throughout the application.
• Use binding to keep JavaFX controls synchronized.
• Create a NetBeans Platform conditionally-enabled action that applies to JavaFX chart windows.
• Save a chart window (or any window with JavaFX content) to a PNG-format file.
• Print a TopComponent window.
15.1 JavaFX Charts and the NetBeans Platform
Let’s begin by showing you JavaFX charts in the context of a NetBeans Platform application. The JavaFX Chart package currently provides eight different charts to visualize data. Our example, the SmartPhone Data application, provides a set of sales data for smartphone companies over a four-year period. Each company’s data is a series represented by a row in a table, and each year of data corresponds to a table column.
Before we discuss how JavaFX handles chart data, let’s describe the application and its features.
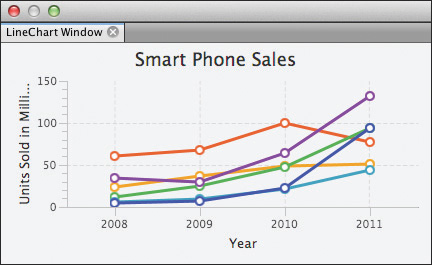
Figure 15.1 shows the SmartPhone Data application (called the SDA) running. There are ten windows in total. Nine windows contain JavaFX charts, and the tenth window displays the raw data in table form (the lower-right window). You can edit the data in the table, and edits are propagated to the other chart windows. When you change JavaFX chart data, the charts use animation to redraw their contents. These changes may also reposition the chart legend and rescale the chart.
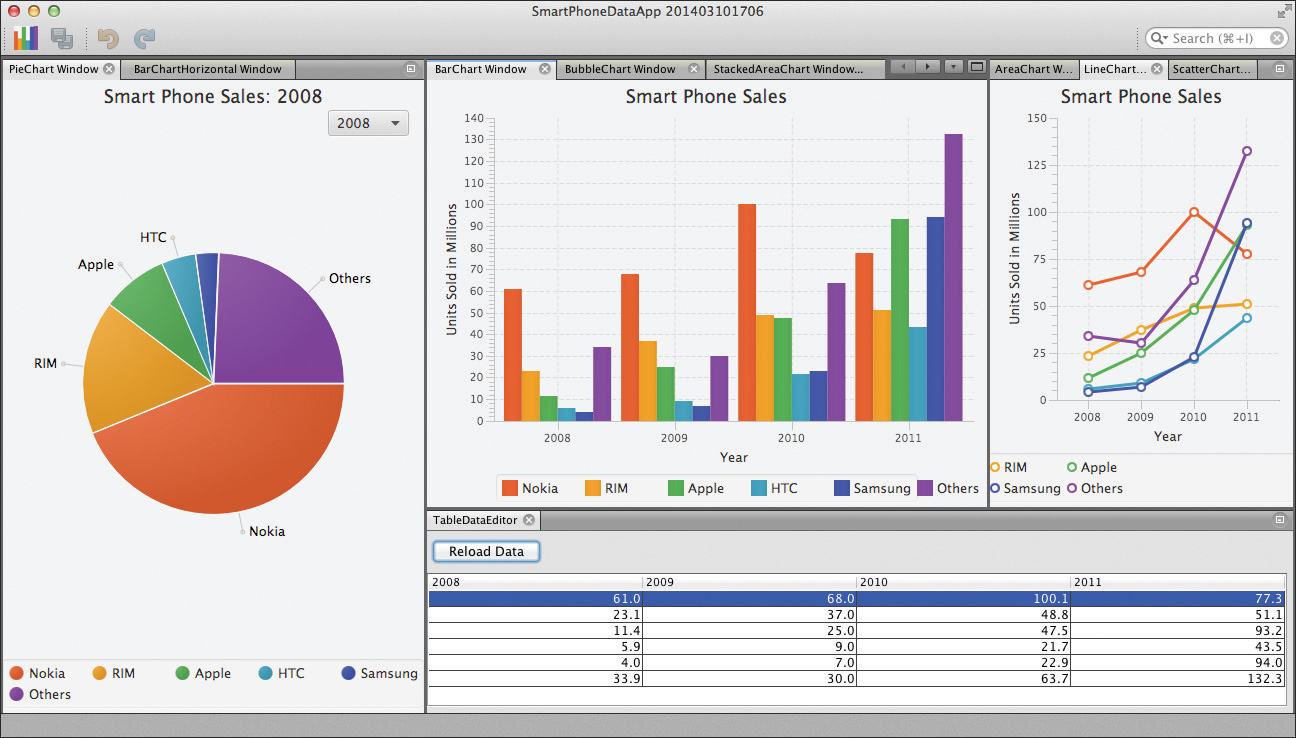
Visible chart windows in Figure 15.1 include the Pie Chart (on the left), Bar Chart (top center), and Line Chart (top right).
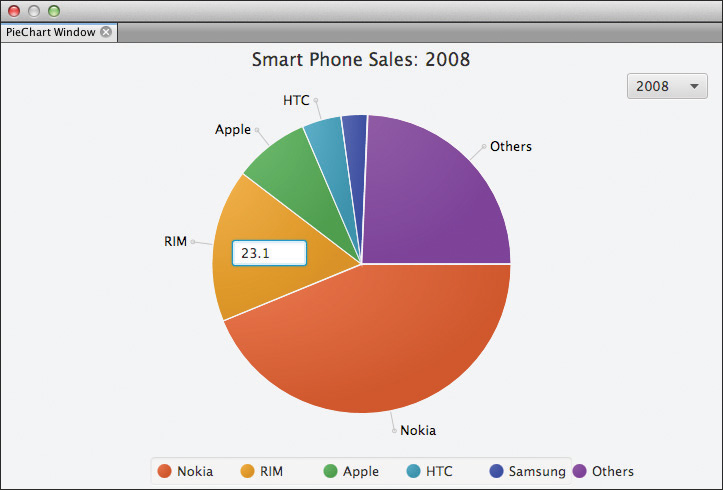
JavaFX charts are rendered as nodes in the scene graph. This means you can apply effects and add animations to charts. You can also manipulate the scene graph. Figure 15.2 shows two examples with Pie Chart windows. The left window depicts a selected wedge animating outward. The percentage represented by the selected wedge is shown in a label that fades in during the wedge animation. The right window shows a JavaFX TextField that displays the value of the selected wedge. The TextField appears with a control mouse-click event over a pie slice. When the user provides a new number, the change updates the other charts and the table.
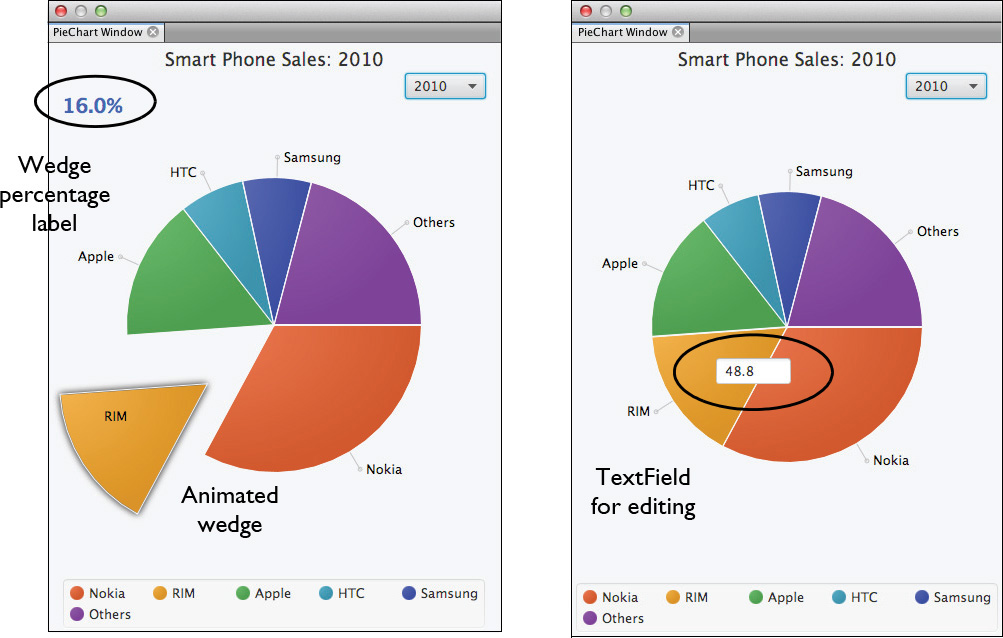
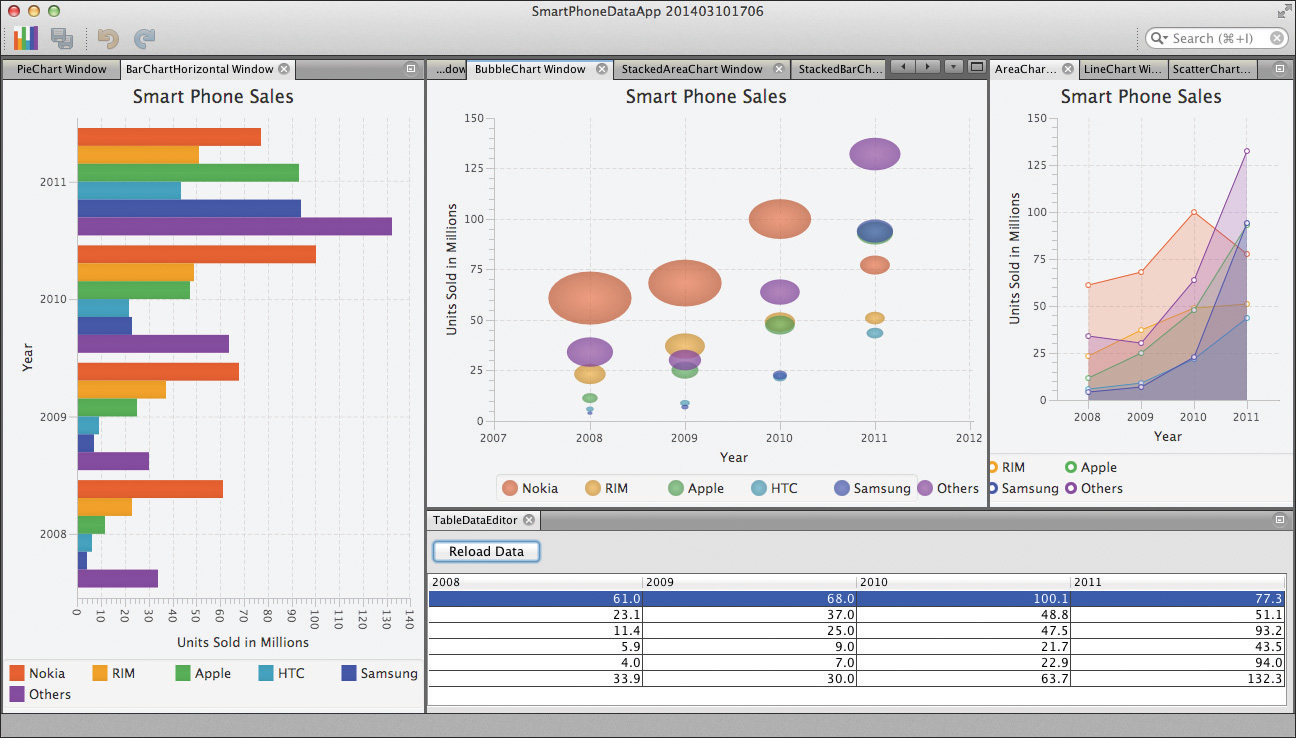
Figure 15.3 shows another set of windows, including a horizontal Bar Chart on the left, a Bubble Chart in the center, and an Area Chart in the top-right window.
The user can edit the raw data in the TableDataEditor window or in the PieChart window. The user can also restore the original data with the Reload Data button, print a chart window, or save any chart to disk as a PNG file.
Application Overview
The SDA is organized into modules, with each chart in a separate module. The TableDataEditor is also in its own module. Each module accesses the data with a Global Lookup using a customized version of Swing AbstractTableModel (MyTableDataModel). To work with a different set of data, you would extend MyTableDataModel and include your own data. Different service providers for MyTableDataModel can obtain the data from other sources, such as a web service or database. Figure 15.4 shows the relationship of the modules in the SDA.
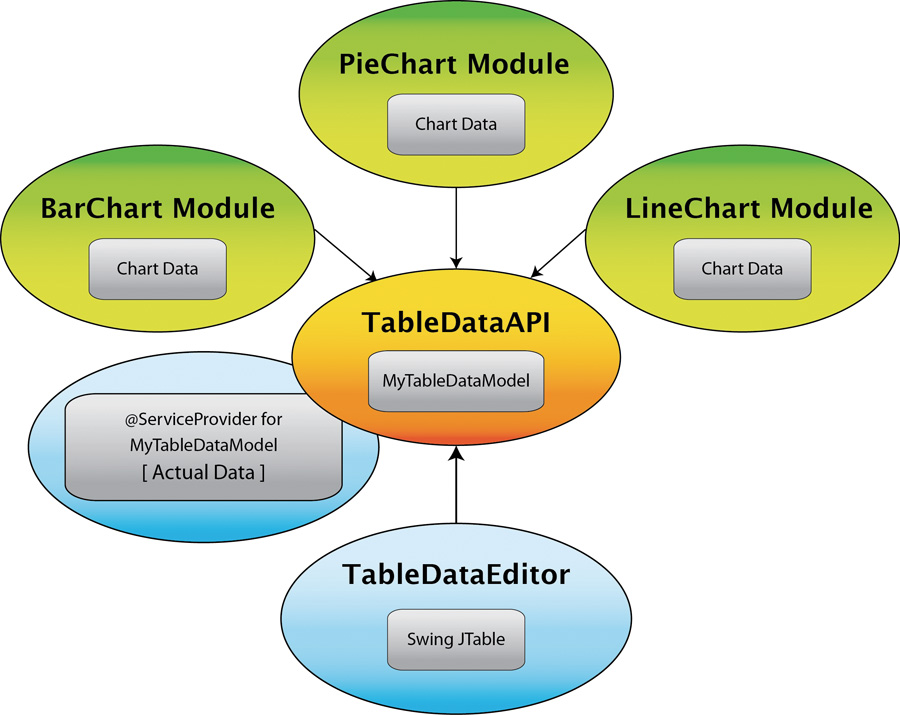
The TableDataAPI module exposes MyTableDataModel, a specialized TableModel class that other modules access through the Global Lookup. The TableDataEditor displays a window with the data in table form. Each chart module accesses the data by obtaining the service provider for MyTableDataModel through the Global Lookup.
The JavaFX chart modules all use FXML for chart controls and a corresponding JavaFX controller class that builds the chart data. When the data changes, the table model implementation fires a Swing TableModelEvent, allowing registered listeners to respond. Each JavaFX controller class implements a TableModelListener to respond to user edits of the table data.
Steps to Build the SmartPhone Data Application
Let’s summarize the steps required to build the SmartPhone Data application. The summarized application structure shows you how a NetBeans Platform application can effectively use the JavaFX chart controls to visualize data. We’ll discuss the individual modules in more detail throughout this chapter.
• Create a new NetBeans Platform application called SmartPhoneDataApp.
• Create a TableDataAPI module and add it to the SmartPhoneDataApp application. Create abstract Java class MyTableDataModel to extend AbstractTableModel. Make MyTableDataModel’s enclosing package public so that other modules can add a module dependency on the TableDataAPI module.
• Create a SmartPhoneDataImpl module and set a module dependency on the TableDataAPI module. Create concrete Java class SmartPhoneDataImpl that extends MyTableDataModel. Install the data and provide implementations for the methods in AbstractTableData and MyTableDataModel. Register SmartPhoneDataImpl as a @ServiceProvider for MyTableDataModel.
• Create a TableDataEditor module and set a module dependency on the TableDataAPI module. Create a TopComponent window. Add a JTable and a Reload Data button. Initialize the JTable using the Global Lookup to access the data.
• Create modules for each of the JavaFX charts. Include separate modules for a Bar Chart displayed vertically and horizontally. Set module dependencies on the TableDataAPI module. Create TopComponent windows, FXML files, and JavaFX controller classes for each module. Initialize the JavaFX chart controls using the Global Lookup to access the data. Enable printing for the TopComponents.
• Add special behaviors to the JavaFX chart controller classes as you like. We discuss features added to the PieChart module.
• Create a ChartUtilities module and add a conditionally-enabled action that saves the selected chart window to a file on disk. Implement the ChartSaveCapability in each TopComponent to provide the support code for saving a chart.
Working with AbstractTableModel
Access to table data in Swing requires the TableModel interface, which provides methods for manipulating table data. The AbstractTableModel class provides default implementations for most of the methods in the TableModel interface. This abstract class manages listeners and provides methods for generating TableModelEvents, which are then dispatched to registered listeners. With AbstractTableModel you must provide implementations minimally for the getRowCount(), getColumnCount(), and getValueAt() methods.
The MyTableDataModel abstract class has methods for extracting additional information to decorate JavaFX charts. The information includes a title, category names (names assigned to each data series), and descriptive labels for the data. Additionally, the getOriginalData() method restores the data to the original values, which lets users experiment with different data values.
The MyTableDataModel class extends AbstractTableModel and is the service provider target class for accessing the application’s data. We add this class, shown in Listing 15.1, to the TableDataAPI module’s public package.
Listing 15.1 MyTableDataModel.java
public abstract class MyTableDataModel extends AbstractTableModel {
public abstract Object[][] getOriginalData();
public abstract double getTickUnit();
public abstract List<String> getColumnNames();
public abstract List<String> getCategoryNames();
public abstract int getCategoryCount();
public abstract String getCategoryName(int row);
public abstract String getDataDescription();
public abstract String getNameDescription();
public abstract String getTitle();
}
Listing 15.2 shows the SmartPhoneDataImpl class, which provides a concrete extension of the MyTableDataModel abstract class. We install this class in the SmartPhoneDataImpl module and register the class as a service provider for MyTableDataModel.
The names and categories String arrays provide labels for the data columns and category names. Similarly, the dataDescription and nameDescription Strings provide legend labels. The title String provides the title text.
The actual data is a two-dimensional Object array used by TableModel. The clone() method makes a deep copy of the original data for later retrieval.
The SmartPhoneDataImpl class implements the public methods from MyTableDataModel (see Listing 15.1) and the methods required by AbstractTableModel. The isCellEditable() method returns true, allowing user updates. The setValueAt() method updates the data and fires a table cell updated event. (The AbstractTableModel class handles listener registration and event dispatching.)
Since the data is configured with the Swing TableModel, the Swing JTable component can use this class directly. The JavaFX charts, however, need to extract the data and inject them into the required JavaFX charts observable collections.1
1. SmartPhone sales data sources: Year 2008: Gartner (March 2009); Year 2009: Tomi Ahonen (April 2010); Years 2010 and 2011: IDC (February 2012).
Listing 15.2 SmartPhoneDataImpl.java
@ServiceProvider(service = MyTableDataModel.class)
public class SmartPhoneDataImpl extends MyTableDataModel {
private final String[] names = {"2008", "2009", "2010", "2011"};
private final String[] categories =
{"Nokia", "RIM", "Apple", "HTC", "Samsung", "Others"};
private final String dataDescription = "Units Sold in Millions";
private final String nameDescription = "Year";
private final String title = "Smart Phone Sales";
private final Object[][] data = {
// Sources:
// 2008: Gartner (March 2009)
// 2009: Tomi Ahonen (April 2010)
// 2010, 2011: IDC (February 2012)
// Nokia
{61.0, 68.0, 100.1, 77.3},
// ResearchInMotion
{23.1, 37.0, 48.8, 51.1},
// Apple
{11.4, 25.0, 47.5, 93.2},
// HTC
{5.9, 9.0, 21.7, 43.5},
// Samsung
{4.0, 7.0, 22.9, 94.0},
// Others
{33.9, 30.0, 63.7, 132.3}
};
private final Object[][] orig = clone(data);
// provide deep copy semantics
private static Object[][] clone(Object[][] g) {
Object[][] newArray = new Object[g.length][];
for (int i = 0; i < g.length; i++) {
newArray[i] = new Object[g[i].length];
System.arraycopy(g[i], 0, newArray[i], 0, g[i].length);
}
return newArray;
}
@Override
public final Object[][] getOriginalData() {
return orig;
}
@Override
public double getTickUnit() {
return 1000;
}
@Override
public List<String> getColumnNames() {
return Arrays.asList(names);
}
// Add support for Category Names
@Override
public List<String> getCategoryNames() {
return Arrays.asList(categories);
}
@Override
public int getCategoryCount() {
return getRowCount();
}
@Override
public String getCategoryName(int row) {
return categories[row];
}
@Override
public String getDataDescription() {
return dataDescription;
}
@Override
public String getNameDescription() {
return nameDescription;
}
@Override
public String getTitle() {
return title;
}
@Override
public int getRowCount() {
return data.length;
}
@Override
public int getColumnCount() {
return names.length;
}
@Override
public Object getValueAt(int row, int column) {
return data[row][column];
}
@Override
public String getColumnName(int column) {
return names[column];
}
@Override
public Class<?> getColumnClass(int columnIndex) {
return getValueAt(0, columnIndex).getClass();
}
@Override
public boolean isCellEditable(int row, int column) {
return true;
}
@Override
public void setValueAt(Object value, int row, int column) {
if (value instanceof Double) {
data[row][column] = (Double) value;
}
fireTableCellUpdated(row, column);
}
}
Working with Swing JTable
The TableDataEditor module includes a TopComponent configured in the output mode. This window appears in the lower-right location as shown in Figure 15.1 on page 745. The TopComponent has a Swing JTable that displays the raw data and a Data Reload button to restore the original data values from the clone array.
Listing 15.3 shows the TopComponent registration and initialization code for the TableDataEditorTopComponent class. The constructor initializes the tableModel field with the MyTableModelData service provider from the Global Lookup. The TopComponent includes custom initialization code to set the JTable component model property with this data.
Listing 15.3 TableDataEditorTopComponent.java—Initialization Code
@ConvertAsProperties(
dtd = "-//org.smartphone.data.editor//TableDataEditor//EN",
autostore = false
)
@TopComponent.Description(
preferredID = "TableDataEditorTopComponent",
iconBase = "org/smartphone/tabledata/editor/line_chart.png",
persistenceType = TopComponent.PERSISTENCE_ALWAYS
)
@TopComponent.Registration(mode = "output", openAtStartup = true)
@ActionID(category = "Window",
id = "org.smartphone.tabledata.editor.TableDataEditorTopComponent")
@ActionReference(path = "Menu/Window" /*, position = 333 */)
@TopComponent.OpenActionRegistration(
displayName = "#CTL_TableDataEditorAction",
preferredID = "TableDataEditorTopComponent"
)
@Messages({
"CTL_TableDataEditorAction=TableDataEditor",
"CTL_TableDataEditorTopComponent=TableDataEditor",
"HINT_TableDataEditorTopComponent=This is a TableDataEditor window"
})
public final class TableDataEditorTopComponent extends TopComponent {
private static MyTableDataModel tableModel;
private static final Logger logger = Logger.getLogger(
TableDataEditorTopComponent.class.getName());
public TableDataEditorTopComponent() {
// initialize tableModel before invoking initComponents()
tableModel = Lookup.getDefault().lookup(MyTableDataModel.class);
if (tableModel == null ) {
logger.log(Level.SEVERE, "Cannot get TableModel object");
LifecycleManager.getDefault().exit();
}
initComponents();
setName(Bundle.CTL_TableDataEditorTopComponent());
setToolTipText(Bundle.HINT_TableDataEditorTopComponent());
// setup the JTable
init();
}
// Generated code to initialize the components
private void initComponents() {
reloadButton = new javax.swing.JButton();
jScrollPane1 = new javax.swing.JScrollPane();
table = new javax.swing.JTable();
. . .
table.setModel(tableModel); // custom code
. . .
}
. . .
}
The JTable table component uses a custom cell renderer to format the numbers and provide cell editing. Listing 15.4 shows the init() method that the TopComponent constructor calls. This method sets the JTable’s row sorter, grid color, and installs a custom renderer for each cell.
Listing 15.4 TableDataEditorTopComponent.java—Table Configuration
public final class TableDataEditorTopComponent extends TopComponent {
. . .
public void init() {
table.setAutoCreateRowSorter(true);
table.setGridColor(Color.DARK_GRAY);
TableDataEditorTopComponent.DecimalFormatRenderer renderer =
new TableDataEditorTopComponent.DecimalFormatRenderer();
renderer.setHorizontalAlignment(JLabel.RIGHT);
for (int i = 0; i < table.getColumnCount(); i++) {
table.getColumnModel().getColumn(i).setCellRenderer(renderer);
}
}
private static class DecimalFormatRenderer extends
DefaultTableCellRenderer {
private static final DecimalFormat formatter = new DecimalFormat("#.0");
@Override
public Component getTableCellRendererComponent(
JTable table, Object value,
boolean isSelected,
boolean hasFocus,
int row,
int column) {
value = formatter.format((Number) value);
return super.getTableCellRendererComponent(
table, value, isSelected, hasFocus, row, column);
}
}
. . .
}
Listing 15.5 shows the Reload Data button event handler. The handler invokes MyTableDataModel method getOriginalData() to load the original data into the JTable table component. The JTable setValueAt() method invokes the model’s setValueAt() method, which fires table cell updated events for registered listeners. This in turn updates the chart windows.
Listing 15.5 TableDataEditorTopComponent.java—Reload Data Event Handler
public final class TableDataEditorTopComponent extends TopComponent {
. . .
private void reloadButtonActionPerformed(
ActionEvent evt) {
// Get the original data
Object[][] orig = tableModel.getOriginalData();
for (int row = 0; row < orig.length; row++) {
for (int col = 0; col < orig[row].length; col++) {
Double current = (Double)orig[row][col];
table.setValueAt(current, row, col);
}
}
}
. . .
}
Integrating JavaFX Charts
In a NetBeans Platform application with JavaFX charts, you configure the JavaFX content as described in Chapter 6 (see “JavaFX and the NetBeans Platform” on page 250). Our SDA application has a module for each chart, giving maximum flexibility for window layout. Each module includes the window (TopComponent), FXML markup for the JavaFX controls, and the JavaFX controller class. All JavaFX modules have the same structure, which we’ll describe next using the Line Chart as an example. We’ll discuss the other charts in the following sections.
Create Chart Module
Create a new module named Chart - Line and add it to the SDA application. Use package name org.smartphone.chart.line.
Chart FXML
Add FXML file linechart.fxml to the Source Package in module Chart - Line, as shown in Listing 15.6. We place the chart in a StackPane control since StackPane automatically centers its content, even with window resizing.
The FXML markup specifies the controller class with the fx:controller attribute. The StackPane and LineChart both specify fx:id attributes that let the controller class access these controls. LineChart is an XYChart, which requires xAxis and yAxis elements. These also have fx:id definitions. The axis element type (CategoryAxis or NumberAxis) depends on the data, chart, and chart layout.
<?xml version="1.0" encoding="UTF-8"?>
<?import java.lang.*?>
<?import java.util.*?>
<?import javafx.geometry.*?>
<?import javafx.scene.*?>
<?import javafx.scene.control.*?>
<?import javafx.scene.layout.*?>
<?import javafx.scene.chart.*?>
<StackPane id="StackPane" fx:id="stackpane"
xmlns:fx="http://javafx.com/fxml"
fx:controller="org.smartphone.chart.line.LineChartController">
<LineChart fx:id="chart" >
<xAxis>
<CategoryAxis fx:id="xAxis"/>
</xAxis>
<yAxis>
<NumberAxis fx:id="yAxis"/>
</yAxis>
</LineChart>
</StackPane>
Chart Controller
Listing 15.7 shows the chart controller code. All chart controllers have @FXML annotations that identify the FXML file controls. The Global Lookup returns the MyTableDataModel service provider (the tableModel field) to access the data. The JavaFX controller configures each chart (shown in the next section) and defines a public getImage() method that returns a Swing-compatible snapshot of the JavaFX scene graph.2 The TopComponent invokes the getImage() method to implement the Save Chart action. (See “Saving Charts” on page 789 for the Save Chart action implementation.)
2. Note that a “snapshot” reflects the scene graph as it is configured within the enclosing TopComponent; resizing a window affects the resulting image.
Listing 15.7 LineChartController.java
public class LineChartController implements Initializable {
@FXML
private StackPane stackpane;
@FXML
private CategoryAxis xAxis;
@FXML
private NumberAxis yAxis;
@FXML
private LineChart<String, Number> chart;
private ObservableList<XYChart.Series<String, Number>> lcData;
private MyTableDataModel tableModel;
private static final Logger logger = Logger.getLogger(
LineChartController.class.getName());
@Override
public void initialize(URL url, ResourceBundle rb) {
createLineChart();
}
private void createLineChart() {
tableModel = Lookup.getDefault().lookup(MyTableDataModel.class);
if (tableModel == null) {
logger.log(Level.SEVERE, "Cannot get TableModel object");
LifecycleManager.getDefault().exit();
}
. . . code to setup and configure JavaFX Chart using tableModel data . . .
}
public BufferedImage getImage() {
// must be in JavaFX Application Thread
SnapshotParameters params = new SnapshotParameters();
Image jfximage = stackpane.snapshot(params, null);
return SwingFXUtils.fromFXImage(jfximage, null);
}
}
Chart TopComponent
Add a LineChartTopComponent window to the Chart - Line module, as shown in Listing 15.8. The constructor uses JFXPanel to initialize the JavaFX content in the scene graph. Build the JavaFX content on the JavaFX Application Thread by loading the FXML and instantiating the JavaFX controller class.
A single line of code provides the print capabilities for the window, which sets the print.printable property to true. InstanceContent (see “Lookup as an Object Repository” on page 225) lets you add objects to the TopComponent’s Lookup. We’ll use InstanceContent to implement the Save Chart capability.
Listing 15.8 LineChartTopComponent.java
@ConvertAsProperties(
dtd = "-//org.smartphone.chart.line//LineChart//EN",
autostore = false)
@TopComponent.Description(
preferredID = "LineChartTopComponent",
//iconBase="SET/PATH/TO/ICON/HERE",
persistenceType = TopComponent.PERSISTENCE_ALWAYS)
@TopComponent.Registration(mode = "properties", openAtStartup = true)
@ActionID(category = "Window",
id = "org.smartphone.chart.line.LineChartTopComponent")
@ActionReference(path = "Menu/Window" /*, position = 333 */)
@TopComponent.OpenActionRegistration(
displayName = "#CTL_LineChartAction",
preferredID = "LineChartTopComponent")
@Messages({
"CTL_LineChartAction=LineChart",
"CTL_LineChartTopComponent=LineChart Window",
"HINT_LineChartTopComponent=This is a LineChart window"
})
public final class LineChartTopComponent extends TopComponent {
private static JFXPanel chartFxPanel;
private LineChartController controller;
private final InstanceContent content = new InstanceContent();
public LineChartTopComponent() {
initComponents();
setName(Bundle.CTL_LineChartTopComponent());
setToolTipText(Bundle.HINT_LineChartTopComponent());
associateLookup(new AbstractLookup(content));
setLayout(new BorderLayout());
// Enable the Print action for the TopComponent:
putClientProperty("print.printable", true);
init();
}
public void init() {
chartFxPanel = new JFXPanel();
add(chartFxPanel, BorderLayout.CENTER);
Platform.setImplicitExit(false);
Platform.runLater(() -> createScene());
}
private void createScene() {
try {
URL location = getClass().getResource("linechart.fxml");
FXMLLoader fxmlLoader = new FXMLLoader();
fxmlLoader.setLocation(location);
fxmlLoader.setBuilderFactory(new JavaFXBuilderFactory());
Parent root = (Parent) fxmlLoader.load(location.openStream());
chartFxPanel.setScene(new Scene(root));
controller = (LineChartController) fxmlLoader.getController();
} catch (IOException ex) {
Exceptions.printStackTrace(ex);
}
}
. . .
}
15.2 Introducing JavaFX Charts
The JavaFX Chart API is an important feature for applications that visualize data. Fortunately, you can easily integrate JavaFX charts into your NetBeans Platform applications. Depending on your data’s characteristics and the type of visualization that you require, you can choose one or more charts. In the SmartPhone Data application, we use all charts with the same data, which shows each chart’s visualization strengths.
You’ll discover the JavaFX charts are straightforward to use. Although the charts are highly configurable, default settings fit most requirements. You can also alter any chart’s appearance with custom CSS styling. Let’s begin with an overview of the JavaFX Chart API.
JavaFX Chart Overview
Figure 15.5 shows the JavaFX chart class hierarchy. Abstract class Chart extends Node, Parent, and Region, and therefore inherits all the features of these superclasses, including animation, effects, and CSS styling. All charts have an XY axis except Pie Chart.
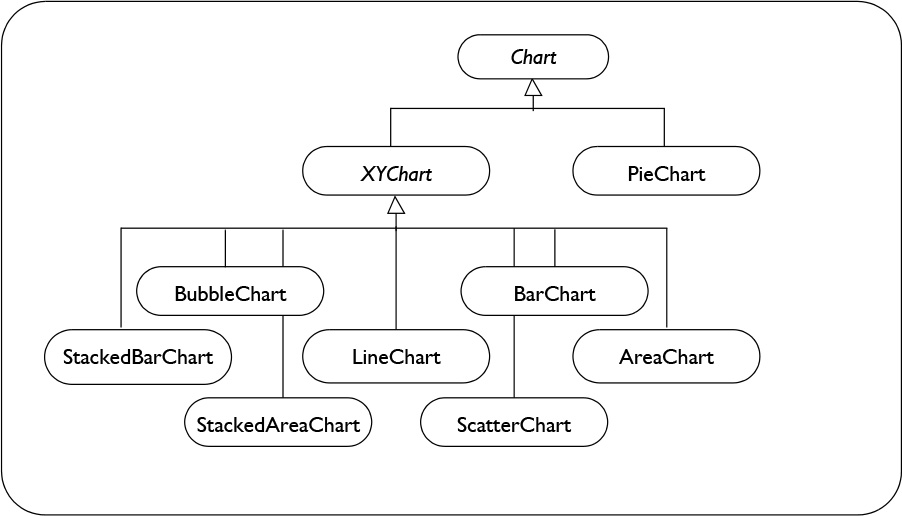
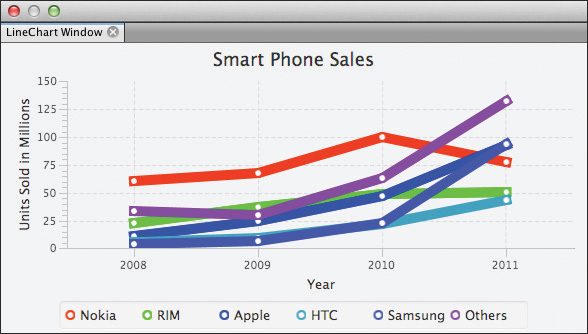
Chart is the base class for all charts and defines the title, legend, and content for each chart. The chart content is populated by the specific subclass of Chart. For example, Figure 15.6 shows a Line Chart, which is responsible for creating its chart contents. In this example, the contents include the X axis with a label, Y axis with a label, and plotted lines and tick marks.
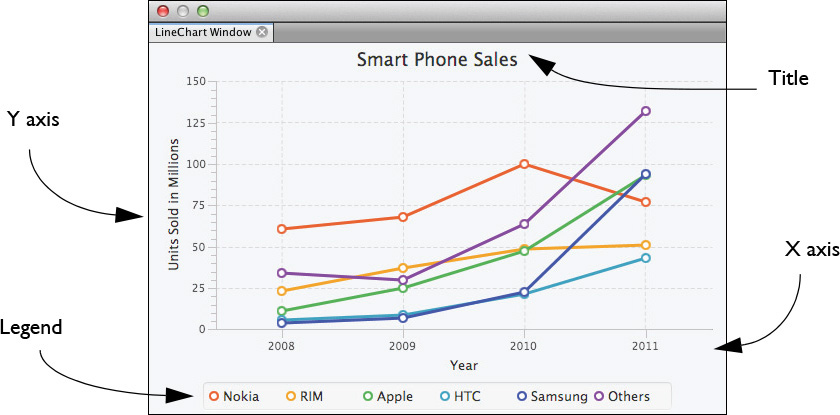
Chart Properties
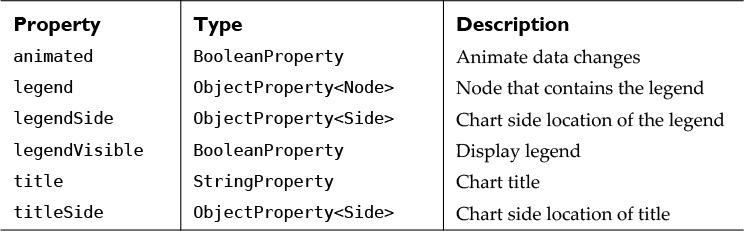
Table 15.1 lists the properties common to all charts. Note that these JavaFX properties can participate in binding expressions. Typically, the only property you’ll need to set is the title property.
By default, charts animate changes to their data. For example, in Figure 15.6, if a LineChart value changes in one of the series for 2008, the line angle moves as the data point travels to its new plot location. Similarly, in a PieChart, a new value affects the entire wedge layout. The content is not re-drawn from scratch. Rather, all wedges dynamically resize as their relative shapes adjust to the new values. You can disable this feature by setting the animated property to false.
As shown in Table 15.1, you can also configure the legend location, the title and its location, and whether or not the legend is visible.The legend property itself is protected and configured by chart subclasses.
XY Charts
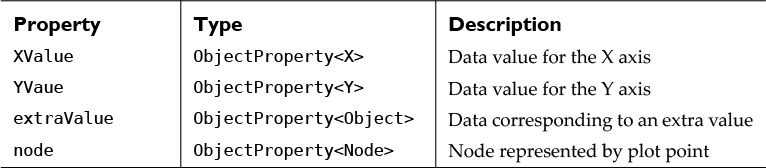
The XYChart abstract class is the base class for all two-axis charts and is responsible for drawing the axes and plot contents. Subclasses of XYChart are shown in Figure 15.5 on page 760. Properties for the XYChart class include controlling grid line visibility and whether alternating columns and rows have a visible fill. The most important property for XYChart is the data, whose type is as follows.
ObjectProperty<ObservableList<XYChart.Series<X,Y>>>
A chart’s data is stored in an ObservableList (see “Observable Collections” on page 148). The list type is XYChart.Series<X,Y>, which is a named series of data items (XYCharts manipulate a list of lists). Data items are type XYChart.Data<X,Y>, a generic type where X represents the X axis type and Y represents the Y axis type. Data items also include an extra value (extraValue property) that can be used in any way the subclassed chart needs.
For example, the LineChart in Figure 15.6 on page 760, has six series (Nokia, RIM, Apple, HTC, Samsung, and Others) whose names are displayed in the chart’s legend. Each series has four data points, and each data point has an X value String for the year and a Y value Number for the sales in millions of units. (You can review the raw data in Listing 15.2 on page 750.) Thus, the LineChart’s ObservableList is type
ObservableList<XYChart.Series<String, Number>>
where the X axis is a String type and the Y axis is a Number type. The data item for this series is
XYChart.Data<String, Number>
where the X axis value is a String (the year) and the Y axis value is a Number (units sold in millions).
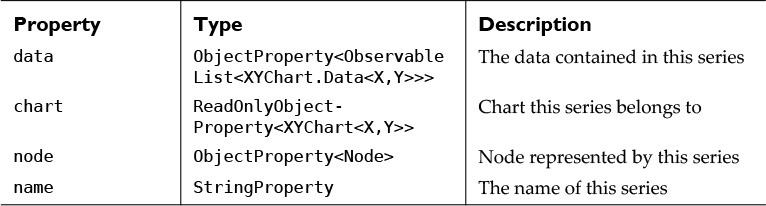
Table 15.2 shows the properties of the XYChart.Series<X,Y> type. Table 15.3 shows useful properties of the XYChart.Data<X,Y> type. For example, to get the node that represents the series, use getNode() for the node or nodeProperty() for the JavaFX property getter. To set the XValue and YValue of a data item, use
XYChart.Data<String, Number> myData;
. . .
myData.setXValue("2009");
myData.setYValue(25.5);
Because charts manage observable lists, chart objects respond to data changes automatically, updating their content with animation (and redrawing the legend and axes as necessary). Charts also respond to resizing events. For example, the Line Chart in Figure 15.7 appears in a floating window that has been reduced in size. The StackPane layout control keeps the chart centered, and the LineChart adjusts the contents. Here, the legend is no longer visible, the Y axis description is shortened, and the Y axis labels are reduced. The plot points have also been adjusted to appropriately fill the chart space.
Ultimately, the chart’s data items are represented by nodes in a scene graph. You can access a data item’s node, the chart’s node, and the data series’ node. You can therefore configure these nodes with event listeners (such as mouse clicks), effects, and animations. We’ll show you how to do this in “Accessing JavaFX Chart Nodes” on page 782.
Chart Styling
Charts use CSS for styling. You can configure the padding, text sizes, and fonts, and define legend and plot data symbols. CSS styles also define default colors for pie wedges and series data. The JavaFX charts have been restyled in JavaFX 8 to use the Modena theme. You can customize chart styles by providing your own values for the CSS chart styles. See “CSS Files” on page 98 for locating the default Modena CSS file.
For example, Figure 15.8 shows a restyled Line Chart. Three series colors are customized, along with their corresponding legend colors. In addition, we increase the Line Chart’s line stroke width (a change you can actually discern in the black and white screenshot).
Listing 15.9 shows the CSS styles used. Each chart type has its own styles. To load the CSS file, add attribute stylesheets="org/smartphone/chart/line/lineChartStyle.css" to the top-level StackPane in the Line Chart module’s FXML file, linechart.fxml.
Listing 15.9 lineChartStyle.css
.chart-series-line {
-fx-stroke-width: 10px;
-fx-effect: null;
}
.default-color0.chart-series-line { -fx-stroke: #ff3300; }
.default-color1.chart-series-line { -fx-stroke: #00ff00; }
.default-color2.chart-series-line { -fx-stroke: #0033ff; }
.default-color0.chart-line-symbol { -fx-background-color: #ff3300, white; }
.default-color1.chart-line-symbol { -fx-background-color: #00ff00, white; }
.default-color2.chart-line-symbol { -fx-background-color: #0033ff, white; }
15.3 Data Visualization with JavaFX Charts
Each chart emphasizes different aspects of the same data. In this section, we’ll summarize the features of the JavaFX charts. First, let’s build charts from what we know about charts, series, and data items. We’ll start with the Line Chart. Unless otherwise indicated, all charts are built exactly how we describe in the following section for Line Chart.
Line Chart
Line Charts (see Figure 15.6 on page 760 and Figure 15.8) show you comparative trends with plotted data series. Because the chart draws lines connecting plot points, you can visualize trends within a series and comparative trends when there is more than one series. Plotting stock prices over time is a common application for Line Charts.
Listing 15.10 shows how to build the LineChart’s data. The LineChartController class configures and sets the data for the Line Chart.
First, the declarations for the xAxis, yAxis, chart, and lcdata fields show that chart is a LineChart with a String value for the X Axis and a Number value for the Y Axis. The xAxis field is therefore a CategoryAxis type (String label), and yAxis is a NumberAxis type (Number value). The lcData LineChart data field type is an ObservableList <XYChart.Series<String, Number>>.
The createLineChart() method configures the LineChart. The methods we added to the MyTableDataModel abstract class define the labels and descriptive values of the axes. X axis is a CategoryAxis with an observable list of Strings for the category names. These are the MyTableDataModel column names (the years in String form). The X Axis label is set from the MyTableDataModel name description.
The Y Axis also has a label. Because the Y Axis is a NumberAxis type, we set the tick unit. Lastly, we set the chart’s title and its data with the getLineChartData() method (shown in Listing 15.11 on page 766).
Listing 15.10 LineChartController.java—Configure the LineChart
public class LineChartController implements Initializable {
@FXML
private StackPane stackpane;
@FXML
private CategoryAxis xAxis;
@FXML
private NumberAxis yAxis;
@FXML
private LineChart<String, Number> chart;
private ObservableList<XYChart.Series<String, Number>> lcData;
private MyTableDataModel tableModel;
private static final Logger logger = Logger.getLogger(
LineChartController.class.getName());
@Override
public void initialize(URL url, ResourceBundle rb) {
createLineChart();
}
private void createLineChart() {
tableModel = Lookup.getDefault().lookup(MyTableDataModel.class);
if (tableModel == null) {
logger.log(Level.SEVERE, "Cannot get TableModel object");
LifecycleManager.getDefault().exit();
}
xAxis.setCategories(FXCollections.observableArrayList(
tableModel.getColumnNames()));
xAxis.setLabel(tableModel.getNameDescription());
yAxis.setTickUnit(tableModel.getTickUnit());
yAxis.setLabel(tableModel.getDataDescription());
chart.setTitle(tableModel.getTitle());
chart.setData(getLineChartData());
. . . Add TableModelListener to tableModel, see Listing 15.12 on page 767 . . .
}
. . .
}
Listing 15.11 shows the getLineChartData() method, which builds an observable collection containing the XYChart.Series for each row in the table data. Each Series, in turn, has a list of data items set by the appropriate row and column data from the table model. The table model getColumnName() method returns the column’s String name (the year in String form).
Listing 15.11 LineChartController.java—getLineChartData()
public class LineChartController implements Initializable {
. . .
private ObservableList<XYChart.Series<String, Number>>
getLineChartData() {
if (lcData == null) {
lcData = FXCollections.observableArrayList();
for (int row = 0; row < tableModel.getRowCount(); row++) {
XYChart.Series<String, Number> series = new XYChart.Series<>();
series.setName(tableModel.getCategoryName(row));
for (int column = 0;
column < tableModel.getColumnCount(); column++) {
series.getData().add(new XYChart.Data<>(
tableModel.getColumnName(column),
(Number) tableModel.getValueAt(row, column)));
}
lcData.add(series);
}
}
return lcData;
}
}
Listing 15.12 shows the TableModelListener that we add to the tableModel field. Recall that tableModel extends AbstractTableModel, which provides support for adding listeners. The event handler obtains the row and column number of the changed value and gets the new value from the event source. In the JavaFX Application Thread, the handler gets the series that corresponds to the changed row, and data.setYValue() updates the corresponding data item.
Listing 15.12 LineChartController.java—TableModelListener
public class LineChartController implements Initializable {
. . .
private void createLineChart() {
. . . code omitted . . . (see Listing 15.10) . . .
// set up the event handler to respond to changes in the table data
// This is a Swing event, so we must use Platform.runLater()
// to update JavaFX components
tableModel.addTableModelListener((TableModelEvent e) -> {
if (e.getType() == TableModelEvent.UPDATE) {
final int row = e.getFirstRow();
final int column = e.getColumn();
final Number value = (Number)((MyTableDataModel)
e.getSource()).getValueAt(row, column);
Platform.runLater(() -> {
XYChart.Series<String, Number> s = chart.getData().get(row);
LineChart.Data<String, Number> data =
s.getData().get(column);
data.setYValue(value);
});
}
});
}
. . .
}
Scatter Chart
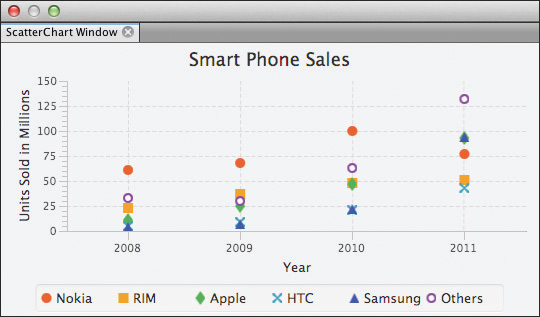
Figure 15.9 shows the Scatter Chart (also called an XY Plot) for the SDA. Scatter Charts excel at displaying large sets of data and possibly showing correlations between X Axis and Y Axis values. For the SmartPhone sales data, we see a slight positive correlation between the sales year and the number of units sold. That is, each year, more and more units were sold.
You build the Scatter Chart with the SmartPhone sales data exactly like the Line Chart. First, create a module for the Scatter Chart and create a window (ScatterChartTopComponent). Next, add the scatterchart.fxml FXML file and the JavaFX controller class, ScatterChartController.java.
In scatterchart.fxml, use the <ScatterChart> element for the chart control. The JavaFX controller class builds the data and configures the chart. The code is unchanged from the Line Chart code shown in the previous section, except you use ScatterChart in place of LineChart.
You can change the Scatter Chart symbols with CSS styling, as explained in “Chart Styling” on page 763.
Bar Chart
The JavaFX Bar Chart is an XY Chart that draws bars for values. Bar Charts help visualize change over time. You can also compare multiple series within each time frame. The horizontal Bar Chart emphasizes maximum values as your eye follows the chart from left to right. The vertical Bar Chart emphasizes changes over time.
In the JavaFX BarChart, the bar orientation depends on which axis is the CategoryAxis and which axis is the NumberAxis. In Figure 15.10, the left chart is a vertical Bar Chart, defining the X axis as the CategoryAxis and the Y axis as the NumberAxis. The right-side chart is a horizontal Bar Chart that switches the Number and Category axes.
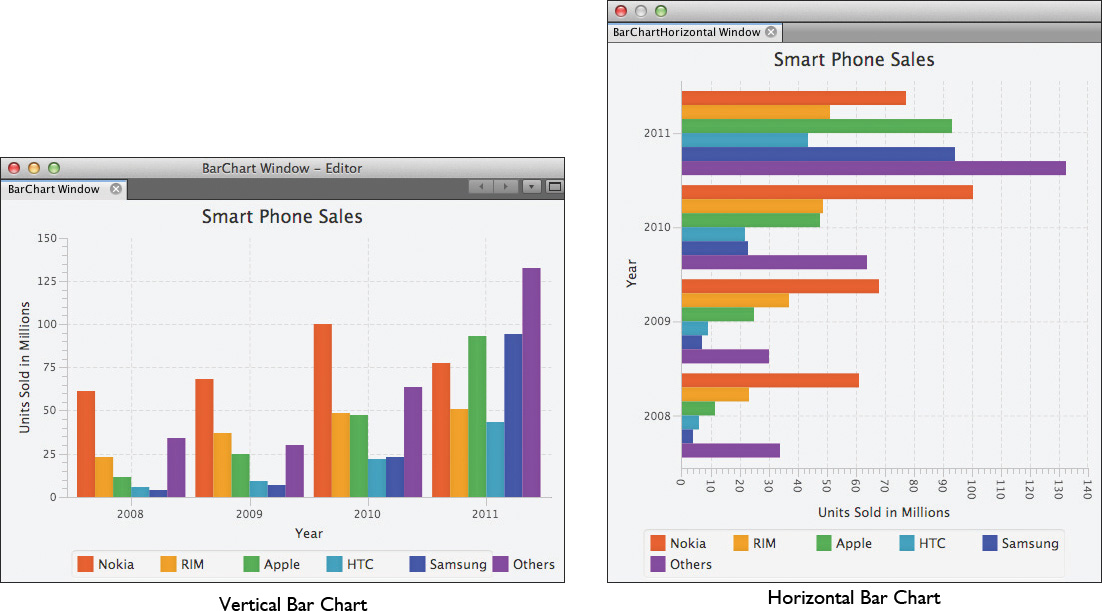
Building the vertical Bar Chart and defining the TableModelListener is unchanged from the Line Chart. For the horizontal Bar Chart, Listing 15.13 shows the createBarChartData() method, which switches the axes.
Listing 15.13 BarChartHorizontalController.java—getBarChartData()
public class BarChartHorizontalController implements Initializable {
@FXML
private StackPane stackpane;
@FXML
private CategoryAxis catAxis;
@FXML
private NumberAxis numAxis;
@FXML
private BarChart<Number, String> chart;
private ObservableList<BarChart.Series<Number, String>> bcData;
private MyTableDataModel tableModel;
. . .
private ObservableList<XYChart.Series<Number, String>> getBarChartData() {
if (bcData == null) {
bcData = FXCollections.observableArrayList();
for (int row = 0; row < tableModel.getRowCount(); row++) {
XYChart.Series<Number, String> series = new XYChart.Series<>();
series.setName(tableModel.getCategoryName(row));
for (int column = 0;
column < tableModel.getColumnCount(); column++) {
series.getData().add(new BarChart.Data<>(
(Number) tableModel.getValueAt(row, column),
tableModel.getColumnName(column)));
}
bcData.add(series);
}
}
return bcData;
}
}
Similarly, Listing 15.14 shows the horizontal Bar Chart’s TableModelListener. This listener must use the data item’s setXValue() method instead of setYValue() when updating the modified data item.
Listing 15.14 BarChartHorizontalController.java—TableModelListener
public class BarChartHorizontalController implements Initializable {
. . .
// set up the event handler to respond to changes in the table data
// This is a swing event, so we must use Platform.runLater()
// to update JavaFX components
tableModel.addTableModelListener((TableModelEvent e) -> {
if (e.getType() == TableModelEvent.UPDATE) {
final int row = e.getFirstRow();
final int column = e.getColumn();
final Number value = (Number) ((MyTableDataModel)
e.getSource()).getValueAt(row, column);
Platform.runLater(() -> {
XYChart.Series<Number, String> s = chart.getData().get(row);
XYChart.Data<Number, String> data = s.getData().get(column);
data.setXValue(value);
});
}
});
. . .
Area Chart
Figure 15.11 shows an Area Chart for the SDA. Area Charts are similar to Line Charts. However, Area Charts shade the area below lines that connect data points. Recall that each line represents a named series. Because Area Charts create overlapping shaded areas, a reduced opacity makes the obscured areas visible.
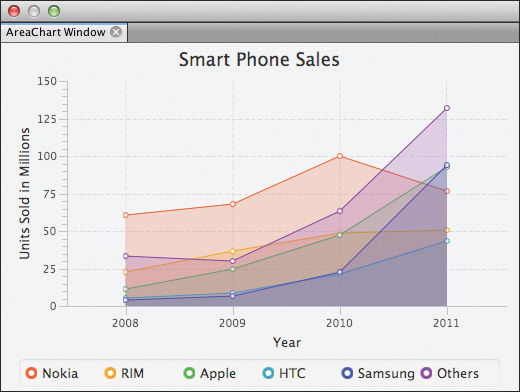
You build the Area Chart with the SmartPhone sales data exactly like the Line Chart. Create a module for the Area Chart and create a window (AreaChartTopComponent). Next, add the areachart.fxml FXML file and the JavaFX controller class, AreaChartController.java.
Stacked Area Chart
Figure 15.12 shows a Stacked Area Chart for the SDA. As its name implies, a Stacked Area Chart stacks plotted areas on top of each other instead of plotting the Y values for each series from 0. This chart provides a more obvious view of the change in the total amount for each time frame. Stacked Area Charts also emphasize relative shapes of each named series, showing how a series changes over time. For example, the Nokia and RIM series have relatively “flat” shapes, whereas the remaining four series have shapes that “expand.”
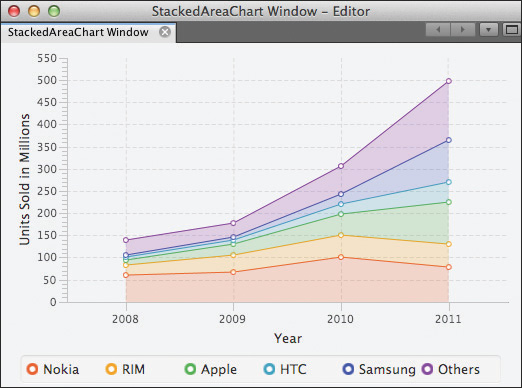
You build the Stacked Area Chart exactly like the Line Chart. Here, the X axis is CategoryAxis and the Y axis is NumberAxis. Create a module for the Stacked Area Chart and create a window (StackedAreaChartTopComponent). Next, add the stackedareachart.fxml FXML file and the JavaFX controller class, StackedAreaChartController.java.
Stacked Bar Chart
Figure 15.13 shows a Stacked Bar Chart for the SDA. A Stacked Bar Chart stacks each series’ bar on top of each other instead of rendering the bars next to each other from 0. This emphasizes changes in the total amount for each time frame. In Figure 15.13, you can see how each bar is larger than the bar from the preceding time frame, indicating an obvious growth in total sales.
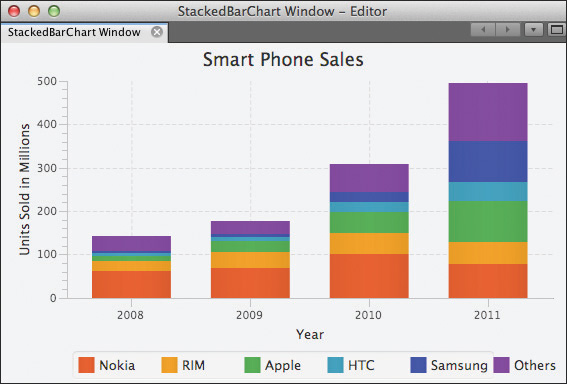
You build the Stacked Bar Chart exactly like the Line Chart. Again, the X axis is CategoryAxis and the Y axis is NumberAxis. Create a module for the Stacked Bar Chart and create a window (StackedBarChartTopComponent). Add the stackedbarchart.fxml FXML file and the JavaFX controller class, StackedBarChartController.java
Bubble Chart
Figure 15.14 shows a Bubble Chart for the SDA, which uses both the relative size and location of the plotted “bubbles” to visualize a data item’s value. With Bubble Charts, you can optionally provide a third data value (besides the X and Y plot point values) to indicate the radius of the bubble. Here, we configure this extra value to show the relative percentage of a data item’s value compared to the total for that time frame. Thus, a larger bubble indicates a bigger market share for that time frame, and a smaller bubble represents a smaller market share. If you don’t provide an extra value, the bubbles are all the same size.3
3. Note that as you resize a Bubble Chart, the relative size of the plot bubbles is constant. However, the shape of the bubbles can change as you expand or shrink either the vertical or horizontal axis of the chart.
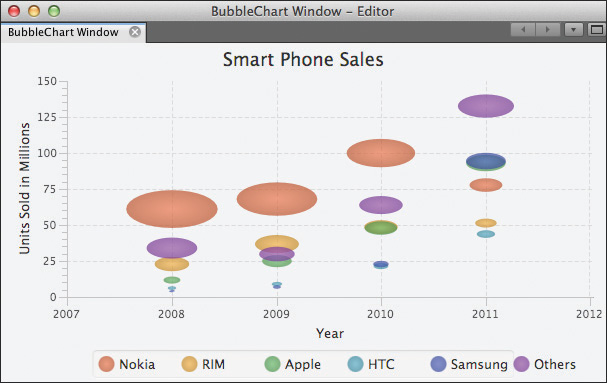
BubbleCharts do not use CategoryAxis. Both X and Y axis types are NumberAxis. To make the chart more visually appealing, we provide a String formatter for the X axis year values. Because both axes use NumberAxis types, the chart, observable list, and data item specify Number for their generic types.
Now let’s show you the BubbleChartController class that configures the chart and builds the chart’s data. We also show you the custom formatter for the X axis and the TableModelListener code, since these are all slightly different than the XY Charts you’ve seen so far.
Listing 15.15 shows the @FXML declarations and the createBubbleChartData() method, which computes an extra value for the data item. This value is based on the total for that time frame (column in the table data model).
Constant XFACTOR is an integer that scales the X Axis. This makes the X and Y axes scales similar and keeps the bubble shapes proportional to the chart.
Listing 15.15 BubbleChartController.java—getBubbleChartData()
public class BubbleChartController implements Initializable {
@FXML
private StackPane stackpane;
@FXML
private NumberAxis xAxis;
@FXML
private NumberAxis yAxis;
@FXML
private BubbleChart<Number, Number> chart;
. . .
private ObservableList<BubbleChart.Series<Number, Number>>
getBubbleChartData() {
if (bcData == null) {
bcData = FXCollections.observableArrayList();
// Find totals for each column
double[] totals = new double[tableModel.getColumnCount()];
for (int column = 0; column < tableModel.getColumnCount();
column++) {
for (int row = 0; row < tableModel.getRowCount(); row++) {
totals[column] +=
(double)tableModel.getValueAt(row, column);
}
}
for (int row = 0; row < tableModel.getRowCount(); row++) {
XYChart.Series<Number, Number> series = new XYChart.Series<>();
series.setName(tableModel.getCategoryName(row));
for (int column = 0; column < tableModel.getColumnCount();
column++) {
Integer year = Integer.valueOf(
tableModel.getColumnName(column));
Number units = (Number) tableModel.getValueAt(row, column);
series.getData().add(new XYChart.Data<Number, Number>(
year * XFACTOR,
units,
(units.doubleValue() / totals[column]) * XFACTOR));
}
bcData.add(series);
}
}
return bcData;
}
}
Similarly, Listing 15.16 shows the Bubble Chart’s TableModelListener. This listener must not only update the new YValue for the changed data item but also recompute the percentage of the total for all data items in that time frame (column).
Listing 15.16 BubbleChartController.java—TableModelListener
public class BubbleChartController implements Initializable {
. . .
// set up the event handler to respond to changes in the table data
// This is a swing event, so we must use Platform.runLater()
// to update JavaFX components
tableModel.addTableModelListener((TableModelEvent e) -> {
if (e.getType() == TableModelEvent.UPDATE) {
final int row = e.getFirstRow();
final int column = e.getColumn();
final Number value = (Number) ((MyTableDataModel)
e.getSource()).getValueAt(row, column);
// Get new total for column
double total = 0;
for (int r = 0; r < tableModel.getCategoryCount(); r++) {
total += (double) tableModel.getValueAt(r, column);
}
final double newTotal = total;
Platform.runLater(() -> {
XYChart.Series<Number, Number> s = chart.getData().get(row);
BubbleChart.Data<Number, Number> data =
s.getData().get(column);
data.setYValue(value);
// update extra value for the entire column
for (int r = 0; r < tableModel.getCategoryCount(); r++) {
XYChart.Series<Number, Number> ss =
chart.getData().get(r);
BubbleChart.Data<Number, Number> data1 =
ss.getData().get(column);
data1.setExtraValue(((double) tableModel.getValueAt(
r, column) / newTotal) * XFACTOR);
}
});
}
});
. . .
Finally, Listing 15.17 shows the custom formatter we use for the X axis, which is a Number value. The StringConverter overrides the toString() and fromString() methods. These methods provide the conversion between the data item Number and the displayed String representing the year.
Constant XFactor makes the X axis and Y axis proportional so that the bubble shape is within an appealing range.
Listing 15.17 BubbleChartController.java—Customize X Axis
public class BubbleChartController implements Initializable {
. . .
xAxis.setAutoRanging(false);
xAxis.setLowerBound((Integer.valueOf(
tableModel.getColumnName(0)) - 1) * XFACTOR);
xAxis.setUpperBound(((Integer.valueOf(tableModel.getColumnName(
tableModel.getColumnCount() - 1)) + 1) * XFACTOR) + 1);
xAxis.setTickLabelFormatter(new StringConverter<Number>() {
@Override
public String toString(Number t) {
return String.valueOf(t.intValue() / XFACTOR);
}
@Override
public Number fromString(String string) {
return Integer.valueOf(string) * XFACTOR;
}
});
xAxis.setTickUnit(XFACTOR);
xAxis.setMinorTickCount(0);
xAxis.setLabel(tableModel.getNameDescription());
. . .
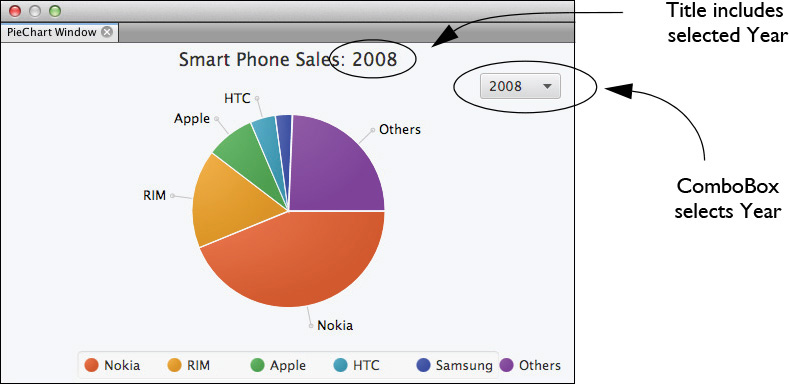
Pie Chart
Figure 15.15 shows a Pie Chart window. Because PieChart is not an XY Chart and cannot display two-axes data, we must apply the table data differently. Pie Charts are suitable for visualizing product market share, since they show you relative percentages of a whole. In Figure 15.15, the Pie Chart visualizes a single column in the table data. Each pie wedge represents the company’s sales for a specific year. Since the total of each column represents the total product sold for a given year, the Pie Chart reflects each company’s market share for that year.
PieChart data is stored in an ObservableList<PieChart.Data> type. PieChart.Data includes a read-only reference to its chart, a name StringProperty (used as a wedge label), and a pieValue DoubleProperty.
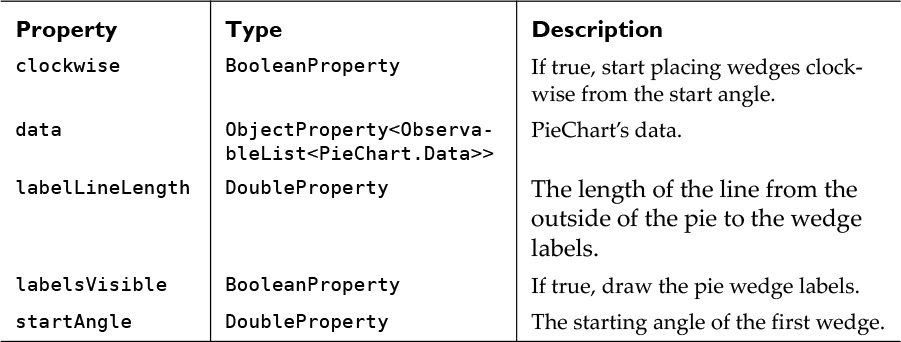
In addition to the chart properties inherited from Chart, PieChart includes the properties shown in Table 15.4.
In the SDA PieChart window, a JavaFX ComboBox control lets users select a year. The chart title includes the selected year for clarity.
Let’s examine the FXML and JavaFX controller class for the PieChart window. Listing 15.18 shows piechart.fxml. The StackPane has two child nodes, PieChart and ComboBox, and all three elements include fx:id attributes. StackPane normally stacks child nodes on top of each other, but in the controller we reposition the ComboBox.
<?import java.lang.*?>
<?import java.util.*?>
<?import javafx.scene.*?>
<?import javafx.scene.control.*?>
<?import javafx.scene.layout.*?>
<?import javafx.scene.chart.*?>
<StackPane id="StackPane" fx:id="stackpane"
xmlns:fx="http://javafx.com/fxml/1"
fx:controller="org.smartphone.chart.pie.PieChartController">
<children>
<PieChart fx:id="chart" />
<ComboBox fx:id="yearChoice" />
</children>
</StackPane>
Listing 15.19 shows the class fields for the PieChartController class and the code that configures the Pie Chart. We’ll present this code in several listings. Here you see the stackpane, chart, and yearChoice fields from the FXML file. We also define a tableModel field to hold the data and the Pie Chart data’s observable list.
The createPieChart() method builds and configures the pie chart data. First, we obtain the tableModel field from the Global Lookup. Next, we position the ComboBox in the upper right area of the StackPane with margins.
The next step configures the ComboBox<String>. The ComboBox itemsProperty is an observable list of Strings that we initialize from the list of column names (the years). We invoke the ComboBox selection model selectFirst() method to select year “2008” initially. We also add an invalidation listener to the ComboBox selection model’s selectedIndexProperty (see “Using Listeners with Observable Properties” on page 105). The handler uses a lambda expression to reset the Pie Chart data from the tableModel field based on the selected year.
The last step configures the Pie Chart. We invoke the getPieChartData() method (shown Listing 15.20 on page 780) with the selected index value of the ComboBox.
This integer value is the column number index from the table model data. A binding expression concatenates the chart’s title with the selected year.
This binding expression uses static Bindings methods. The Bindings.concat() method concatenates two String expressions. The first expression is the table model’s title followed by a : and <space>.
Bindings.concat(tableModel.getTitle() + ": ",
The second expression returns the selected String item from the ComboBox.
Bindings.stringValueAt(yearChoice.itemsProperty().get(),
yearChoice.getSelectionModel().selectedIndexProperty()))
The Bindings.stringValueAt() method takes two arguments, an observable list and an index into the list. The list is the ComboBox selection model (the list of items). The index corresponds to the selected value.
Note that the invalidation handler could have updated the chart’s titleProperty. However, property binding is better because bindings always perform implicit assignments. This avoids the extra step of separately initializing the titleProperty value.
Listing 15.19 PieChartController.java—Set Up PieChart Data
public class PieChartController implements Initializable {
@FXML
private StackPane stackpane;
@FXML
private PieChart chart;
@FXML
private ComboBox<String> yearChoice;
private MyTableDataModel tableModel;
private ObservableList<PieChart.Data> pcData;
private static final Logger logger = Logger.getLogger(
PieChartController.class.getName());
@Override
public void initialize(URL url, ResourceBundle rb) {
createPieChart();
}
private void createPieChart() {
// set up the tableModel data
tableModel = Lookup.getDefault().lookup(MyTableDataModel.class);
if (tableModel == null) {
logger.log(Level.SEVERE, "Cannot get TableModel object");
LifecycleManager.getDefault().exit();
}
// position the combobox within the stackpane
StackPane.setAlignment(yearChoice, Pos.TOP_RIGHT);
StackPane.setMargin(yearChoice, new Insets(30, 15, 8, 8));
// set up the combobox
yearChoice.setItems(FXCollections.observableArrayList(
tableModel.getColumnNames()));
yearChoice.getSelectionModel().selectFirst();
yearChoice.setTooltip(new Tooltip("Select the sales data year"));
yearChoice.getSelectionModel().selectedIndexProperty().addListener(o->{
getPieChartData(yearChoice.getSelectionModel().getSelectedIndex());
});
// configure the pie chart
chart.setData(getPieChartData(yearChoice.getSelectionModel()
.getSelectedIndex()));
chart.titleProperty().bind(
Bindings.concat(tableModel.getTitle() + ": ",
Bindings.stringValueAt(yearChoice.itemsProperty().get(),
yearChoice.getSelectionModel().selectedIndexProperty())));
. . .
}
}
Listing 15.20 shows the getPieChartData() method. Here we set the Pie Chart’s data using the provided column number to index into the table model’s column. The first time this method is invoked, we instantiate an observable arraylist for the pcData field and the PieData.Data values. Subsequent calls use the setPieValue() method to update existing PieData.Data elements. The update is registered as a change to the Pie Chart data. The chart responds by resizing the existing wedges with animation.
Listing 15.20 PieChartController.java—getPieChartData()
// Return the data corresponding to the column number (year)
private ObservableList<PieChart.Data> getPieChartData(int column) {
if (pcData == null) {
pcData = FXCollections.observableArrayList();
for (int row = 0; row < tableModel.getRowCount(); row++) {
pcData.add(new PieChart.Data(tableModel.getCategoryName(row),
(Double) tableModel.getValueAt(row, column)));
}
} else {
for (int row = 0; row < tableModel.getRowCount(); row++) {
PieChart.Data data = chart.getData().get(row);
data.setPieValue((Double) tableModel.getValueAt(row, column));
}
}
return pcData;
}
Listing 15.21 shows the TableModelListener added to the tableModel field. First, we make sure the changed table data refers to the currently displayed year. After accessing the changed data, we update the Pie Chart data item with the setPieValue() method in the JavaFX Application Thread.
Listing 15.21 PieChartController.java—TableModelListener
public class PieChartController implements Initializable {
. . .
private void createPieChart() {
. . .
tableModel.addTableModelListener((TableModelEvent e) -> {
if (e.getType() == TableModelEvent.UPDATE) {
final int row = e.getFirstRow();
final int column = e.getColumn();
if (column != yearChoice.getSelectionModel()
.getSelectedIndex()) {
return;
}
final Double value = (Double) ((MyTableDataModel)
e.getSource()).getValueAt(row, column);
Platform.runLater(() -> {
// Update JavaFX scene in JavaFX Application Thread
PieChart.Data data = chart.getData().get(row);
data.setPieValue(value);
});
}
});
}
. . .
}
15.4 Adding Behaviors to JavaFX Charts
All displayed parts of a chart are JavaFX nodes. This means you can attach mouse event handlers, set effects, and have chart nodes participate in transitions. In this section, we add a transition that animates a selected Pie Chart wedge. During the wedge animation, a label that displays the wedge’s percentage of the total will fade in. We also add an in-place editor that is invoked with a right-mouse click on the selected pie wedge. So far, all of the JavaFX charts have been read-only displays, so this in-place editor shows you how to add editing capabilities to JavaFX charts.
Figure 15.16 is a snapshot of a Pie Chart wedge animating outward, initiated with a mouse click inside the wedge. The wedge has a drop shadow effect. The label in the upper left corner displays the percentage value, which is dynamically updated when the value changes. Furthermore, when the user clicks anywhere in the background of the window, the wedge loses the drop shadow and the label gradually fades out. With JavaFX, we can easily add these user-initiated effects to charts.
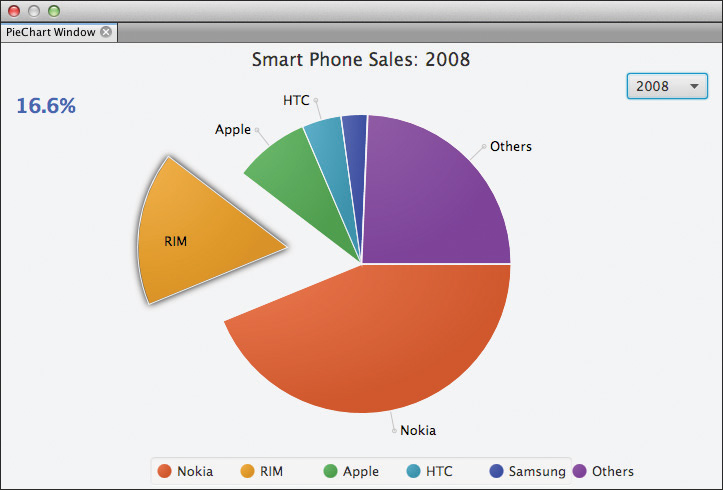
Figure 15.17 shows an in-place text editor. Invoked with a right click or a control click, this editor lets users change selected pie wedge values. The user hits the Enter or Return key to finish editing, which makes the TextField control fade out. New values propagate to the table model and update the entire application (including the JTable that displays the raw table data).
These two features require new controls in the FXML file, binding to keep the controls synchronized, and mouse click event handlers for the individual nodes that represent the pie wedges. The event handler builds transitions to perform wedge animation and fade in/out the label and textfield.
Before we show you this code, let’s review how to access chart nodes so that you can add features and special effects.
Accessing JavaFX Chart Nodes
JavaFX makes it easy to attach event handlers to JavaFX charts or to individual data items. To attach an event handler to the background area of a chart, for example, use the chart object directly (since Chart extends Node and is part of the scene graph).
Chart myChart;
. . .
myChart.addEventHandler(MouseEvent.MOUSE_CLICKED, (MouseEvent t) -> {
. . . event handler code here . . .
});
Similarly, to apply an effect to a chart, use setEffec() as follows.
myChart.setEffect(new DropShadow());
You can also manipulate a chart’s individual data items using the getNode() method of the data item. Here, we get the first element of a Pie Chart data list and add an event handler to the data item’s node.
PieChart chart;
. . .
chart.getData().get(0).getNode().addEventHandler(
MouseEvent.MOUSE_CLICKED, (MouseEvent t) -> {
. . . event handler code . . .
});
With XYCharts, data access requires slightly different code. For example, here’s how to access the node representing the first series of a Line Chart, to which we apply a drop shadow effect.
LineChart<String, Number> chart;
. . .
XYChart.Series series = chart.getData().get(0); // get first series
series.getNode().setEffect(new DropShadow());
And here’s how to access the first data item of the first series and add a mouse event handler for a data item with type XYChart.Data<String, Number>.
XYChart.Data<String, Number> dataItem =
chart.getData().get(0).getData().get(0); // get first data item
dataItem.getNode().addEventHandler(
MouseEvent.MOUSE_CLICKED, (MouseEvent t) -> {
. . . event handler code . . .
});
Let’s apply these concepts to add new features to the PieChart window.
Adding PieChart Features
We begin with piechart.fxml, the FXML file for the PieChart window. Listing 15.22 shows the added <TextField> and <Label> elements. Both include fx:id attributes so the JavaFX controller class can access them. These added controls have their opacity properties set to zero. This makes them invisible initially, but the controls will fade in and out as needed.
The TextField control sets its maxWidth property, and the Label control configures its textFill and style properties.
<StackPane id="StackPane" fx:id="stackpane"
xmlns:fx="http://javafx.com/fxml/1"
fx:controller="org.smartphone.chart.pie.PieChartController">
<children>
<PieChart fx:id="chart" />
<ComboBox fx:id="yearChoice" />
<TextField fx:id="textField"
maxWidth="75"
opacity="0.0" />
<Label fx:id="label"
textFill="RoyalBlue"
opacity="0.0"
style="-fx-font-size: 20 ; -fx-font-weight: bold; "/>
</children>
</StackPane>
Listing 15.23 shows the class fields added to PieChartController class. The @FXML annotations identify the controls defined in the FXML file. We also add a JavaFX Node field called lastNode that is set to the most recent node that takes on effects and animation.
Listing 15.23 PieChartController.java—Add Class Fields
public class PieChartController implements Initializable {
@FXML
private Label label;
@FXML
private StackPane stackpane;
@FXML
private PieChart chart;
@FXML
private ComboBox<String> yearChoice;
@FXML
private TextField textField;
private MyTableDataModel tableModel;
private ObservableList<PieChart.Data> pcData;
private Node lastNode = null;
. . .
Now let’s show you the PieChartController code that configures the event handlers. These handlers create the animation and in-place editing and restore the wedges to normal. We’ll show this code in several parts. First, Listing 15.24 shows the resetTextField() method that fades out the TextField control and returns the TextField to its original location at the bottom of the window.
Next, we define a background mouse click event handler that invokes this resetTextField() method, fades out the label, restores the pie wedge to its normal location, and removes the drop shadow effect from the pie wedge.
Listing 15.24 PieChartController.java—Event Handler Code Part 1
private void resetTextField() {
FadeTransition ft = new FadeTransition(Duration.millis(1000),
textField);
ft.setToValue(0.0);
ft.playFromStart();
ft.setOnFinished((event) -> {
textField.setTranslateX(0);
textField.setTranslateY(0);
});
}
private void setupEventHandlers() {
final DropShadow dropShadow = new DropShadow();
// add a MOUSE_CLICKED handler to the background chart
// to turn off any dropshadow effects
// and make the Label/TextField fade out
chart.addEventHandler(MouseEvent.MOUSE_CLICKED, (MouseEvent t) -> {
resetTextField();
FadeTransition ft = new FadeTransition(Duration.millis(1500),
label);
ft.setToValue(0.0);
ft.playFromStart();
if (lastNode != null) {
lastNode.setEffect(null);
lastNode.setTranslateX(0);
lastNode.setTranslateY(0);
}
t.consume();
});
. . . method setupEventHandlers() continues in Listing 15.25 . . .
Listing 15.25 continues with the setupEventHandlers() method. First, we have a for loop that invokes chart.getData() to access each PieChart data item. An integer row counter keeps track of the current row number, which we assign to currentRow for access within the event handler. The row variable updates at the end of the for loop.
Next, we define a StringBinding percentBinding object. This custom binding object (see “Custom Binding” on page 116 for more information) returns the percentage of the whole for the selected wedge. Note that binding makes this value always correct, even if the user selects a different pie wedge or different year, or if the user updates the table data.
Listing 15.25 PieChartController.java—Event Handler Code Part 1I
private void setupEventHandlers() {
. . .
// set up bindings and event handlers for piechart nodes
int row = 0;
for (final PieChart.Data data : chart.getData()) {
final int currentRow = row;
final StringBinding percentBinding = new StringBinding() {
{
pcData.stream().forEach((data) -> {
super.bind(data.pieValueProperty());
});
}
@Override
protected String computeValue() {
double total = 0;
for (final PieChart.Data thisdata : pcData) {
total += thisdata.getPieValue();
}
return String.format("%.1f%%", data.getPieValue()
/ total * 100);
}
};
. . . method setupEventHandlers() continues in Listing 15.26 . . .
Listing 15.26 shows the continuation of the for loop from Listing 15.25. Here we invoke data.getNode() to add mouse click event handlers to each PieChart data node. Each handler is divided into two parts. We process the in-place editor if the mouse event isMetaDown() method returns true. Otherwise, the handler initiates the pie wedge animation.
The lastNode field is set so that the background mouse click handler can reset the most recently selected pie wedge node (see Listing 15.24 on page 785).
The in-place editor places the TextField at the mouse click location, makes the TextField visible, and initializes the TextField text property to the node’s pieValue property. The TextField action event handler (the setOnAction() method) reads the value from the TextField, updates the PieChart data pieValue property, resets the TextField, and updates the corresponding table data value in the Swing EDT. This update propagates to the other charts and the TableDataEditor window.
If the isMetaDown() method returns false then we animate the pie wedge. Here, the selected node’s getBoundsInLocal() method helps calculate X and Y values for the TranslateTransition (the animation that moves the node). We bind the label’s textProperty to the percentBinding object defined earlier (see Listing 15.25 on page 786) and place a drop shadow effect on the selected node. We then build both the TranslateTransition to move the wedge and the FadeTransition to fade in the label. A ParallelTransition plays them at the same time.
Listing 15.26 PieChartController.java—Event Handler Code Part 1II
private void setupEventHandlers() {
. . .
// Still inside the chart.getData() for loop
for (final PieChart.Data data : chart.getData()) {
. . .
data.getNode().addEventHandler(
MouseEvent.MOUSE_CLICKED, (MouseEvent t) -> {
if (lastNode != null) {
lastNode.setEffect(null);
}
lastNode = data.getNode();
if (t.isMetaDown()) { // In-Place Editor
// Move the textfield to where the mouse click is
textField.setTranslateX(
t.getSceneX() - textField.getLayoutX());
textField.setTranslateY(
t.getSceneY() - textField.getLayoutY());
textField.setText(data.getPieValue() + "");
textField.setOpacity(1.0);
textField.setOnAction((event) -> { // User edit complete
try {
final Double num = Double.valueOf(
textField.getText());
data.setPieValue(num);
resetTextField();
final int currentColumn = yearChoice
.getSelectionModel().getSelectedIndex();
SwingUtilities.invokeLater(() -> {
tableModel.setValueAt(num,
currentRow,
currentColumn);
});
} catch (NumberFormatException e) {
// Just use the original number if the format is bad
textField.setText(data.getPieValue() + "");
}
});
} else { // Do the Pie Wedge animation
resetTextField();
Bounds b1 = data.getNode().getBoundsInLocal();
double newX = (b1.getWidth()) / 2 + b1.getMinX();
double newY = (b1.getHeight()) / 2 + b1.getMinY();
label.setOpacity(0);
label.textProperty().bind(percentBinding);
data.getNode().setEffect(dropShadow);
TranslateTransition tt = new TranslateTransition(
Duration.millis(1500), data.getNode());
tt.setByX(newX);
tt.setByY(newY);
tt.setAutoReverse(true);
tt.setCycleCount(2);
FadeTransition ft = new FadeTransition(
Duration.millis(1500), label);
ft.setToValue(1.0);
ParallelTransition pt = new ParallelTransition(
tt, ft);
pt.play();
}
t.consume();
});
row++;
} // end of for loop
} // end of setupEventHandlers() method
}
Special Behaviors for Other Charts
In addition to the animation and editing added to the Pie Chart, we also added behaviors to the Bubble Chart (selected bubbles rotate using a ScaleTransition) and Bar Charts (selected bars fade in a label displaying the bar’s value). Since we use the same techniques for accessing the chart’s nodes and building transitions based on mouse click events, we leave it to the reader to peruse this code from the book’s download bundle.
15.5 Saving Charts
The SDA application also includes the ability to save any JavaFX chart window to a PNG file. This feature uses a NetBeans Platform conditionally-enabled action and the communication strategies discussed in integrating JavaFX (see “Communication Strategies” on page 261).
Figure 15.18 shows the Save Chart icon on the toolbar and the Save Chart menu item under the top-level File menu. These icons and menu items are enabled when any JavaFX chart window has focus. The chart image saved corresponds to the specific window that has focus. Selecting a non-JavaFX chart window (such as the TableDataEditor window) disables the Save Chart menu selections.
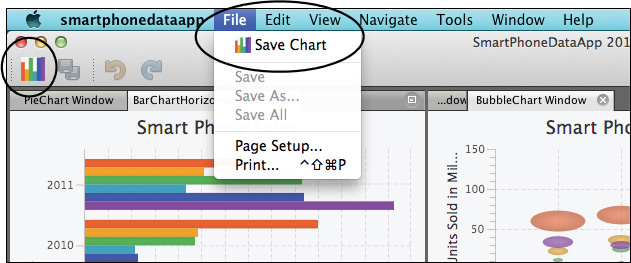
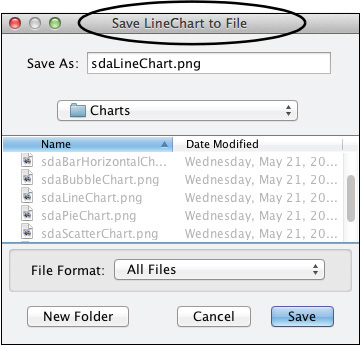
Selecting the Save Chart icon or menu item displays a File Chooser dialog with the name of the chart window to be saved. For example, Figure 15.19 shows a File Chooser for the LineChart window. The File Chooser lets the user select the enclosing folder and file name for the resulting PNG file to be saved to disk.
Here’s a summary of the steps to implement the Save Chart feature.
• Create a module called ChartUtilities with package name org.smartphone.chart.utilities. Make its package public so that other modules can set a module dependency on this module.
• Create ChartSaveCapability and add this interface to the ChartUtilities public package.
• Create conditionally-enabled action ChartSaveAction and specify ChartSaveCapability for its Cookie class.
• Implement the ChartSaveAction using context ChartSaveCapability.
• In each module with a JavaFX chart, add an implementation of ChartSaveCapability to the TopComponent’s Lookup. Invoke the JavaFX controller method getImage() to obtain a BufferedImage of the JavaFX scene graph. Use the appropriate communication strategies between the Swing TopComponent and the JavaFX controller.
ChartSaveCapability
Listing 15.27 shows the ChartSaveCapability interface in the ChartUtilities public package.
Listing 15.27 ChartSaveCapability.jave
package org.smartphone.chart.utilities;
import java.awt.image.BufferedImage;
public interface ChartSaveCapability {
public String getChartName();
public BufferedImage getImage();
}
ChartSaveAction
In module ChartUtilities, add a new conditionally-enabled action called ChartSaveAction. Use ChartSaveCapability as the action’s Cookie class (see “Context-Aware Actions” on page 428 for a discussion of context-aware actions). Implement the actionPerformed() method, as shown in Listing 15.28.
The ChartSaveAction class includes annotations to configure the action in the toolbar and the top-level menu system. The ChartSaveAction constructor defines the ChartSaveCapability as its context. This context is provided by the selected TopComponent through the Global Selection Lookup.
To save the PNG file, the actionPerformed() method invokes the context getChartName() method for the chart name and the getImage() method for the BufferedImage.
The FileChooserBuilder (discussed next) provides a popup dialog that lets users choose a file. The Save Chart action creates the file if it doesn’t exist and prompts if overwriting is okay when the file does exist. Both DialogDisplayer and NotifyDescriptor configure these additional popup dialogs (see Chapter 11 for details on using the Dialogs API).
Listing 15.28 ChartSaveAction.java
@ActionID(
category = "File",
id = "org.smartphone.chart.utilities.ChartSaveAction"
)
@ActionRegistration(
iconBase = "org/smartphone/chart/utilities/saveChartIcon.png",
displayName = "#CTL_ChartSaveAction"
)
@ActionReferences({
@ActionReference(path = "Menu/File", position = 1300),
@ActionReference(path = "Toolbars/File", position = 200)
})
@Messages({
"CTL_ChartSaveAction=Save Chart",
"# {0} - windowname",
"MSG_SAVE_DIALOG=Save {0}",
"# {0} - Filename",
"MSG_SaveFailed=Could not write to file {0}",
"# {0} - Filename",
"MSG_Overwrite=File {0} exists. Overwrite?"
})
public final class ChartSaveAction implements ActionListener {
private final ChartSaveCapability context;
private static final Logger logger = Logger.getLogger(
ChartSaveAction.class.getName());
public ChartSaveAction(ChartSaveCapability context) {
this.context = context;
}
@Override
public void actionPerformed(ActionEvent ev) {
// use a FileChooser to get a user-supplied filename
String title = "Save " + context.getChartName() + " to File";
File f = new FileChooserBuilder(
ChartSaveAction.class).setTitle(title).showSaveDialog();
if (f != null) {
if (!f.getAbsolutePath().endsWith(".png")) {
f = new File(f.getAbsolutePath() + ".png");
}
try {
if (!f.exists()) {
// the file doesn't exist; create it
if (!f.createNewFile()) {
DialogDisplayer.getDefault().notify(
new NotifyDescriptor.Message(
Bundle.MSG_SaveFailed(f.getName())));
return;
}
} else {
// the file exists; asks if it's okay to overwrite
Object userChose = DialogDisplayer.getDefault().notify(
new NotifyDescriptor.Confirmation(
Bundle.MSG_Overwrite(f.getName())));
if (NotifyDescriptor.CANCEL_OPTION.equals(userChose)) {
return;
}
}
// Need getAbsoluteFile(),
// or X.png and x.png are different on windows
BufferedImage image = context.getImage();
if (image != null) {
ImageIO.write(image, "png", f.getAbsoluteFile());
logger.log(Level.INFO, "Image saved to file {0}",
f.getName());
} else {
logger.log(Level.WARNING, "Could not get Image from {0}",
context.getChartName());
}
} catch (IOException ioe) {
Exceptions.printStackTrace(ioe);
}
}
}
}
FileChooserBuilder
FileChooserBuilder is a utility class in the File System API that works with JFileChooser. One nice feature is the ability to remember the last-used directory for a given file. You pass a string key or a class type (here we use the ChartSaveAction class type) to the constructor. The key is used to look up the most recently-used directory from any previous invocations with the same key.
FileChooserBuilder is structured using the “Builder” pattern (like StringBuilder, for example), so it’s possible to chain invocations that simplify the setup of a file chooser. We use the setTitle() method (to provide a title for the dialog) and, to complete the configuration, the showSaveDialog(), which returns the user-selected file as File. Other show dialog methods include showOpenDialog(), which also returns File, and showMultiOpenDialog(), which returns a File[] array and lets users select more than one file.
The return from any show dialog method is null if the user clicked Cancel or closed the dialog without selecting OK.
BufferedImage
BufferedImage is a subclass of AWT’s Image class, and ImageIO is a class containing static convenience methods that encode and decode image data. The following statements write the BufferedImage (an encoding of the JavaFX scene graph) to a file with a PNG format.
BufferedImage image = context.getImage();
. . .
ImageIO.write(image, "png", f.getAbsoluteFile());
Implementing the ChartSaveCapability
Each module with a JavaFX chart TopComponent sets a module dependency on the ChartUtilities module and implements ChartSaveCapability. Listing 15.29 shows how we do this for the LineChartTopComponent. The other JavaFX Chart modules implement ChartSaveCapability the same way.
First, we use InstanceContent and AbstractLookup to add objects to the TopComponent’s Lookup. These objects are exposed to the Global Selection Lookup when the TopComponent has focus. (“Lookup as an Object Repository” on page 225 discusses the Global Selection Lookup.) We then add an implementation of ChartSaveCapability to the TopComponent Lookup.
The implementation of ChartSaveCapability requires overriding two methods. The getChartName() method returns “LineChart” here. The getImage() method invokes the JavaFX controller getImage() method. Here, we must use a countdown latch to wait for the getImage() method to finish executing, since the TopComponent invokes this method on the JavaFX Application Thread. When the method finishes executing, we return the BufferedImage object to the caller. (See Listing 15.7 on page 756 for the JavaFX controller’s getImage() method.)
Listing 15.29 LineChartTopComponent.java—Implement ChartSaveCapability
public final class LineChartTopComponent extends TopComponent {
private static JFXPanel chartFxPanel;
private LineChartController controller;
private BufferedImage image = null;
private final InstanceContent content = new InstanceContent();
public LineChartTopComponent() {
initComponents();
setName(Bundle.CTL_LineChartTopComponent());
setToolTipText(Bundle.HINT_LineChartTopComponent());
// Connect our lookup to the rest of the system, so that
// Save Chart action can access the image
associateLookup(new AbstractLookup(content));
setLayout(new BorderLayout());
//Enable the Print action for the TopComponent:
putClientProperty("print.printable", true);
init();
content.add(new ChartSaveCapabilityImpl());
}
. . .
private class ChartSaveCapabilityImpl implements ChartSaveCapability {
@Override
public String getChartName() {
return Bundle.CTL_LineChartAction();
}
@Override
public BufferedImage getImage() {
if (controller == null) {
return null;
}
final CountDownLatch latch = new CountDownLatch(1);
Platform.runLater(() -> {
// get the JavaFX image from the controller
// must be in JavaFX Application Thread
try {
image = controller.getImage();
} finally {
latch.countDown();
}
});
try {
latch.await();
return image;
} catch (InterruptedException ex) {
Exceptions.printStackTrace(ex);
return null;
}
}
}
. . .
}
15.6 Key Point Summary
This chapter explores the JavaFX Charts API, which lets you visualize data within a NetBeans Platform application. The chapter shows how to use all of the JavaFX charts in the context of a modular system. Here are the key points in this chapter.
• The NetBeans Platform is well suited for a data visualization application with JavaFX charts. The NetBeans Platform modular architecture coupled with the flexibility of the JavaFX charts create compelling charting applications.
• The SmartPhone Data application presents sales data for smartphone companies over a four-year period and uses JavaFX charts to visualize the data. Each chart is configured in a separate module. The application integrates JavaFX charts with a Swing JTable presentation.
• The SmartPhone Data application uses the Global Lookup to access the chart data. This provides flexibility in obtaining alternate sources of data.
• The application extends Swing AbstractTableModel to provide additional methods applicable to JavaFX charts.
• Each chart module includes a TopComponent for display, an FXML file for JavaFX controls, and a JavaFX controller class.
• The chart modules use the communication strategies discussed in Chapter 6 to keep the Swing EDT and JavaFX Application threads properly managed.
• The JavaFX controller class is responsible for building the chart contents, legend, and title.
• The JavaFX controller class supplies a snapshot of the chart window with the scene graph’s root node snapshot() method. This returns a JavaFX Image object. The JavaFX Image is then converted to a BufferedImage with the static SwingFXUtils fromFXImage() method.
• The JavaFX controller class implements a TableModelListener that responds to changes in the displayed data. By default, JavaFX charts update their rendered chart display with animation.
• The JavaFX Chart class hierarchy includes an abstract Chart superclass, an abstract XYChart class for all two-axes charts, and a PieChart class. XYCharts include BarChart, AreaChart, LineChart, ScatterChart, StackedBarChart, StackedAreaChart, and BubbleChart.
• All XYCharts include an X Axis and Y Axis, which is either NumberAxis (numerical values) or CategoryAxis (String values). BubbleCharts require both axes to be NumberAxis types.
• The data type for XYCharts is an ObservableList of Series. Each Series, in turn, is an ObservableList of data items. A data item is an XYChart.Data<X, Y> generic type, where X corresponds to the X axis type (Number or String) and Y corresponds to the Y axis type (Number or String).
• The BubbleChart uses the data item’s extraValue property to set the radius of the rendered bubble.
• A chart’s displayed parts are JavaFX nodes. You can add effects, animations, and event handlers to these nodes.
• Charts use CSS for styling, and you can provide your own chart-specific style classes.
• LineChart, ScatterChart, AreaChart, BarChart, StackedBarChart, and StackedAreaChart are all configured the same way.
• Switch the X and Y axes types to convert a vertical BarChart to a horizontal BarChart.
• The PieChart data is an ObservableList of PieChart.Data items. Each data item represents a portion of a whole and includes a name StringProperty and a pieValue DoubleProperty.
• The SmartPhone Data application lets users select years with a JavaFX ComboBox control in the PieChart window. The selected year corresponds to a column in the TableModel.
• The SmartPhone Data application includes animation effects added for Pie Chart wedges and an in-place editor for changing the selected Pie wedge value.
• Each chart window implements a ChartSaveCapability and installs it in the TopComponent Lookup. This enables the Save Chart menu items when one of the chart windows has focus. The Save Chart feature saves the selected chart window to a PNG file.