
11. Financial Aspects of Pension and Retirement Programs
$6,080,800,000,000. That number is the value of the financial assets invested in U.S. private pension plans at the end of 2011.1 Because it is sometimes difficult to grasp how large a number like $6 trillion is, it may be useful to provide a few comparison points. In fy 2011 total expenditures by the U.S. government, including the military, social security, Medicare and everything else, were $3.6 trillion. Total tax receipts were $2.3 trillion, and the federal budget deficit was $1.3 trillion.2 It’s hard to overstate the financial significance of pension plans in the U.S. economy. How this $6 trillion is invested has a substantial impact on both U.S. and global capital markets. At the corporate level, pension trusts are separate entities and not included in the assets shown on a firm’s balance sheet. Nevertheless, pension finance can be among the most critical issues a firm faces. In some large firms the individuals managing their pension trusts are responsible for a portfolio of assets larger than the value of the firm. For example, at the end of 2011, the assets in Alcoa’s pension trust were valued at $10.3 billion,3 and the market value of Alcoa’s outstanding stock was $9.2 billion. Lockheed Martin’s pension trust at the end of that year was valued at $27.3 billion4 while its market cap was $26.2 billion. At the individual level, there is no question about the importance of pensions and retirement savings in every family’s financial planning. In the United States, there are basically three types of pension plans.
Defined Benefit (DB) Plans
Under defined benefit (DB) plans there is a formula established by management or negotiated with a union that defines the pension benefit employees will receive in the years after they retire. These benefits are typically tied to the employee’s salary level and/or years of service. Firms pre-fund these plans by making contributions to a common pension trust. There are no individual employee accounts. If the investments in the trust do not perform well, the firm needs to make additional contributions to provide the promised benefits. The investment risk associated with DB plans therefore falls upon employers. DB plans are sometimes referred to as traditional pension plans.
Defined Contribution (DC) Plans
Under defined contribution (DC) plans employees are not guaranteed any specific level of retirement benefits. A formula determined by management or negotiated with the union defines the amount of the contributions a firm must make to each employee’s account while they are employed. Separate investment accounts are established for each employee, and a contribution to this account is typically made each pay period. In some cases the employer contributions are supplemented by required or voluntary employee contributions. If the investments in an employee’s DC account do not perform well, that individual will have less money to retire on. The investment risk associated with DC plans therefore falls upon employees. The most common form of DC plan in the United States is the 401(k). Section 401(k) of the U.S. Internal Revenue Code specifies the major tax advantages of these plans. Employers receive a tax deduction for their contribution to the employee’s accounts, but those contributions and the earnings on those contributions are usually not taxable to the employee until they are distributed at retirement.
Hybrid Plans
Technically, hybrid plans are DB plans because there is a defined retirement benefit and all funds are invested in a common trust. However, hybrid plans attempt to combine the most attractive features of DB and DC plans. The most common form of a hybrid plan is a cash balance plan (CBP). Under a CBP employees accrue benefits under a fixed formula as they would in a traditional DB plan. Each period the firm allocates pay credits (not actual dollars) to an account in the employee’s name. These credits are usually equal to a percentage of the individual’s salary. The balances in these accounts are then increased each year by a plan-specified growth rate. At retirement employees receive a lump sum payment equal to the balance in their account or an annuity based on that balance. The investment risk to employees is less than in DC plans because the employer is obligated to pay the promised retirement benefit. The investment risk to the employer may be less than in traditional DB plans because the annual growth rate can be adjusted over time if actual investment returns fluctuate.
The Shift from DB Plans to DC Plans
Exhibit 11-1 shows that in 1975 there were twice as many participants in DB plans as in DC plans. That situation has reversed, and there are now twice as many participants in DC plans as in DB plans. In 1975, as shown in Exhibit 11-2, the dollar value of contributions to DB plans was greater than the dollar value of contributions to DC plans. Today, contributions to DC plans are almost 3 times contributions to DB plans. Most of that reversal is the result of the growth in DC plans, not a decline in the number of DB plan participants. The number of participants in DB plans is roughly the same today as 30 years ago (refer to Exhibit 11-1). Few new DB plans are created, but for years to come they will continue to have a significant impact on the U.S. economy and to be of critical importance to those firms with large DB plans. A number of explanations have been offered for the shift from DB to DC plans. DB plans are often back-loaded; that is, the largest increases in value occur as workers approach retirement. That feature is increasingly less attractive as workers become more mobile, changing jobs multiple times during their careers. DC plans are more portable and in most cases impose no penalty on workers who change jobs. From the employer’s perspective DC plans have more predictable cash flow requirements, are not subject to invest risk, and are far easier to administer. Depending on the plan’s features, DC plans may also be much less expensive to fund.
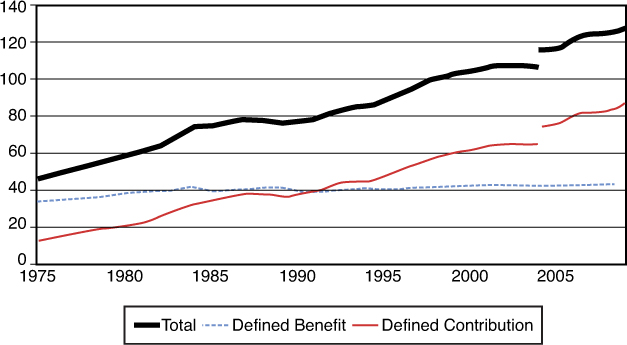
Exhibit 11-1. Millions of participants by pension plan type, 1975–2009
Source: U.S. Department of Labor Employee Benefits Security Administration, Private Pension Plan Bulletin: Historical Tables and Graphs, March 2012, page 6. The series breaks in 2005 are due to changes in the USDOL definition of plan participant.

Exhibit 11-2. Pension plan contributions in billions by type of plan, 1975–2009
Source: U.S. Department of Labor Employee Benefits Security Administration, “Private Pension Plan Bulletin: Historical Tables and Graphs,” March 2012, page 18.
Pension Accounting
Pension trusts and the firms that sponsor them are separate legal entities. The firm and the pension plan each have their own separate accounting records and financial statements. The following discussion is limited to the way pension costs and pension obligations are shown on the firm’s financial statements. The accounting for DC plans is straightforward. The employer’s annual pension expense is simply the amount that under the terms of its DC plan it is obligated to contribute to the pension trust. The employer reports a liability on its balance sheet only if it does not make that contribution in full. The employer records an asset only if it contributes more than the required amount. The accounting for DB plans is more complex. FASB Accounting Standards Codification Section 715 Compensation - Retirement Benefits: Defined Benefit Plans (formerly SFAS 87 and SFAS 106) spells out these requirements in considerable detail. Because this book is aimed at HR managers, not accountants, a discussion of these details is unnecessary. Instead, the key provisions of ASC 715 can be illustrated using excerpts from the pension footnotes in the 2008 annual report of Verizon Communications, Inc. Verizon is a global broadband and telecommunication company and a component of the Dow Jones industrial average.
Calculating Defined-Benefit Pension Obligations
Before looking at the Verizon case study, it is probably useful to review a few definitions and concepts. Defined benefit pension plans typically provide retirement benefits that are a function of years of service and final salary. For example, a firm might promise retirees an annual pension benefit equal to years of service × 2% × average salary in last 3 years of employment. Under that formula, an employee retiring with 30 years of service and an average final salary of $90,000 would receive an annual pension of $54,000 (30 × 2% × $90,000). Suppose this employee retires on his 65th birthday and the actuarial tables tell us his life expectancy is 85 years. How much does the firm need to have in its pension trust on the day he retires to have fully fund his retirement benefits? To have fully funded its pension obligation to this employee, the firm must have on hand the present value of $54,000 per year for 20 years. If you assume the annual investment return on the assets in the pension trust is 6%, that amount is $619,376. That amount was calculated in cell G11 of the spreadsheet in Exhibit 11-3 by entering the formula =NPV(0.06,C12:C31).

Exhibit 11-3. Calculating the present value of anticipated pension payments
Now suppose today is this employee’s 55th birthday and he is still 10 years away from retirement. How much must the firm have on hand today to fully fund his retirement benefits that will not start for another 10 years? The answer is $345,856. That amount was calculated in cell G2 with the formula =NPV(6%,C2:C31). The amount needed today is less because it will grow for 10 years at a compounded annual rate of 6% before the firm begins drawing on it to make pension distributions. In the jargon of the pension accountants, that $345,856 number is the PBO, the projected benefit obligation to this employee. You can now calculate the PBO for the entire workforce by performing analogous calculations for each of the other plan participants and then summing those results.
You must understand the assumptions that were required to estimate the projected benefit obligation. Those assumptions include the fact the employee would not leave before he was vested in the pension plan, the age at which the employee would retire, years of service and final average salary on the retirement date, and the number of years the employee would live after retirement. An additional key assumption is the discount rate used to calculate the present value of the projected retirement benefits. Clearly it is possible, in fact probable, that a firm’s actual experience will differ substantially from these assumptions. Nevertheless, the PBO is your best available estimate of the present value of what the firm has promised its employees under the terms of its defined-benefit plan. If you work with pensions, however, you see that firms utilize three different measures for their pension obligations. These are the projected benefit obligation (PBO), the accumulated benefit obligation (ABO), and the vested benefit obligation (VBO). Exhibit 11-4 shows the differences between these three measures.
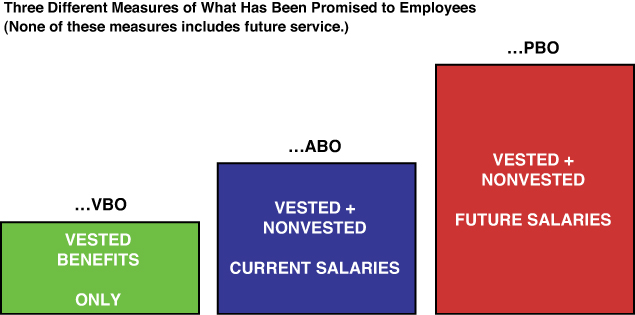
Exhibit 11-4. Vested benefit obligation, accumulated benefit obligation, and projected benefit obligation
Most DB plans require a specific number of years of service before an employee is vested in the plan. Employees who leave before becoming vested are not entitled to pension benefits. The vested benefit obligation, the VBO, is the present value of anticipated future payments to employees who are already vested. That is the most conservative, the smallest, of the three measures. It is the present value of the pension benefits that have already been earned. Stated another way, it is the present value of the benefits that must be paid if the firm went out of business today. The accumulated benefit obligation, the ABO, is the present value of anticipated future pension payments to both vested and nonvested employees based on their current salaries. The largest of the three measures is the PBO, the projected benefit obligation. It is based on projections of what employee salaries will be at the time they retire. In pension plans in which retirement benefits are not tied to salary level, the PBO equals the ABO.
Corporate financial reporting focuses primarily on the PBO, but the ABO must also be disclosed. The VBO is a measure used primarily by the Pension Benefit Guarantee Corporation (PBGC). The PBGC was created by the federal government through the Employee Retirement Income Security Act of 1974 (ERISA). The PBGC acts as an insurer that provides retirement benefits to participants in failed DB plans. The PBGC is not funded by tax revenues but by insurance premiums paid by the sponsors of defined benefit pension plans. The more underfunded a pension plan is, the larger the premiums it must pay. The PBGC measures the underfunding by comparing a plan’s assets to its vested benefit obligation. When value of what’s on hand (the plan assets) is less than the value of what has been promised (the VBO), the premium increases. The VBO is the smallest of the three benefit obligation measures, so this process results in smaller premium charges than if underfunding had been judged by comparisons to the ABO or the PBO.
How Do You Think Pension Expense Should Be Defined?
HR managers who do not understand how pension costs are calculated will find it difficult to effectively manage those costs. How do you think pension expense should be defined? Consider the following information describing Verizon’s 2008 defined-benefit pension plans.
During that year

Some might argue based on that experience, Verizon should have subtracted $13.3 billion in pension expense on its 2008 income statement. Actually, Verizon subtracted no pension expense in 2008. Verizon added in $341 million of pension income! How did Verizon do that? They did it by complying with generally accepted accounting procedures. To understand how Verizon determined that it had pension income, not pension expense, you need to review the information contained in the footnotes to Verizon’s financial statements.
Understanding the Pension Footnotes in a Firm’s Annual Report
The data in Exhibit 11-5 is excerpted from the financial statement footnotes in Verizon’s 2008 annual report. At the end of 2008, the projected benefit obligation (PBO) under Verizon’s DB pension plans was $30.394 billion. The value of the assets in Verizon’s pension trusts at the end of 2008 was $27.791 billion. These plans were underfunded by $2.6 billion ($30.395 billion in obligations minus $27.791 billion in assets). The difference between the PBO and the current fair value of plan assets is the funded status of the plan. That amount is shown on the bottom row of this table. Note that in 1 year, Verizon’s pension plans went from being overfunded by approximately $10.2 billion to being underfunded by more than $2.6 billion—a swing of almost $13 billion in one year!
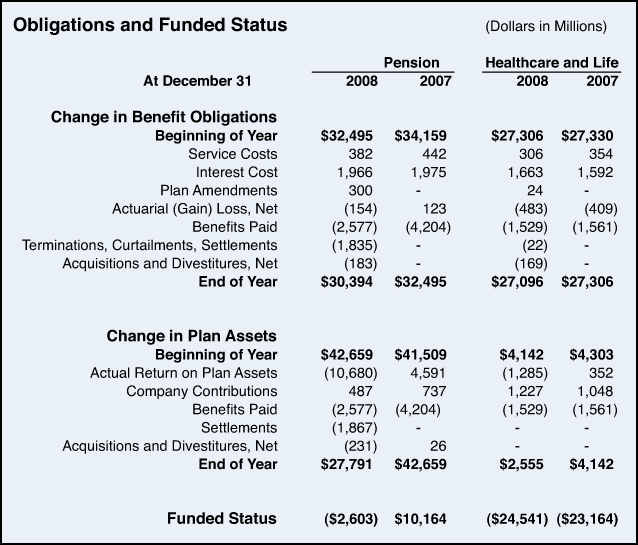
Exhibit 11-5. Excerpt from financial statement footnotes in Verizon 2008 Annual Report
Source: Verizon Communications 2008 Annual Report, page 61.
One of the most important changes brought about by ASC 715 was that in addition to disclosing the funded status of their DB plans in a footnote to their financial statements, firms must include the amount of any underfunding as a liability on their balance sheet. This makes it easier for financial statement users to assess the impact of DB plans upon a firm’s financial condition. Verizon included a $10.2 billion pension related asset on its 2007 balance sheet. On its 2008 balance sheet, that became a pension related liability of $2.6 billion. Between 2007 and 2008, the value of Verizon’s shareholders equity declined by almost $13 billion for reasons related to its pension plan and not to its business operations. ASC 715 requires that the liability shown on the balance sheet be the underfunding in the PBO. The ABO must however also be disclosed. In a paragraph that followed the table excerpted in Exhibit 11-5, Verizon reported that the accumulated benefit obligation under its DB pension plans was $29.405 billion and $31.343 billion on December 31, 2008, and December 31, 2007, respectively.
Other Post-Retirement Benefits
Verizon also provides medical and life insurance benefits to its retirees through its other post-retirement benefit plans. The obligations and assets associated with these nonpension plans are also shown in Exhibit 11-5. At the end of 2007 and 2008, these plans added approximately $24 billion more to Verizon’s unfunded obligations. There is one significant difference between the accounting for pension plans and the accounting for other post-retirement benefits. For pension plans, ASC 715 requires that the funded status be measured as the difference between the fair value of plan assets and the projected benefit obligation. For other post-retirement benefits, ASC 715 requires that the funded status be measured as the difference between the fair value of plan assets and the accumulated benefit obligation. At the end of 2008, the total benefits-related liability shown on Verizon’s balance sheet was more than $27 billion ($2.603 billion in pension liabilities + $24.541 billion in other post-retirement benefit programs). That’s a number that will get the attention of any CFO.
Pension Expense Is One Component of the Operating Expenses Shown on the Income Statement
The previous discussion considered the pension-related assets or liabilities that show up on a firm’s balance sheet. ASC 715 also specifies the process for calculating the pension expense that is recognized on a firm’s income statement. As mentioned, in 2008, Verizon’s pension investments lost $10.7 billion, and the company paid out $2.6 billion for retirement benefits. Still there was no pension expense shown on Verizon’s income statement. Instead Verizon reported $341 million of pension income. How did it do that? It did it by following the requirements of ASC 715. The calculation Verizon used is shown in Exhibit 11-6. The general approach is to sum the components that increase a firm’s PBO and then to subtract from that total the return on the assets in the pension trust. That makes sense. Your pension cost increases are offset to some degree by what you earn on funds that are already in the pension trust. The process is, however, a bit more complicated than that. At the beginning of each fiscal year, firms are required to project what they expect to earn on the assets in their pension trust. Financial statements are, of course, prepared after the fiscal year ends, and by that time, firms know both what they had expected to earn and what they actually did earn on the assets in the pension trust. Nevertheless, ASC 715 requires that when calculating pension expense, firms reduce their pension cost not by what the pension assets actually earned, but by what they had been expected to earn. That’s done even in a year when the expectation is for large gains, and the actual performance turns out to be big losses. Why do that? Before exploring the logic behind this requirement, it is probably useful to clarify the definitions of the pension cost components, as shown in Exhibit 11-6.
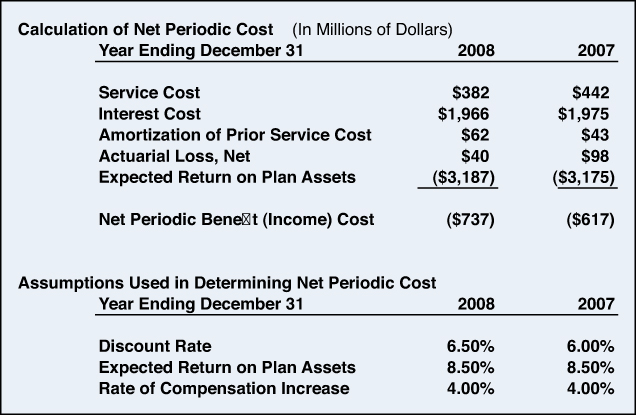
Exhibit 11-6. Calculation of pension expense recognized on Verizon’s 2008 Income Statement
Source: Verizon Communications 2008 Annual Report, pages 62 and 63.
Service Cost
The service cost is the increase in the PBO that results from the fact that employees at the end of the year will have 1 more year of service than they did at the start of the year. The plan’s benefit formula is, of course, key to determining the size of that increase.
Interest Cost
The interest cost is the increase in the PBO that results because at the end of the year employees will be 1 year closer to retirement than they were at the start of the year. For example, assuming as Verizon did a 6.5% discount rate, the present value of $100,000 needed 2 years from now is $88,166 ($88,166 × 1.065 × 1.065 = $100,000). The present value of $100,000 needed 1 year from now is $93,897 ($93,897 × 1.065 = $100,000). The difference between those two numbers ($5,731) is the interest cost of getting 1 year closer to retirement. The service cost reflects the increase in the amount of benefits the firm must pay. The interest cost results from the fact that there is now a shorter period before it must start paying them.
Amortization of Prior Service Cost
Prior service costs are incurred when a plan amendment increases the pension benefits attributable to service prior to the current period. These costs are not charged fully during the year in which the plan change occurs. They are amortized, that is, spread out over a number of years.
Actuarial Loss, Net
To estimate its future pension payments, a firm must make a large number of actuarial assumptions, for example, turnover rates, rate of future wage increases, retirement patterns, and life expectancies. These assumptions are continually reassessed, and when necessary pension cost estimates are adjusted to correct for actual experiences that are more or less costly than had been anticipated. In Exhibit 11-5 this adjustment was to recognize a net actuarial loss. The firm’s pension expenses are $40 million more than implied by the earlier actuarial assumptions. Such adjustments can, of course, result in a net actuarial gain. That would occur when the firm’s pension expenses are less than implied by the earlier actuarial assumptions.
Expected Return on Plan Assets
At the start of 2008, Verizon expected to earn an 8.5% return on the assets in its pension trust. This and the other assumptions that Verizon was required to make to estimate its pension expense are shown at the bottom of Exhibit 11-6. Multiplying the expected rate of return of 8.5% by the average value of the plan assets in 2008 yields the expected dollar return of $3.187 billion. The calculation in Exhibit 11-6 reduced Verizon’s annual pension expense by the amount of this $3.187 billion expected return, rather than by the amount of the 2008 actual return (shown in Exhibit 11-5) which was a $10.680 billion loss. Now say that again. The pension expense was calculated assuming a $3.187 billion gain, whereas the reality was a $10.680 billion loss. The rationale for and the implications of this approach are discussed in the next section.
Why Base Costs on the Expected Rather Than the Actual Return on Plan Assets?
What would be the consequences if the net pension expense on a firm’s income statement were calculated as current service and interest costs minus the actual earnings on the assets in the pension trust? Remember that many large firms have pension assets worth billions of dollars. In a year when the stock market rose by say 30%, the actual earnings on a firm’s pension trust might be greater than the service and interest costs for its pension plan. In that year the firm would have net pension income rather than a net pension expense. That could produce a big jump in the net profit shown on the bottom line of the firm’s income statement. Similarly, in a year when the stock market declined dramatically, the return on the pension assets could be a multibillion dollar loss, reducing the firm’s pretax profit by an equal amount. Exhibit 11-5 shows Verizon’s actual pension plan returns for 2007 and 2008. These assets grew in 2007 by almost $4.6 billion, but in 2008 they declined by almost $10.7 billion. That’s a swing of almost $15.3 billion. Had Verizon’s pension expense been calculated using these actual returns, its pension expense would have increased by almost $15.3 billion between 2007 and 2008. That would have produced a corresponding $15.3 billion drop in Verizon’s corporate profits for reasons unrelated to the success of its telecommunications businesses. Smaller firms would experience smaller impacts, but those impacts could be just as significant relative to the size of their net profits. Some financial analysts argue that if pension expense were calculated using the actual earnings on the pension trust, the resulting large swings in bottom-line net income would be misinterpreted by many individuals as fluctuations in the profitability of the firm’s business operations. Others argue that calculating pension expense in this manner would lead to more accurate reporting. That’s an ongoing debate.
At the moment, current accounting standards require firms to use the approach illustrated in Exhibit 11-6. Subtracting the expected return on plan assets rather than the actual return on plan assets is an attempt to smooth out the volatility in pension expense. The expected rate of return is the average rate of earnings expected over the long term given the mix of investments in the pension trust. If this assumption turns out to be correct, there will be just as many years when the actual return exceeds the expected return as there will be when the actual return falls short of the expected return. If over time the better-than-expected returns offset the less-than-expected returns, using this approach will produce no distortion in the firm’s long-run pension expense. But what if this assumption is incorrect and the better-than-expected and the less-than-expected returns don’t offset each other? To deal with this possibility, the accounting profession created a procedure known as the corridor method.
Corridor Method Used to Smooth Pension Expense
Under the corridor method prescribed by ASC 715, firms maintain a record of the cumulative net amount by which the actual return on plan assets differs from the expected return. For example, if last year the assets of the pension trust earned $10 million more than expected and this year earned $12 million less than expected, the cumulative net balance would be –$2 million. This record is maintained in an account called Other Comprehensive Income (OCI). If the firm has made a good estimate of the long-run rate of return, then over time the better-than-expected returns and the weaker-than-expected returns will be approximately the same magnitude, and the net balance in this OCI account will hover around zero. It is possible, however, that little or no offsetting will occur and that the balance in this account will grow to either a large positive or a large negative number.
Only when it becomes “too large” does the balance in this account affect the firm’s income statement. ASC 715 defines too large as a positive or negative balance whose absolute value is greater than 10% of the size the pension plan. The size of the pension plan is measured as the PBO or the value of plan assets, whichever is the larger number. For example, suppose the PBO is the larger number and is $50 million. Ten percent of $50 million is $5 million. As long as the balance in this account ranges between –$5 million and +$5 million, the difference between the actual and expected earnings has no impact on the income statement. If the balance in this account were to fall to say –$7 million, an additional $2 million pension expense would be recognized on the firm’s income statement. If the balance in this account rose to say +$6 million, $1 million in pension income would be recognized on the firm’s income statement. The amount by which these balances are beyond the upper or lower limit of the corridor is not recognized fully on the current income statement but is amortized, that is, spread out, over a number of years. A graphical illustration of how the corridor width can change over time is shown in Exhibit 11-7.
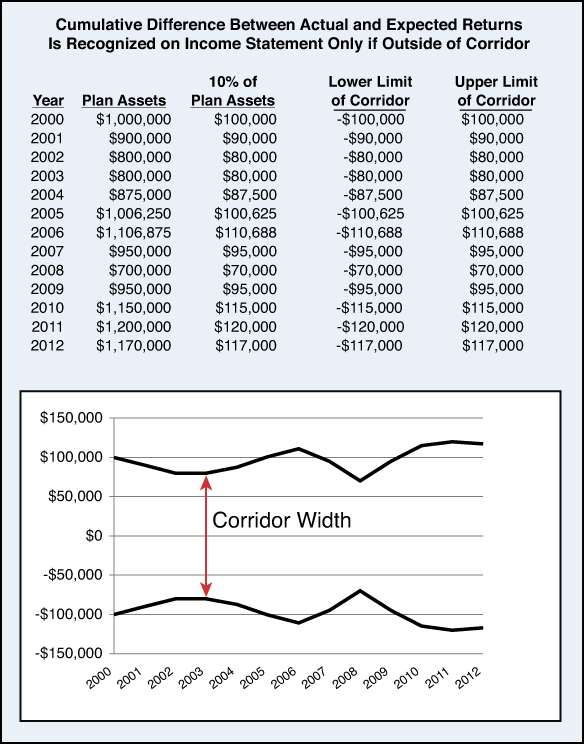
Exhibit 11-7. Corridor method used to smooth pension expenses
Defined-Benefit Pension Plans Hit by the Perfect Storm
The perfect storm label is becoming a cliché, but it does seem appropriate when discussing the status of defined-benefit pension plans. These plans over the last decade have been hit with a perfect storm of economic forces. The demography of the workforce is changing. More individuals are in or are approaching retirement. These individuals are living longer. In manufacturing and other industries in which the workforce is declining, the ratio of retirees to active employees is rising. Since 2000, the investment returns earned on DB plan assets have been extremely volatile and often far less than expected. Interest rates are also at historic lows, which has caused the measures of DB plan obligations to surge. The combination of weaker investment returns and larger plan obligations have made under-funding a serious concern. As shown in Exhibit 11-8, pension plan underfunding in the largest U.S. corporations has grown to record levels. In aggregate these plans were fully funded in 2007 but now have a combined shortfall of almost $355 billion. Of the companies in the S&P 500 index, only 18 have fully funded DB plans. At the end of 2011, seven (General Electric, AT&T, Boeing, Exxon Mobil, Ford Motor, IBM, and Lockheed Martin) had DB plans underfunded by more than $10 billion. The company with the greatest underfunding was General Electric. GE’s pension obligations exceeded its pension assets by $21.6 billion.5
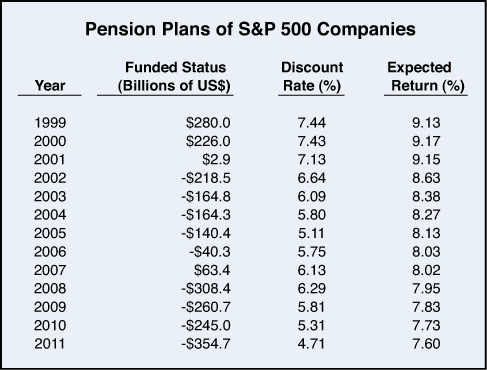
Exhibit 11-8. Pension underfunding at record levels
Source: S&P 500 2011 Pension and Other Post Employment Benefits, S&P Dow Jones, LLC., July 2012, Exhibit, page 5.
The Impact of Interest Rates on DB Plan Obligations
The Federal Reserve has forced interest rates to artificially low levels hoping that will stimulate the economic recovery. It is clear how weak economic conditions can lower the return on pension plan assets, but how do low interest rates affect pension plan obligations? The projected benefit obligation, the PBO, is the present value of the benefits a firm projects that it must provide under the terms of its DB pension plan. One of the requirements of ASC 715 is that a firm discloses the discount rate it uses to calculate this present value. The discount rate Verizon used in 2008 was 6.5%. The discount rate it used in 2011 was 5.0%. What’s the impact of a discount rate reduction of that magnitude? You can easily create a simple spreadsheet to see the impact. The hypothetical described in Exhibit 11-9 is an employee who will retire in 10 years and receive a pension of $60,000 per year for the rest of her life. The formula in cell H7 is =NPV(6.5%,C2:C31) and the formula in cell H11 is =NPV(5%,C2:C31). The drop in the interest rate increases the present value of the pension obligations to this employee from $352,191 to $459,043. As discussed in Chapter 7, “Capital Budgeting and Discounted Cash Flow Analysis,” the present value of any future amount rises as the interest rate declines. Suppose the firm’s obligation to this employee had been fully funded when that obligation were calculated using a 6.5% discount rate. With no change in the amount of pension benefits the employee will receive and no change in the value of assets in the pension trust, a drop in the discount rate to 5% would mean the firm’s pension obligation to this employee was suddenly underfunded by more than almost $100,000 ($413,139 – $316,972).
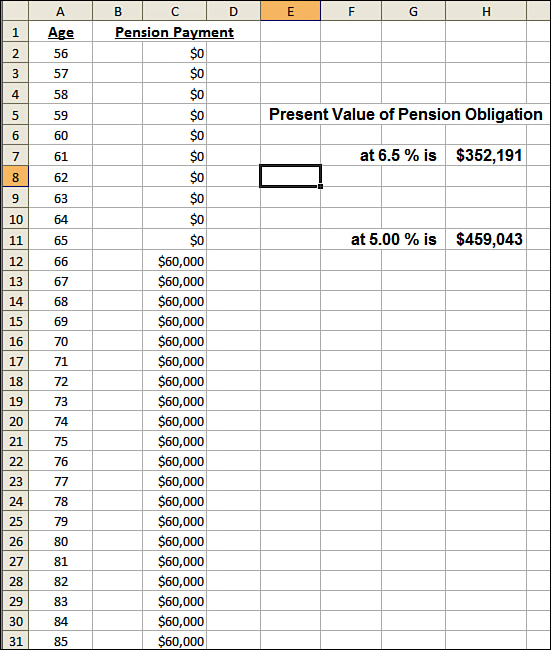
Exhibit 11-9. Impact of interest rate on present value of pension benefits
How Do Firms Select the Appropriate Discount Rate?
ASC 715 requires that the discount rates firms use to determine their pension obligations be tied to the yield on high-quality corporate bonds. Because of the actions the Federal Reserve has taken in its efforts to stimulate the economy, interest rates in 2012 are at historically low levels. These low rates increase PBOs and reduce funded status, putting pressure on firms to make larger cash contributions to their DB plans. To ease this pressure, at least temporarily, Congress passed and President Obama signed into law on July 6, 2012, a provision that enables companies to calculate discount rates based on a 25-year average, instead of the 2-year average that had been previously mandated.6 The average interest rate over the last 25 years is, of course, much higher than the average rate during the last 2 years. Using a higher rate reduces their calculated PBO, and a number of major firms have already begun to take advantage of this provision. For example, General Electric CEO Jeff Immelt has stated that because of the recent law change, GE’s cash pension contributions in 2012 and 2013 will be $2.5 billion less than it had previously expected. Sears Holdings has also announced that because of this provision, it will cut its expected 2013 pension contribution by 40% to 50%.7 Did this increase in the acceptable discount rates actually reduce pension costs? No, it reduced only the calculated PBO. This provision had no effect on the level of pension benefits firms must pay out in the future. It is certainly possible that the effect of reducing their short-term pension contributions will be that these firms must make larger contributions in the future.
Changes in Pension Assumptions Can Alter Corporate Profits
In 2008, Verizon projected that the long-run rate of return on the assets of its pension trust would be 8.5%. Exhibit 11-8 shows that Verizon’s assumption was slightly above the 7.95% average for companies in the S&P 500 index. How does the expected return assumption affect a firm’s financial statements? The expected investment return does not affect the funded status of a DB plan or the amount of pension liability shown on the firm’s balance sheet. The level of underfunding or overfunding is determined at the end of each year by comparing the PBO to the value the assets in the pension trust (refer to Exhibit 11-5). The year-end value of those assets is a function of how much they actually gained or lost during the year. In 2007 (refer to Exhibit 11-5) the actual return on the assets in Verizon’s pension plans was a gain was $4.6 billion, but in 2008, the actual return was a loss of $10.7 billion. It is the actual, not the expected, return on plan assets that determines funded status and the amount of the pension liability or pension asset shown on a firm’s balance sheet.
The expected return does, however, impact a firm’s bottom line profits, EPS, and possible its stock price. Under ASC 715, firms are required to estimate pension expense using the process shown in Exhibit 11-6. If everything else remained constant, making an aggressive (high) assumption about the expected return would reduce a firm’s current pension expense. That in turn would increase the firm’s bottom line profit. Of course, if the expected rate of return assumption is excessive, the firm will eventually accumulate a shortfall outside of the pension corridor and be forced to recognize an additional expense on its income statement. That recognition may, however, be many years into the future and may not serve as a deterrent to a management seeking a short-run earnings boost. Verizon lowered its expected investment return from 8.5% in 2008 to 8.0% in 2011. A change in that direction would, other things equal, increase pension expenses and decrease bottom-line profits.
De-Risking Defined Benefit Pension Plans
Many organizations are making changes designed to alter the risk associated with their DB pension plans. These changes are motivated at least in part by the recent increases in stock market volatility and the fact that a liability reflecting any pension underfunding pension must be included in a firm’s balance sheet. Often referred to as de-risking strategies, these actions have as their goal either reducing pension risk or transferring that risk from the firm to another party. Risk reducing strategies are usually implemented through changes in the way the pension assets are invested. A number of firms have adopted a liability-driven investment strategy. These firms begin with estimates of the amount of cash that will be needed in each future year (the liabilities) and then select investments that provide cash in a pattern that corresponds with these needs. That typically means reducing the percentage of pension assets invested in stock and increasing the percentage invested in long-term bonds. The trade-off, of course, is that these more predictable investments provide lower returns. Some have argued that this may be a particularly inopportune time to shift to a strategy of this type because it would mean locking in interest rates that are at historically low levels. There are also variations on this strategy that use complex financial instruments designed to hedge interest rates and wage inflation. The expectation is that these instruments will rise in value if interest rates and wage inflation increase, thus offsetting, at least in part, the increases in pension costs that would be caused by higher interest rates and wage inflation.
Transferring DB Risk to Employees
As an alternative to, or sometimes in combination with risk-reducing strategies, a number of high-profile firms have adopted risk transfer strategies. These typically involve transferring pension risk from the firm to employees and/or insurance companies. For example, Ford and General Motors recently announced lump sum payout offers designed to transfer pension risk to participating former employees.8 At the end of 2011, GM’s pension obligation was $134 billion and Ford’s was $74 billion. The offers were extended to more than 140,000 Ford and GM retirees. Retirees accepting the offer would in exchange for relinquishing their entitlement to pension benefits for life be given a one-time lump sum payment. When an individual accepts the offer, the costs to GM and Ford are fixed (the amount of the lump sum), and all investment risk is transferred to the retiree. Investing those lump sum payments, some close to $1 million in value, becomes the responsibility of the retiree. If the investments perform well, the former employees may enjoy retirement income greater than what they would have received under the terms of the pension plan. If the investments perform poorly, the reverse may be true. The attractiveness of the lump sum offer to individual employees depends upon their life expectancy and numerous other factors.
Transferring DB Risk to Insurance Companies
The GM plan also provides an example of transferring pension risk to an insurance company. For those employees who do not opt for the lump sum payment, GM will purchase annuity contracts from Prudential Insurance. These contracts require Prudential to provide the retirees with exactly the same income stream they would have received from GM’s pension plan. This device fixes the cost to GM (the amount it pays Prudential for the annuity) and transfers all the investment risk. If Prudential’s own investments perform poorly, they may find in the future that they underpriced those annuities. Of course, it’s equally possible that Prudential’s investments will perform better than they projected.
Freezing DB Pension Plans
Other firms (for example, IBM, HP, and Sears) have chosen to mitigate their pension risk by freezing their DB plans. Data gathered by Towers Watson, an HR consulting firm, shows that of the DB plan sponsors in the Fortune 1000, 56% have at least one plan that is either frozen or closed to new hires.9 Some freezes enable current workers to continue in their existing DB plan but offer new workers only a DC plan. Other freezes end DB accruals entirely for all workers. Workers do not lose the defined benefits they have earned up to the date of the freeze, but these benefits no longer increase with future work or pay increases. In place of future DB accruals, employers typically offer a new DC plan. Typically, these replacement DC plans do not produce retirement benefit equal to what the workers would have received under the frozen DB plans. The net effect is that with these freezes employers generally have less risk and lower costs. Employees assume more investment risk, and unless they make additional contributions out of their personal funds will in most cases receive smaller retirement benefits.
DC plans Are Simpler for Employers, More Complex for Employees
Why do so many employees save so little for retirement? Part of the answer is simply that they have competing and more immediate needs that must be paid for from their current income. These competing needs place great pressure on many households, particularly those at lower-income levels. Nevertheless, studies in an emerging field called behavioral finance indicate that many individuals fail to allocate their financial resources in a manner that would be in their own best interest. One of the reasons for this is the tendency to avoid or at least delay complex decisions. DC plans require employees to make difficult decisions about whether to participate, how much to save, and how to invest. The tendency to put off or completely avoid complex decisions is a major factor affecting 401(k) enrollments. An increasing number of firms address this issue through provisions that automatically enroll employees in a 401(k) program unless they explicitly opt to not be included. Deciding how much to invest is a complex decision, which involves allocating limited resources across multiple goals (for example, providing a comfortable home for one’s family, helping a child pay for college, and providing for one’s own retirement). Some firms provide access to financial planning services as an employee benefit. Yet even with access to such services, you shouldn’t underestimate the complexity of the planning tasks that DC plans impose on employees. Deciding how to invest is the task many employees find most intimidating. Many employees, including highly educated employees, have limited familiarity with alternative investment vehicles and are unfamiliar with the basic concepts of portfolio theory. Still, they will be required to make portfolio allocation decisions that could have a major impact on the quality of life during their retirement years.
Firms May Unintentionally Influence DC Plan Choices
The following is just one of many possible examples of how individual employees might manage their 401(k) assets differently than the way professionals manage DB plan assets. Assume that as shown in Scenario 1 in Exhibit 11-10 an employee’s 401(k) plan offers a choice between only two investment vehicles: Investment B that is low risk and Investment C that is high risk. What investment mix should the employee choose? The answer, of course, depends on the individual’s financial situation and his risk preferences. Suppose, however, that when faced with this choice, the employee reasons that he doesn’t want to do anything extreme, so he puts 50% of his assets into Investment B and 50% into Investment C. To simplify this illustration, assume that the risk level associated with each of the investments in this example can be measured on a 1 to 4 scale. Investment B is a 2 and Investment C is a 3, so under scenario one, the average portfolio risk level would be 2.5.
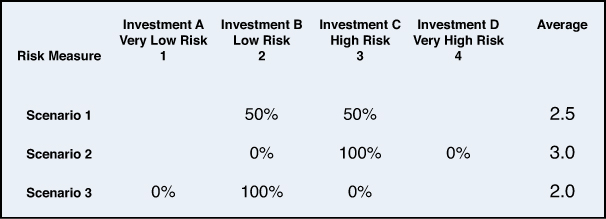
Exhibit 11-10. Allocation of 401(k) assets for a hypothetical employee
What would have happened if this employee had instead been faced with Scenario 2 (the option to choose among B, C, and D)? Under Scenario 2, would he have perceived Investment C to be the middle ground choice and given his strategy of avoiding extreme allocations, put 100% of his 401(k) assets into C (or equivalently divided his assets equally between B, C, and D)? If so, the risk level of the portfolio would have increased from 2.5 to 3.0, not because the employee’s risk preferences increased, but because the range of alternatives offered colored the employees perception of investment C. An analogous hypothesis could be made that offering the alternatives in Scenario 3 would have led to a portfolio with an average risk level of 2.0. Of course, a professional investment manager believing that 2.5 was the optimal risk level could have easily achieved a portfolio matching that requirement under any of the three scenarios. One implication of this example is that firms may be unknowingly and unintentionally influencing the investment choices made by their employees. It is difficult to avoid unintentionally influencing employee investment decisions through the mix of choices offered and the way each of those choices are described. Academic studies using experiments and actual data from retirement plans have documented how the menu of funds has a strong effect on portfolio choices.10
Intentionally Influencing DC Plan Choices
One alternative to unintentionally influencing employee investment choices is to intentionally shape those choices. Critics might argue that such strategies are inappropriately paternalistic, but a number of firms are adopting plan design features intended to help employees invest more wisely. The Pension Protection Act of 2006 expanded the ability of employers to implement such features without fear of legal liability for market fluctuations or other adverse investment outcomes. This legislation sanctioned a new class of default investments for DC plans, qualified default investment alternatives (QDIAs). Life-cycle or target maturity funds, which qualify as QDIAs, require employees to select a portfolio based only on an expected year of retirement. The fund managers then make the initial portfolio allocations and continue to rebalance the portfolio until the target or maturity date. Although devices such as life-cycle funds may improve investment outcomes for many individuals, there are downsides to any one-size-fits-all approach. Such funds cannot take into consideration an employee’s nonpension assets and financial obligations and may therefore result in allocations different from those that would come out of a more holistic financial planning process.
Improving Employee Ability to Make Their Own Choice
An alternative to providing employees with better default choices is, of course, to increase the ability of employees to make good choices. A January 2012 survey by the Society for Human Resource Management found that 52% of U.S. employers offer financial education to their employees.11 A study of financial education in the workplace conducted by economists at the Federal Reserve Bank of Kansas found strong evidence that such programs can improve personal financial outcomes and some evidence that such programs also provide benefits to the employer.12 Hopefully, there will be increases in the frequency and effectiveness of such workplace programs combined with better financial education in high schools and colleges. In the meantime, the low level of financial literacy among most employee groups, including those with advanced degrees, is a serious concern for a retirement system that relies heavily on DC retirement plans.
HR Implications Pension Plan Design
The goal of pension design is not to minimize risk or reduce costs. It is to design a cost-effective component of an overall compensation package that helps the firm attract, motivate, and retain the workforce it needs to successfully implement its business strategy. Doing this requires an understanding of the financial incentives created by different pension plans. Compared to DC plans, DB plans typically provide much stronger financial incentives for individuals to remain with their current employer. To see how these incentives are created, consider the example in Exhibit 11-11. Company A and Company B offer identical defined-benefit pension plans. In both cases individuals beginning at age 65 receive an annual pension benefit equal to their years of service times 2% times their final salary at that firm. If the pension plans are identical, why would an employee moving from Company A to Company B retire with less income? If the employee described in this example worked 40 years for Company A, her annual pension benefit starting at age 65 would be $96,021 (40 × 2% × $120,026). If she worked 20 years for Company A and then 20 years for Company B, her combined annual pension payment from the two firms would be $69,921. Her pension benefits would be $26,100 less per year for the rest of her life because of the midcareer job change. The detailed calculations are shown in Exhibit 11-11. Had the employee remained at Company A for her full career, her benefit would have been 80% of her salary at age 65. Changing jobs would mean that her combined retirement benefit would be 40% of her salary at age 65 at plus 40% of her salary at age 45. Because one-half of her benefit would be based on a lower salary, her retirement income would be substantially reduced.
Assumptions:
Company A and Company B have same defined-benefit formula:
Annual retirement benefit at age 65 = Years of service × 2% × Final salary
Employee begins career at age 25 at an annual salary of $25,000.
Employee will retire at age 65 and has a life expectancy of 85.
Salary increases at rate of 4% per year, so salary at age 45 is ($25,000 × 1.04^20) = $ 54,778 and salary at age 65 is ($25,000 × 1.04^40) = $120,026.
********************************************************
If employee works for 40 years at Company A, her retirement benefit will be (40 yrs × 2% × $120,026) which = $96,021.
If at age 45 employee moves from Company A to Company B, her benefit from A will be (20 yrs × 2% × $54,778), which = $21,911.
Her benefit from B will be (20 yrs × 2% × $120,026) which = $48,010.
Her combined benefit from A & B will be $69,921.
The penalty for changing jobs is $26,100 per year for 20 years!
Exhibit 11-11. DB pension plans discourage changing jobs.
DC plans such as 401(k)s are more portable and seldom penalize an employee for changing jobs. When firms shift from DB to DC plans, they often lose a powerful retention device. The pension savings that result from the shift to a DC plan may be offset, at least in part, by the cost of putting in place new programs to reduce employee turnover. This may, however, be a good opportunity to target the new retention incentives, for example, bonuses, promotions, or salary increases, for those employees who are most valuable to the firm. For retention, DB plans are blunt instruments creating incentives for both high performers and low performers to remain with their current employer.
DB Plans Encourage Retirement
For employees in their preretirement years, DB plans create incentives to stay put. However, after individuals reach retirement age, the situation reverses. DB plans are more likely than DC plans to encourage retirement. Consider again the employee described in Exhibit 11-11. If she worked an additional year beyond 65, the amount of her annual retirement benefit would increase to $102,358 (41 × 2% × $124,827). That’s an increase of $6,337 per year, and using an 8% discount, the present value of $6,337 for 19 years is $60,862. Remember, however, that she gave up $96,021 in retirement benefits by retiring 1 year later. Postponing her retirement would actually cost her money. Under most DB plans the present value of the retirement benefits received decreases with additional years of service beyond the plan’s normal retirement age. This creates a strong incentive for employees in DB plans to leave as soon as they reach this age. For individuals in DC plans, the situation is different. Delaying retirement increases their pension wealth by the amount of the additional contributions received and any increases in the market value of their DC plan assets. Unlike DB plan participants, they give up nothing by delaying the date on which they begin drawing retirement benefits. The funds they do not draw out at age 65 will still be in their account at age 66.
The Future?
It is likely that the shift from DB plans to DC plans will continue. However, for at least a decade or two, DB plans will remain a significant factor in the U.S. economy and a major issue for the CFOs and CHROs in many companies. The International Accounting Standards Board (IASB) has amended IAS 19 to eliminate many of the smoothing mechanisms in pension accounting. Beginning in 2013, non-U.S. companies that operate under the IASB guidelines will utilize the actual and not the expected earnings on pension assets to offset their annual pension expense. This may significantly increase the volatility of reported earnings of these companies. Given the ongoing attempts to achieve convergence between U.S. GAAP and International Financial Reporting Standards, many observers expect that FASB will also move in this direction.
A limited number of U.S. companies, for example, AT&T, Honeywell, and UPS, have already voluntarily changed their pension accounting procedures. These firms have not adopted a full mark-to-market approach, which would mean using actual rather than expected earnings to calculate annual pension expense. They have however given up some of the smoothing mechanisms available under ASC 715. Honeywell has, for example, adopted a modified mark-to-market approach under which it will still calculate annual pension using expected earnings, still maintain the nonrecognition corridor, and still defer losses inside the corridor. Honeywell will, however, in each year calculate the market value of its pension assets and then charge any losses outside of the corridor in the current year. Under current U.S. GAAP, the amount outside of the corridor can be amortized over a number of years. The maximum number of years is the average remaining service of active plan participants. Firms currently have the option to recognize gains and losses faster than required by ASC 715, and that is what Honeywell has decided to do. It’s not clear yet how many other firms will choose to make similar voluntary changes in their pension accounting. It is certainly possible that most will wait to see whether FASB shifts U.S. GAAP to something closer to IAS 19.
The provisions of ASC 17 are often described as designed to smooth pension expense. It would be more accurate to say they are designed to smooth the reported pension expense. As the accounting moves away from smoothing the reporting of pension expense, there will certainly be more pressure to smooth actual pension expense. Smoothing actual pension expenses will require adopting DB funding strategies such as the liability-driven approach previously described and replacing traditional DB plans with DC or hybrid plans. These changes will create challenges and opportunities for HR managers. HR managers will need to understand the financing of and financial incentives created by alternative retirement benefit plans to select those that cost-effectively contribute to a firm’s efforts to attract, motivate, and retain the talent it needs. Creative HR executives may propose plan features that would not have occurred to actuaries or pension plan managers. For example, J. Randall MacDonald, the senior vice-president for human resources at IBM, has speculated about melding retirement and health benefits into a performance-based 401(k) that rewards better performers with better benefits. He asks, “If everybody gets paid on performance, shouldn’t there be benefits based on performance? That’s what it means to be a performance-based culture.”13