
11
The New Maximum Permissible Exposure
A Biophysical Basis
Introduction
At the core of all laser-safety guidelines is the concept of maximum permissible exposure (MPE), defined as the level of laser radiation to which an unprotected person may be exposed without adverse biological changes in the eye or skin (ANSI, 2007; ICNIRP, 2000; IEC, 2007). Although the concept of MPE is quite simple, the reality is that it is multidimensional, dependent on the wavelength and duration of the exposure and modulated by the presence of repetitive pulses and diffusers or optics, which might increase the size of the beam at the target tissue. The guidelines include several pages of rules, tables, charts, conditionals, and caveats for the computation of the MPE for all reasonably foreseeable laser applications.
Implicit to the definition of the MPE is the assumption that one can know, with some degree of certainty, the threshold level of laser radiation that will cause just perceptible changes to the eye or skin, and further that one can know how the threshold level will vary with exposure parameters. That knowledge has been gained through experimental studies over the past 50 years. Research continues to modify our understanding of relevant dependencies, and as our understanding evolves, the rules evolve. It is anticipated that new guidelines will be published in 2013 by American National Standards Institute (ANSI), International Commission on Non-Ionizing Radiation Protection (ICNIRP), and International Electrotechnical Commission (IEC). The new guidelines will revise the rules for determining the effect of wavelength, exposure duration, retinal irradiance diameter, and repetitive pulses on the MPE. This chapter uses current when referring to the MPE or guidelines of the 2007 ANSI standard. It uses new when referring to the proposed 2013 revision.
This chapter introduces the reader to the bioeffects database and shows how these bioeffects data relate to the MPE. The retina of the eye is the most susceptible part of the body to laser-induced injury. The chapter is limited to the eye, with primary emphasis on the retinal hazard wavelength range.
Nature Of Bioeffects Data Relevant To The Hazard Of Laser Radiation
Researchers have developed a substantial body of data relevant to the threshold for laser-induced retinal injury through a process of introducing carefully controlled and measured doses of laser energy into the eye of an anesthetized animal and subsequently evaluating the exposed area for alteration resulting from the introduced energy. Most commonly, researchers place a number of exposures over a range of introduced energies, correlate the presence of a response to the introduced energy for each exposure, and compute the probability of producing the criterion response as a function of introduced energy using the statistical technique of probit analysis (Finney, 1971; Lund, 2006). The output of the probit analysis includes the ED50, that dose having a 50% probability of producing the criterion response. The ED50 is not a threshold; it may not be possible to determine a true threshold for these effects. The ED50 should, however, be related to the threshold in a manner that is persistent across exposure parameters and therefore serves as a fair and viable basis for the safety guidelines.
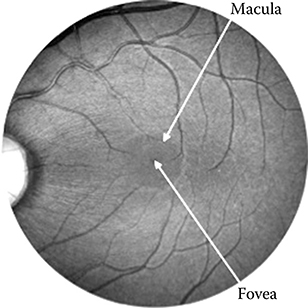
The ED50 for laser-induced retinal injury is dependent on a number of factors. Inherent to the laser are wavelength, pulse duration, and pulse repetition rate. The experimental configuration determines the retinal irradiance area and profile, the exposure duration, and the number of pulses. The investigator chooses the criterion for determination of retinal alteration. The visibility of laser-induced retinal alteration varies with the interval between exposure and observation. Early researchers used 5- to 15-minute observation times before standardizing on a 1-hour endpoint. More recently, investigators have augmented the 1-hour endpoint with a second observation at 24 hours after exposure. The later observation typically results in a lower value for the ED50. Early researchers used the rabbit as the animal model but soon adapted the rhesus monkey as a closer match to the human eye. Two distinct areas of the retina of the eye have been variously used for determination of the ED50 and these areas produce different results. Within the rhesus eye, the central area of the retina, the macula, is generally more sensitive to laser-induced alteration than the more peripheral extramacular retinal areas (Figure 11.1). The macula tends to be more heavily and uniformly pigmented, and the optics of the eye are better corrected for the macula than for the extramacular regions. As a result, the ED50 for macular exposures is generally lower and more reproducible than the ED50 for extramacular exposures. But the macula is small, and the amount of macular data that can be obtained from one expensive primate is limited: thus more data exist for extramacular exposures.
Figure 11.1
Rhesus monkey retinal photograph showing fovea, macula, and paramacula.
Pigmented tissue in vitro is also used, not to determine an ocular ED50, but as a vehicle to examine interaction mechanisms and to delineate the relative dependence of injury level on exposure parameters. Retinal explants, in which the preretinal ocular media of an excised eye is removed to allow direct exposure and examination of the retinal tissue, serve to compare the retinal response to the total eye response.
This chapter discusses the wavelength dependence of the ED50, the exposure duration dependence of the ED50, the effects of repetitively pulsed retinal exposures, and the dependence of the ED50 on the retinal irradiance diameter. The reader will realize that the parameter space so defined must encompass a very large number of distinct exposure configurations, each of which will result in a unique value for the ED50; further it is highly unlikely that all possible values of the ED50 will ever be experimentally determined. In fact, when the guidelines were first drafted in the late 1960s, experimentally determined values for the ED50 were scarce indeed. The solution to this problem was to view the eye as a physical system having defined and measured optical, mechanical, and thermal properties.
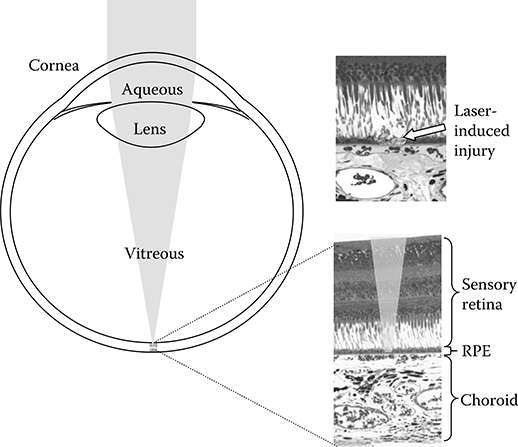
The function of the eye optics is to image the external world onto the retinal photoreceptors at the focal plane at the back of the eye. Geometric optics then dictate that a collimated laser beam, incident at the cornea, will be focused onto a very small area at the retina: the diameter of that area is limited by the quality of the eye optics and the state of accommodation at the time of the exposure. Immediately posterior to the photoreceptors, and still at the focus of the eye optics, lays the retinal pigment epithelium (RPE), a monolayer of cells containing melanin granules. Melanin is a very strong absorber of optical radiation to the extent that most of the radiation incident on the retina is absorbed in a 5-μm layer of melanin granules. Thus, the collimated laser beam incident at the cornea is concentrated onto a strongly absorbing layer at the retina and injury at that layer results from very small levels of energy incident at the cornea (Figure 11.2).
Figure 11.2
An incident laser beam is concentrated by the optics of the eye onto the retina. Light is incident from the top and passes through the cornea, aqueous, lens, vitreous, and sensory retina before impinging on the retinal pigment epithelium (RPE) and the choroid. The RPE, a monolayer of cells containing strongly absorbing melanin granules, is the primary locus of laser-induced retinal damage.
Histology shows that threshold laser-induced thermal retinal damage is localized to the RPE. From this observation, one can proceed in two directions. Assume that, for a given exposure duration, retinal injury occurs when the energy absorbed in the RPE reaches some threshold level that is independent of the wavelength of the absorbed energy. The wavelength dependence of the required energy incident at the cornea to produce that level of absorbed energy in the RPE can be estimated based on the spectral transmission and absorption of ocular tissues. Or assume that for a given wavelength, the absorbed energy required to produce retinal injury varies with the exposure duration in a manner that is consistent with the rate of energy deposition, the thermal conductivity in the retinal tissue, and the rate of thermal denaturation of retinal proteins. Then, for exposure durations longer than a few microseconds the level of absorbed energy required to produce retinal injury can be estimated by use of thermal models of laser/ tissue interaction. For exposures shorter than a few microseconds, thermal conductivity is too slow to impact the thermal outcome of energy deposition and the absorbed energy required to produce injury is relatively independent of the exposure duration.
Considerations of eye properties were essential to the first iterations of the guidelines and continue to be essential to a system of checks and balances to insure the continued validity of the guidelines. Data have now accumulated, and the interaction models have become quite sophisticated. Still, data must be questioned if they cannot be explained by interaction models, and models must be questioned if they are not consistent with the data.
Wavelength Dependence: CA, CC, and CB
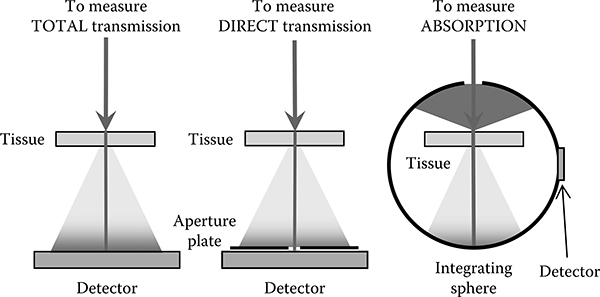
An incident laser beam is attenuated by the preretinal ocular media, the cornea, the aqueous, the lens, and the vitreous, before it reaches the retina (Figure 11.2). It is not easy to measure the transmission of these media in the intact, living eye: access to the retinal plane to position a source or detector requires surgical intervention (Dillon et al., 2000). An alternative has been to deconstruct the excised eye, measure the transmission of each of the component parts separately, and compute the transmission of the whole as the product of the transmissions of the parts. The tissue is necessarily dead with attendant changes in transmission and scatter of the transmitted light. Scattered light becomes important for the determination of retinal irradiance in that it removes light from the focused beam, thus reducing the retinal irradiance. The primary source of scatter is the cornea, and scatter in the cornea is sensitive to the integrity of its structure. Typically, the transmission of the tissue is measured in a spectrophotometer configured to collect all the transmitted radiation, and thus the measured quantity is the total transmission through the tissue (Figure 11.3). Transmission of the eye based on these measurements will overstate the irradiance at the retina. It is more relevant to measure the direct transmission of the ocular tissues by collecting only that portion that is not scattered outside the focal area after traversing the tissue. The direct and total transmission of the rhesus eye and the human eye are tabulated in the report CIE 203-2012 (Commission Internationale de l’Éclairage [CIE], 2012). The rhesus eye transmission data from that report are shown in Figure 11.4a and are used in this analysis. The choice of rhesus monkey is deliberate as most laser-induced retinal damage thresholds have been determined in that species and the intent is to compare a theoretical action spectrum to the data.
Figure 11.3
Configurations to measure TOTAL transmission, DIRECT transmission, and ABSORPTION of tissue.
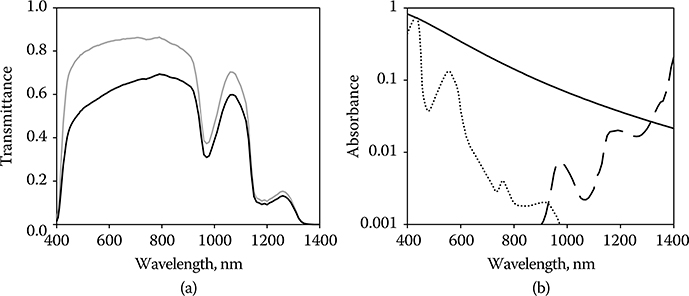
Energy reaching the retina is absorbed in the retina and choroid, where the absorbing tissue of interest is the RPE. Accurate measurement of the percentage of light absorbed in the RPE requires that the RPE be isolated from the other retinal tissues and that all nonabsorbed incident light, including scattered light and transmitted light, be collected and measured. Based on careful measurements of the transmission of the isolated RPE by Gabel et al. (1976, 1978) and supported by other determinations of melanin absorption (Wolbarsht et al., 1981), the RPE absorption is reasonably approximated by the function
Figure 11.4
(a) Tλ, Total transmittance (gray line) and direct transmittance (black line) of the preretinal ocular media of the rhesus eye. (b) Aλ, Absorption of light in the retina of the rhesus eye. Absorbers are retinal pigment epithelium (solid line), blood in the retinal capillaries (dotted line), and water in the sensory retina (dashed line).
|
where αλ = α0 (λ0/λ)3.5
The absorption length, s, is 5 μm. A fit to the RPE absorption data is obtained when α0 is set to 4100 cm−1 at the wavelength λ0 of 380 nm.
Blood is found in the capillaries of the retinal circulatory system resident in the sensory retina. Light must traverse layers of 5-μm-diameter capillaries before reaching the RPE (Lund et al., 2001). The absorption of incident radiation in 5 μm of blood approaches that in the RPE for the wavelength range approximately 440 nm. At wavelengths longer than 1300 nm, light absorption by water in the sensory retina becomes significant (Figure 11.4b).
The energy absorbed by the RPE, Qrλ, is
|
where Qpλ is the energy at the cornea within the area of the pupil, Tλ the transmission of the preretinal ocular media at wavelength λ, and Aλ the absorption of the retina at wavelength λ.
Aλ = Aλ (RPE) + Aλ (H2O)
Tbλ is the transmission of blood assuming a 5-μm absorption path.
Rearranging,
|
or
|
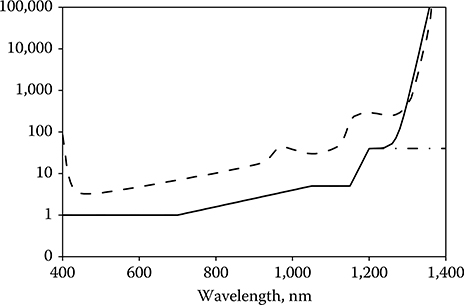
Equation 11.4 is an expression for the relative retinal hazard as a function of wavelength of collimated laser energy incident at the cornea. Compare this function to the wavelength dependence of the retinal MPE, which is governed by the value CA from 400 to 1150 nm and by the value CA × CC from 1150 to 1400 nm (ANSI, 2007). It can be seen that the wavelength dependence of the MPE fairly represents the wavelength dependence of the expected hazard over much of the retinal hazard region (Figure 11.5). The value of CC in the current standards results in an MPE that is up to three orders less than the measured ED50 for wavelengths between 1150 and 1400 nm. Zuclich et al. (2007) proposed a revision of CC to bring the MPE more in line with the wavelength dependence of Equation 11.4 and that of the ED50. The proposed revision has been adapted in altered form in the new guidelines. The old and new values of CA × CC are shown in Figure 11.5.
Figure 11.5
The wavelength dependence of the relative energy incident at the cornea required to deliver equal absorbed energy in the RPE, Qpλ/Qrλ = 1/(Tλ Aλ)(dashed line) compared to the wavelength dependence of the maximum permissible exposure as determined by CA and the current value of CACC (dot–dash line) and the new value of CACC (solid line).
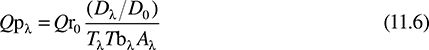
Does Equation 11.3 fairly represent the wavelength dependence of the experimentally determined values for the ED50? Well, it almost does, but not quite. If the eye were a perfect optical system, then the retinal area over which the incident energy was distributed would always be the same, and Equation 11.3 would be sufficient. But, the eye is not a perfect optical system, and aberrations strongly affect the distribution of energy on the retina. Among those aberrations is chromatic aberration. The index of refraction of ocular optics varies with wavelength, and not all wavelengths are in simultaneous focus on the retina. If the eye is in focus for yellow light, then blue light comes to a focus in front of the retina and red light comes to a focus behind the retina. As a result, given a collimated laser beam incident at the cornea, the irradiated area at the RPE will be larger for blue light and for red light than for yellow light. In effect, the diameter of the irradiated area at the RPE varies with the wavelength of the incident light (Figure 11.6). As shown in section Spot-Size Dependence, the threshold for laser-induced retinal damage becomes larger as the irradiated area of the retina becomes larger. Qrλ should therefore be expressed by the function
|

where Qr0 is the required energy for a minimum retinal irradiance diameter D0, and Dλ the chromatic aberration-induced diameter at wavelength λ.
From Equations 11.3 and 11.5,
|
or setting the constant k= Qr0/D0
|

Figure 11.6
Dλ − Chromatic aberration-induced variation of laser beam diameter at the retinal pigment epithelium (RPE) of the rhesus eye based on geometrical optics in a simplified eye with the assumption that the index of refraction of ocular tissue varied as the dispersion of water.
The value of X, which determines the variation of ED50 with the retinal irradiance diameter, varies from a value of 2 for exposures of nanoseconds to micro seconds to a value of 1 for 0.25-second duration and longer exposures (Lund, Schulmeister et al., 2005; Lund et al., 2008) (see section Spot-Size Dependence). Other factors affect the value of D0. Although the optical quality of the eye will allow the incident laser radiation to be focused to a diameter at the RPE as small as 5–7 μm under optimum conditions, recent research suggests that the threshold for retinal injury does not decrease for image diameters less than 70–90 μm (Lund et al., 2007; see section Spot-Size Dependence).
Figure 11.7 shows a representative exposure system used to measure laser-induced retinal damage thresholds. The laser beam passes through a shutter, which determines the exposure duration. A beam splitter deflects a constant proportion of the pulse energy into a reference detector while the remainder of the energy passes through attenuators and onto a mirror, which directs the laser beam into the eye to be exposed. The mirror can be moved to permit observation and accurately repositioned for exposure. A fundus camera permits observation of the retina and selection of sites for exposure. The fundus camera, mirror, and laser beam are aligned so that the laser energy reflected by the mirror passes through the center of the ocular pupil and strikes the retina at the site corresponding to the crosshairs of the fundus camera viewing optics. Typically, 30 exposures spanning a range of doses are placed in an array in the retina. The exposure sites are examined after exposure and the presence or absence of visible alteration is noted for each site. A number of metrics have been used to determine the presence of alteration. The more sensitive metrics such as measures of visual function and microscopic evaluation of excised tissue are resource intensive and are sparingly used to place a lower bound on the range of introduced energy capable of producing retinal change. The primary metric continues to be the presence of a minimum visible lesion (MVL) detected via ophthalmic examination subsequent to exposure. The response at each site is correlated to the dose at that site, and probit analysis of the dose–response data in four to six eyes yields the ED50.
Figure 11.7
A typical experimental configuration to irradiate the retina of the eye to a collimated laser beam with carefully controlled and measured dosimetry.

Generally, the laser is collimated to produce a beam having a beam divergence of less than 1 mrad. The beam diameter at the cornea is limited to 3–4 mm to ensure that the entire beam passes through the ocular pupil and impinges the retina. The dose is of necessity measured external to the eye, and the ED50 is most commonly expressed as total intraocular energy (TIE), defined as that energy incident at the cornea within the projected area of the ocular pupil. The MPE is provided by the laser-safety guidelines in units of corneal radiant exposure (J/cm2) averaged over a 7-mm aperture (ANSI, 2007; ICNIRP, 2000; IEC, 2007). When the MPE (J/cm2) is multiplied by the area of a 7-mm pupil (0.385 cm2), the TIE (J) introduced into the eye for an exposure at the MPE is obtained.
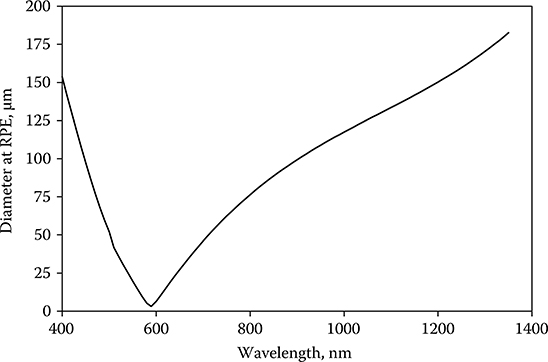
Tunable lasers have facilitated the experimental study of the wavelength dependence of the ED50 for retinal damage. A tunable TI:Saph laser and several fixed-wavelength lasers yielded ED50 values for continuous wave (CW) (0.1-second) exposures from 440 to 1320 nm (Lund et al., 1999, 2008; Vincelette et al., 2009). An optical parametric oscillator, capable of providing useful pulse energy throughout a tuning range from 400 to 1200 nm, made it possible to determine the wavelength dependence of retinal damage for Q-switched pulses throughout the visible and near-infrared (NIR) spectrum (Lund et al., 2001, 2003). ED50 data resulting from dose–response experiments with these lasers are shown in Figure 11.8. A Qpλ curve (Equation 11.7) was fitted to the data for each exposure duration by choosing the value of k to match the data at a single wavelength (830 nm) and choosing the value of X appropriate for the exposure duration. The value of D0 was set to 70 μm in accordance with the available spot-size data. Although not perfect, the match of the data to the theoretical curve is quite good.
Figure 11.8
Wavelength dependence of the ED50 for 3.5-nanosecond-duration exposures (diamonds) and for 0.1-second-duration exposures (circles). Qpλ as defined by Equation 11.7 has been fit to the data. The new maximum permissible exposure for each exposure duration is shown.
Over a broad range of exposure conditions, the experimentally determined ED50 for laser-induced retinal damage can be fitted to curves based on Equation 11.7. The data shown in Figure 11.9 include exposure durations from 3.5 nanoseconds to 1000 seconds, wavelengths from 410 to 1320 nm, and retinal irradiance diameters from the minimum the eye will produce to 350 μm (Lund, Edsall et al., 2005). In each case the value of k was chosen to fit the data at 830 nm. The data resulted from a number of experimental studies (Connolly et al., 1975; Ham et al., 1979, 1976; Lund and Beatrice, 1989; Lund et al., 1998, 2006; Onda and Kameda, 1979a, 1979b; Vincelette et al., 2009; Zuclich et al., 1979).
Figure 11.9
The wavelength dependence of the ED50 for laser-induced retinal alteration for a range of exposure durations with Qpλ as defined by Equation 11.7 matched to each data set. t is the exposure duration and D is the diameter of the irradiated retinal area. Filled triangle: t = 1000 seconds, D = 350 μm; filled square: t = 100 seconds, D = 350 μm; filled diamond: t = 16 seconds, D = 350 μm; filled circle: t = 1 second, D = 350 μm; open diamonds: t = 0.25 second, D = 140 μm; open triangles: t = 0.1 second, D = 30 μm; open circles: t = 0.04 second, D = 30 μm; open squares: t = 600 microseconds, D = 30 μm; cross: t = 3.5 nanoseconds, D = 30 μm.

When the wavelength is shorter than 550 nm and the exposure is longer than 10 seconds, laser irradiation can produce photochemical injury to the retina at doses significantly lower than those required to produce thermal injury (Ham et al., 1979, 1982; Lund et al., 2006). It would be convenient if a wavelength could be identified as the transition point between the range wherein photochemical injury dominates and the range wherein thermal injury dominates. Instead, the guidelines require that both the photochemical MPE and the thermal MPE be determined and the lower MPE be used as the exposure limit. Figure 11.10a shows the wavelength dependence of the laser-induced retinal ED50 for 1-, 16-, 100-, and 1000-second exposure duration. The data are presented as retinal radiant exposure HR (J/cm2). The thresholds for all exposure durations converge onto a common line at the short wavelength end. This line is the threshold of the retina as a function of wavelength for laser-induced photochemical injury and forms the basis for CB, the blue-light correction factor (Figure 11.10b).
Figure 11.10
(a) The wavelength dependence of laser-induced photochemical injury thresholds. (Short dash line, t = 1000 seconds; long dash line, t = 100 seconds; dash–dot line, t = 16 seconds; dash–dot–dot line, t = 1 second.) (b) The photochemical retinal injury threshold as a function of laser wavelength (solid line), based on the data of panel a. This curve forms the basis for CB (dashed line).
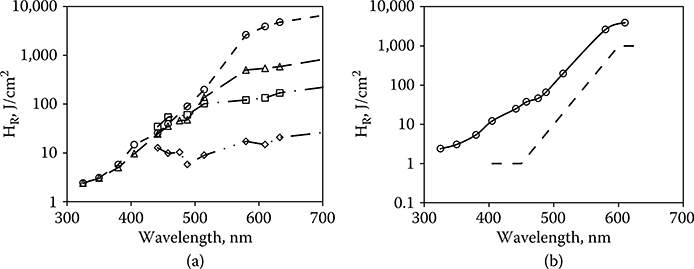
Figure 11.11
(a) The threshold for thermal retinal injury (Equation 11.7) compared to the photochemical injury threshold (solid line). The retinal spot size is 325 μm. (Short dash line, t = 1000 seconds; long dash line, t = 100 seconds; dash–dot line, t = 16 seconds; dash–dot–dot line, t = 1 second.) The wavelength at which photochemical injury becomes dominate varies with the exposure duration. (b) The threshold for thermal retinal injury (Equation 11.7) compared to the photochemical injury threshold (solid line). The Exposure duration is 16 seconds (dash line, D = 50 μm; dash–dot line, D = 187 μm; dash–dot–dot line, D = 325 μm; dot line, D = 1700 μm). The wavelength at which photochemical injury becomes dominate varies with the retinal spot size.
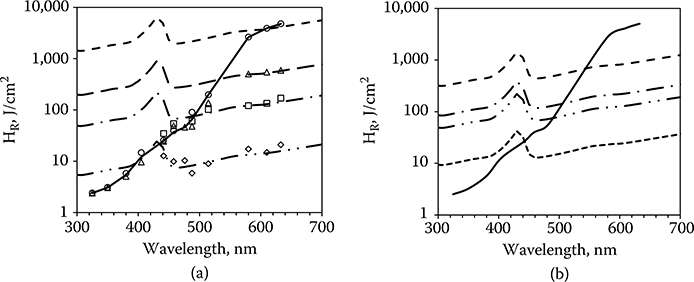
Figure 11.11a superimposes the wavelength dependence of laser-induced thermal retinal injury, converted to HR and matched to the data for the 1-, 16-, 100-, and 1000-second exposures. In the wavelength range of 400–600 nm both thermal retinal and photochemical retinal injuries are possible. The MPE will be determined by which of these injury thresholds are reached at the lower dose. To the left of the photochemical threshold line the photochemical threshold will be reached first. To the right of that line the thermal threshold will be reached first.
The photochemical threshold occurs at a specific dose (retinal radiant exposure), which varies only with wavelength. As is clear in Figure 11.11a, the time taken to deliver that dose has no effect on the required total dose; the thresholds for each of the exposure durations converge onto the same photochemical threshold curve. The thermal retinal injury threshold does depend on the delivery time, varying as t0.75.
The effect of this is shown in Figure 11.11a wherein the shorter the exposure duration, the shorter the wavelength at which the photochemical threshold will determine the MPE. At sufficiently short exposures, the thermal threshold will determine the MPE across the entire spectrum.
Nor does the photochemical threshold, expressed as retinal radiant exposure, depend on the diameter of the irradiated area. The thermal threshold does depend on the retinal spot size. For exposure duration longer than 0.25 second, the thermal threshold (HR) varies as 1/D. The smaller the spot size, the higher the threshold. The curves of Figure 11.11a are determined for a retinal irradiance diameter of 327 mm (1/e). Figure 11.11b shows the effect of varying the spot size while keeping the exposure duration constant. The photochemical threshold will determine the MPE at a longer wavelength when the spot size is small (50 μm) as compared to the case when the spot size is larger.
These data are accounted for in the safety guidelines through the dual limits for wavelengths shorter than 600 nm (ANSI, 2007; ICNIRP, 2000; IEC, 2007).
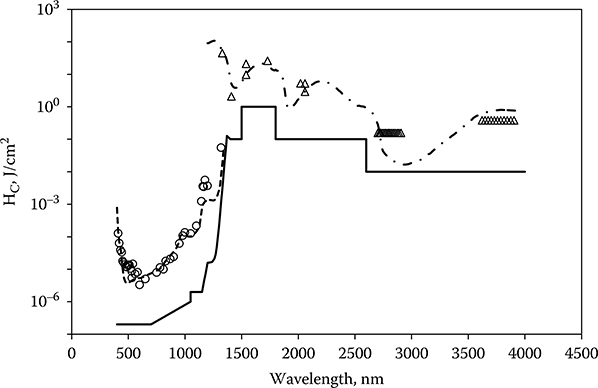
The ability to produce retinal lesions has been restricted to the wavelength range wherein the preretinal ocular transmission is equal to or greater than 1%. Lesions have been produced in normal rhesus monkey eyes at 325 and 1330 nm (Zuclich and Connolly, 1976; Zuclich et al., 2007), near the short-wavelength and long-wavelength limits for retinal damage. Increasing the corneal dose to compensate for the preretinal loss does not extend the retinal damage range. Apparently, alteration to the pre-retinal tissue limits the energy transmitted to the retina. The eye is nonetheless still vulnerable to injury from laser radiation at wavelengths longer than 1400 nm. The injury site is shifted to the cornea and lens, and the doses required to produce injury are higher because the incident radiation is no longer concentrated on the absorbing tissue by the optics of the eye. Although the database for laser-induced corneal injury is sparse compared to the data available for retinal thresholds, enough data are available to match to a curve based on the absorption of corneal tissue (Zuclich et al., 2007). The cornea thresholds can be fit to a curve proportional to the depth at which 95% of the incident laser radiation is absorbed in the corneal tissue (Lund et al., 1981). A continuation of injury level is seen through the transition from retinal injury to corneal injury at 1400 nm with a range at which both retinal and corneal injury are possible. Figure 11.12 compares the MPE to the data for nanosecond-duration exposures from 400 to 4000 nm. The wavelength dependence of the IR MPE is approximated to the corneal 95% absorption curve through a series of step functions (ANSI, 2007; ICNIRP, 2000; IEC, 2007).
Figure 11.12
ED50 for laser-induced ocular injury after exposure to nanosecond-duration laser irradiation. The thresholds are presented as corneal radiant exposure. When the injury site is the retina, the incident energy is averaged over a 7-mm-diameter area at the cornea. At 1319 nm both cornea and retina can be injured, but the threshold for retinal injury is lower. The injury site is the retina for wavelengths shorter than 1300 nm and the cornea for wavelengths longer than 1400 nm. Qpλ as defined by Equation 11.7 is fit to the retinal thresholds. A curve that is proportional to the depth in the eye at which 95% of the incident energy has been absorbed is fit to the corneal thresholds (scale not shown). The new maximum permissible exposure for nanosecond-duration exposures is included.
Exposure Duration (Time) Dependence
Data relating the dependence of the ED50 to the exposure duration came earlier and are more abundant than those relating the ED50 to wavelength. Almost since laser emission was first achieved, investigators have had access to pulsed and CW laser systems enabling controlled exposure at durations ranging from a few nanoseconds to thousands of seconds; broad wavelength tunability came much later. The wavelength dependence data tend to be variable: laser quality, dosimetry, and detection of effect are not the same in all laboratories and all have improved with time. Data relevant to the ED50 for exposure duration shorter than 1 nanosecond are more recent (Cain et al., 1995, 1996, 1999, 2005; Roach et al., 1999).
Laser energy absorbed in retinal tissue heats that tissue. At the same time, thermal conductivity acts to limit the temperature rise in the heated tissue. As with any physical system, the time–temperature history of the tissue is described by the thermal diffusion equation. Solutions pertaining to ocular injury with all the attendant assumptions are well documented and will not be duplicated here (Takata et al., 1974; Thompson et al., 1996).
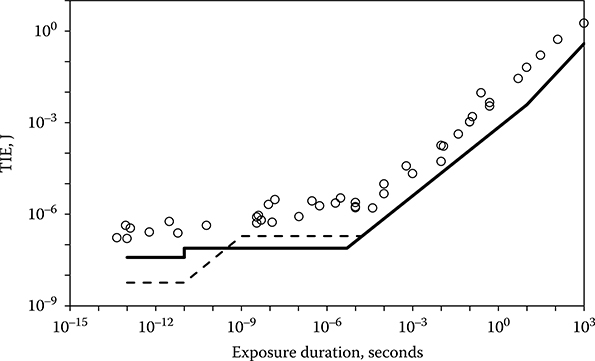
Consider exposures longer than a few microseconds. Under the influence of constant incident power P, tissue will quickly reach an equilibrium temperature T, and the value of T will be proportional to that of P. If injury could be associated simply with a given temperature T1, then the dose P1 required to cause injury would have a constant value independent of exposure duration. The threshold dose expressed as energy (Q = P1 × t) would vary as t1.0, where t is the exposure duration. However, tissue injury results from heat-related denaturation of proteins and depends on both the temperature of the tissue and the time for which that temperature is maintained. A higher temperature will produce injury in a shorter time, whereas a lower temperature must be maintained for a longer period to produce injury. This relationship tends to increase the power at ED50 for shorter exposures compared to the power required for longer exposures. As a result, the time relationship predicted by the thermal models closely approximates the dependence shown by the bioeffects data. The values in energy of the ED50 for visible laser exposure increase proportional to t0.75 for exposure durations longer than about 10 microseconds (Figure 11.13).
Figure 11.13
The time dependence of the ED50 for visible laser-induced retinal damage for macular exposures in rhesus monkey. The current maximum permissible exposures (MPEs) (dashed line) and the new MPEs (solid lines) for visible-wavelength laser ocular exposure are included.
For sufficiently short exposures, the energy is deposited in times shorter than the time required to conduct heat out of the exposed area. The temperature of the tissue will then be proportional to the incident energy independent of the duration of the exposure. This condition is referred to as thermal confinement. For exposures shorter than a few microseconds, the temperature required for protein denaturation will exceed the temperature required to produce a phase change of the liquid surrounding the melanin pigment granules, and other damage mechanisms come into play at lower temperatures than required for protein denaturation. In the late 1990s, researchers reported the induction of cell death by microcavitation (bubbles) around melanin granules superheated by incident laser irradiation (Brinkman et al., 2000; Kelly, 1997; Kelly and Lin, 1997; Lin et al., 1999; Roegener and Lin, 2000; Roider et al., 1998). The data relating cell death to microcavitation were derived from laser irradiation of retinal explants or pigmented cells in culture. Microcavitation was detected optically or acoustically and cell death was determined by fluorescent assay. Cell death almost always followed the induction of a microcavitation bubble in the cell; the cell membrane is damaged by the pressure wave propagating out from the microcavitation bubble. Gerstman et al. (1996) showed theoretically that bubble formation occurred at lower incident irradiance than required for thermal denaturation for pulses of duration between 1 nanosecond and 1 microsecond. Schüle et al. (2005) experimentally distinguished between thermally induced damage and microcavitation-induced cell death. They decreased the pulse duration from 3 milliseconds and showed that for pulse durations of less than 50 microseconds the damage mechanism at threshold level changes from a thermal one to one based on the formation of micro cavitation around the melanosomes in the RPE. Lee et al. (2007) looked more closely at the range from 1 microsecond to 40 microseconds and found a transition at about 10 microseconds. Figure 11.14 includes in vitro threshold values from several studies. Each data point in Figure 11.14 represents a threshold for cell death. The open symbols show where either microcavitation was not detected or no measure of microcavitation was attempted. The solid symbols show where micro-cavitation was detected. For exposures longer than about 10 microseconds, cell death occurs at a lower irradiance than required for microcavitation and thus is considered to result from thermal denaturation. For exposures shorter than 10 microseconds, cell death correlates to microcavitation.
Figure 11.14
The ED50 for thermally induced damage (open diamonds) and the threshold for microcavitation-induced cell death (solid diamonds) as a function of the exposure duration. Data are obtained for in vitro (cell culture or retinal pigment epithelium explant) exposures. The solid line is the predicted cell damage threshold based in thermal models.

Below about 1 nanosecond, the trend of the in vivo ED50 is to be increasingly lower than the prediction of constant energy. This trend is explained in part by stress confinement, which results in a shock wave rather than the pressure wave of longer exposures. The greater pressure gradient across the shock wave has a greater potential for cell membrane damage. Ultrashort pulses in the femtosecond duration range produce nonlinear effects that affect the propagation of the laser energy through the transparent preretinal tissue and introduce other interaction mechanisms including plasma formation at the retina (Cain et al., 1996, 2005; Rockwell et al., 2010). That retinal damage is less dependent on melanin granule absorption for the very short exposures is evidenced by the observation that the ratio between the NIR ED50 and the visible ED50 is less for the shortest exposures.
As more laser-induced retinal injury threshold data have been collected for exposure durations from 1 to 100 nanoseconds, it has become apparent that the current MPE in that range does not afford an adequate safety factor; the safety factor ranges from 2.5 to 4, too low given the uncertainties associated with the ED50 for point source, nanosecond-duration pulsed exposures (Cain et al., 1995; Lund et al., 2008, 2011; Zuclich et al., 2008). The new data reflect macular thresholds with a 24-hour MVL endpoint and represent the lowest values for experimentally determined ED50. Advances in experimental techniques and dosimetry contributed to the reduction over earlier values of the ED50. It was apparent that the MPE should be adjusted downward to protect against the new thresholds. Both the current and the new MPE are shown in Figure 11.12. The new MPE for nanosecond-duration pulses has been decreased by a factor of 2.5 to provide an adequate safety margin while the new subnanosecond MPE has been increased to more closely reflect the data.
Repetitive Pulses: Cp
Current laser-safety guidelines have adopted an n−1/4 relationship for the determination of the MPE for exposure to repetitive pulsed lasers. The exposure for any single pulse in a pulse train shall not exceed the single-pulse MPE multiplied by a multiple-pulse correction factor Cp = n-1/4, where n is the number of pulses. The n−1/4 relation-ship, first articulated by Stuck et al. (1978), was not rigorously derived from first principles but is an empirical fit to a body of data. The rule has the advantage that it does not depend on the pulse repetition frequency or the interpulse spacing and is therefore applicable to trains of irregularly or randomly spaced pulses. Commonly this relationship is expressed as
MPE (RP) = MPE (SP) n-1/4
where MPE(RP) is the maximum permissible exposure for the repetitive pulse train expressed as energy per pulse and MPE(SP) the maximum permissible exposure for a single pulse from the same laser.
Figure 11.15 shows a collection of laser-induced retinal injury threshold data for repetitive-pulse ocular exposures. These ED50 data support the idea that the ED50, expressed as energy per pulse, is well represented by a derating factor that varies as the inverse fourth power of the number of pulses in the exposure. On the average
ED50 (RP) = ED50 (SP)n-1/4
This result is relatively independent of the wavelength, pulse duration, or pulse repetition frequency of the laser. Models based on a thermal damage mechanism cannot readily explain this result. Additivity of effect requires that each pulse somehow sensitize the exposed retina such that it becomes more susceptible to damage with each cumulative pulse. The fact that the n−1/4 dependence is independent of the interpulse spacing essentially rules out the possibility that the mechanism for sensitivity increase is thermal memory. Other sensitizing mechanisms have been elusive.
Figure 11.15
Collected laser-induced retinal ED50(RP) data for repetitive-pulse ocular exposures. The ED50(RP) expressed as energy/pulse is plotted as a function of n. The solid line has a slope n−1/4.

Menendez et al. (1993) proposed a probability summation model for predicting the threshold for a train of pulses based on the probit statistics for a single pulse. The probability summation model requires that the effect of each pulse in the pulse train be a separate event independent of and unaffected by the effects of other pulses in the train. Until recently, this has been problematic because laser-induced retinal injury was viewed as a thermal effect, and each pulse in the train contributes to the end temperature of target tissue. However, the introduction of microcavitation as a mechanism for cell death opened new possibilities. Lin et al. (1999) noted that “as the laser fluence was increased, more and more cells underwent cavitation,” indicating that the threshold for cavitation had a statistical distribution. Roegener et al. (2004) exposed RPE cells in vitro to repetitive-pulse trains and observed that “an important finding of this study is that a single cavitation event during a long train of pulses is sufficient to kill the cell.” Thus, it would appear that when the mechanism for induction of cell death is bubble formation, the condition of pulse independence is met, and the probability summation model might be appropriate.
Lund (2007) and Lund and Sliney (2013) showed that the probability summation model can lead to an alternate form for the repetitive-pulse correction factor, Cp = n−1/β. The probit program used to analyze the dose–response data yields not only the ED50 but also other parameters of the fit including the slope (SL) of the probability curve (Δprobability/Δdose) at the ED50. The slope is often viewed as a measure of how good the data are: a higher (good) SL indicates a rapid transition from no damage to damage as the dose increases and thus a well-defined ED50; a small value of SL indicates a slow transition over a broader range of doses, thus a more poorly defined ED50. The value of β is related to the experimental values of the slope (SL) of the probit curve fit to the dose–response data as β = SL − 1. The distribution of values of SL for in vivo dose–response experiments is centered at approximately 5; therefore, the value of β = 4 (Cp = n−1/4) used in the safety guidelines is the most probable value of a distribution of values of β based on the collection of bioeffects data.
Figure 11.16
The multiple pulse reduction factor (ED50[nth pulse]/ED50[single pulse]). Dashed line, approximate solution with β = 4. Solid line, exact solution with SL = β + 1 = 5.

The idea that the ED50(RP) should decrease simply as n−1/β is disconcerting in that it leads to very low values of the ED50(RP) for large numbers of pulses. The solution to the probability summation model leading to n−1/β was an approximate solution. Lund et al. (2009) derived exact solutions for the probability summation model, which showed that the ED50(RP) would tend to asymptote to a constant value for large n. The two solutions are compared in Figure 11.16 for β = 4. These considerations lead to a reanalysis of the data included in Figure 11.15. The data of Figure 11.15 include redundancies (i.e., two or more curves based on the same set of exposures but with different endpoints). It includes data sets that have an average power greater than the CW limit. It includes data sets that contain the ED50 for only one value of n in addition to the single-pulse ED50. It includes data that have been determined to be experimentally unsound. Figure 11.17a shows the data that remain when all the superfluous of erroneous data are removed. Also absent in Figure 11.17a are data from a study by Ham et al. (1988). These data will be discussed later in this section. The bulk of the data remaining in Figure 11.17a support the notion that the ED50(RP) does not fall off forever as n−1/β but tends to asymptote to a constant value as suggested by the exact solution to the probability summation model. This finding is supported by the data of Figure 11.17b, which shows the dependence of ED50 on n for large spot size in vivo exposures and for ex vivo exposure of retinal explants. A common characteristic of these two designs is that they eliminate most of the experimental uncertainties associated with the determination of small spot in vivo ED50, and therefore, the slope of the probit curve is very large. Because of the high value of β, the ED50(RP) falls off very slowly from the single-pulse case. Consideration of Figure 11.17a and b led to the conclusion that the repetitive-pulse derating factor (Cp = n−1/4) of the current guidelines imposes an unnecessarily low MPE(RP) for repetitive-pulse exposures. The new guidelines will lower the MPE for single-pulse nanosecond-duration exposures, resulting in an even lower repetitive-pulse MPE(RP). Given these facts, the new guidelines set CP = 1 for most relevant exposure conditions. For some exposure conditions, the value of CP is reduced, but never lower than the value CP = 0.2. The prospect of very low values of the MPE(RP) for large numbers of exposures has been eliminated without compromising safety.
Figure 11.17
(a) A reduced set of laser-induced retinal ED50(RP) data for repetitive-pulse ocular exposures. The ED50(RP) expressed as energy/pulse is plotted as a function of n. A line having slope n−1/4 is included. (b) Laser-induced retinal ED50(RP) data for repetitive-pulse ocular exposure of large retinal irradiance diameters in vivo (solid lines) and for repetitive-pulse ocular exposures of explant retinal tissue ex vivo (dotted lines). The ED50(RP), expressed as energy/pulse (solid lines) or retinal radiant exposure/pulse (dotted lines is plotted as a function of n.
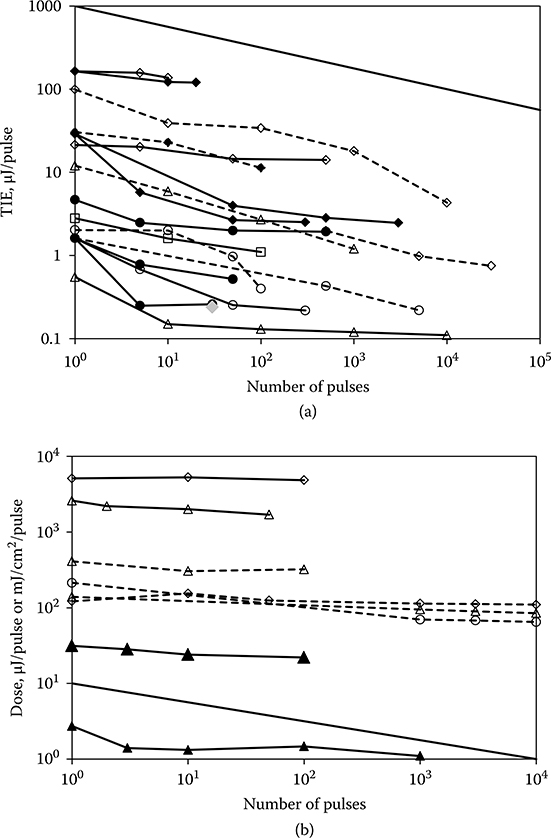
Figure 11.18
(a) ED50(RP) data for repetitive-pulse retinal exposure (40-microsecond pulses) to 488 nm (solid lines) and 647 nm (dotted lines) laser radiation (Ham et al., 1988). The horizontal line is the new MPE(RP) with CP = 1. The 488-nm thresholds fall below the MPE. Those ED50(RP)s below the new MPE(RP) are photochemical in nature. The 647-nm ED50(RP)s fall below the MPE(RP) only for exposures of 1000-second duration. (b) The ED50(RP) data for repetitive-pulse retinal exposure (40-microsecond pulses) to 488 and 647 nm laser radiation (Ham et al., 1988) are converted to units of total retinal radiant exposure for the pulse train and compared to the photochemical injury threshold of Figure 11.10. For large n, the 488-nm retinal radiant exposure exceeds the photochemical threshold.
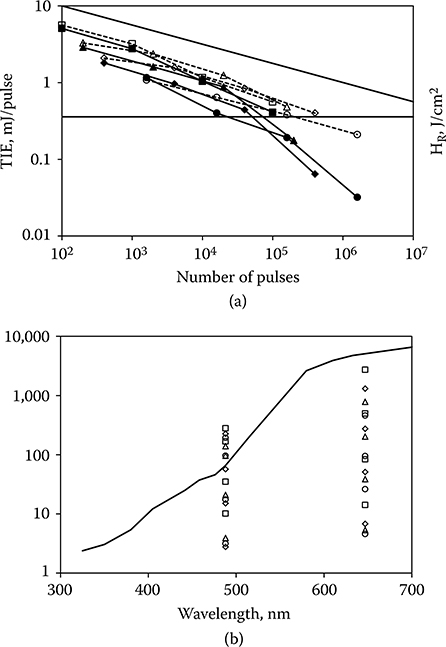
Data of Ham et al. (1988) are shown in Figure 11.18a. The MPE(RP) in accordance with the new guidelines is a constant value across all values of n. It is evident that the ED50(RP) for these data will fall below the MPE(RP) for large n. Four of the data sets were obtained at a wavelength of 488 nm and, as the authors noted, the thresholds reflect photochemical injury rather than thermal. The average power does not exceed the photochemical MPE for the duration of the exposures, yet the total retinal radiant exposure exceeds the photochemical threshold for large n (Figure 11.18b). The guidelines do not adequately provide for the possibility that the cumulative effect of many short pulses, none of which approach the photochemical limit, might lead to photochemical injury. The other four data sets of Figure 11.18a were obtained at a wavelength of 647 nm where photochemical injury is not a consideration. The average power of the data in the lower of these curves equals or exceeds the CW limit. The other three curves approach but do not fall below the repetitive-pulse limit. It should be noted that the leftmost point of each of the curves in Figure 11.18a represents an exposure of 1000 seconds in an immobilized eye with a fully dilated pupil. This is not a condition that is met in real-world situations.
Spot-Size Dependence: CE
Spot size in this context refers to the effective diameter of the laser beam incident at the retina of the eye. More accurate terms would be retinal irradiance diameter or retinal image diameter, and section Spot-Size Dependence therefore discusses the relationship between the ED50 for laser-induced retinal injury and the diameter at the retina of the laser beam causing that injury. For a discussion of the effect of the cross-section profile of the spot (top-hat, Gaussian, etc.), see the work of Henderson and Schulmeister (2004). Spot-size dependence is the area wherein the current guidelines are least satisfying. New data and new interpretations of old data now point to a resolution of a situation wherein data and theory conflict resulting in uncertainty about the guidelines. The new guidelines have reformulated the spot-size dependence to better match the data.
Figure 11.19
A Maxwellian view exposure geometry for irradiation of large retinal areas.

The eye is most susceptible to injury after exposure to a highly collimated laser beam because the laser energy is focused by the optics of the eye to a very small area on the retina of the eye. The eye is also susceptible to injury following exposure to a laser beam that irradiates a larger diameter on the retina. Typically, such an exposure results from diffuse reflection from a surface in the field of view. A Maxwellian view configuration is used to produce larger retinal irradiance diameter exposures to measure the threshold for injury as a function of the retinal diameter (Westheimer, 1966) (Figure 11.19). A beam-expanding telescope enlarges the beam to overfill an aperture at a lens that is positioned to direct a diverging beam into the eye. The beam divergence, θ, is fixed by the aperture diameter and the focal length of the lens while the retinal irradiance diameter is calculated using the relationship D = fmeθ, where fme is the focal length of the rhesus monkey eye (13.5 mm). For comparison of the guidelines to the data, the visual angle α is related to D as α = D/fhe, where fhe is the focal length of the human eye (17 mm).
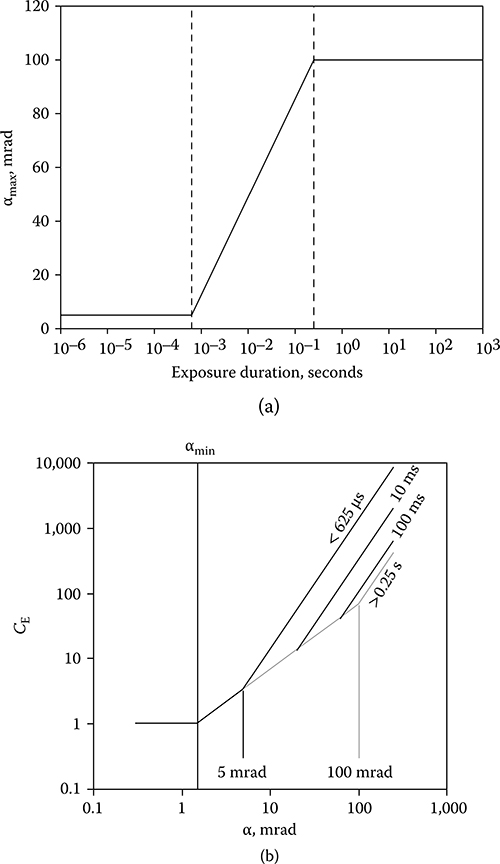
The guidelines specify the MPE as a function of exposure duration and laser wavelength for exposure to a collimated beam, identified in the guidelines as a point source (ANSI, 2007; ICNIRP, 2000; IEC, 2007). A point source has an angular subtense equal to or less than a limiting visual angle, αmin, of 1.5 mrad. The MPE for a source subtending a larger visual angle, α, is obtained by multiplying the point-source MPE by a correction factor (CE in ANSI and ICNIRP, C6 in IEC), which is a function of α. The current guidelines define CE to be equal to one for α < αmin, to be directly proportional to α for αmin < α < αmax and to be proportional to α2 for α > αmax (Figure 11.20a). αmax is defined to be 100 mrad. This formulation for CE was based on bioeffects data collected between 1960 and 1980 (Lund, Schulmeister et al., 2005). These data were in part puzzling because, while thermal models agreed more or less with the data for longer exposure durations, the concept of thermal confinement seemingly required that the threshold for laser-induced retinal injury for short-duration exposures be proportional to the retinal radiant exposure and thus the ED50 expressed as TIE should be directly proportional to the irradiated area (D2 or α2).
More recently, Zuclich et al. (2000, 2008) reported ED50 data resulting from retinal exposures of 7-nanosecond-duration at 532 nm, which showed that, contrary to the older data, the ED50 for laser-induced retinal injury was proportional to D2 over the range of retinal irradiance diameters from 90 to 1600 μm (α = 5–95 mrad). Lund et al. (2007) reported data for the same range of retinal irradiance diameters that show that the ED50 for 0.1 second, 514 nm laser-induced retinal injury is proportional to D. On the basis of these new data, it was recognized that the current form of CE is not an accurate indication of the bioeffects data (Figure 11.20b).
Schulmeister et al. (2005, 2008) presented an examination of the dependence of computer-simulated retinal injury thresholds on retinal irradiance diameter over the range from 30 to 2000 μm and on exposure duration over the range from 1 microsecond to 2 seconds. The computational results were directly compared to and validated by injury thresholds resulting from laser exposure of bovine retinal explants in vitro over a range of irradiance diameters from 23 to 2000 μm and exposure durations from 100 microseconds to 1 second. The computed and experimental thresholds, when expressed as total incident energy, vary as D for small spots and vary as D2 for large spots. The transition between the two zones in terms of D is a function of the exposure duration. The diameter at which the transition occurs is equivalent to αmax in that both define the separation between a D dependence of the ED50 (α dependence of the CE) and a D2 (α2) dependence. These data, supported by a reanalysis of the collected in vivo data, led to a recommendation that the value of αmax separating the regime wherein CE is proportional to α and the regime wherein the CE is proportional to α2 should vary with exposure duration. (Lund, Schulmeister et al., 2005; Schulmeister et al., 2011). The new guidelines redefine αmax, as shown in Figure 11.21a. The effect on CE is shown in Figure 11.21b. The value of CE in the new guidelines accurately follows the experimentally determined spot-size dependence for various exposure durations (Figure 11.22). In this figure, the CE curve has been shifted on the y-axis to coincide with the appropriate data set.
Figure 11.20
(a) The dependence of the source-size correction factor CE on the visual angle α. (b) The dependence of ED50 for 24-hour minimum visible lesion endpoint on the retinal irradiance diameter for macular exposure in rhesus monkeys compared to the current maximum permissible exposure. Diamonds; 0.1-second duration, 514 nm. Triangles; 7-nanosecond duration, 532 nm.

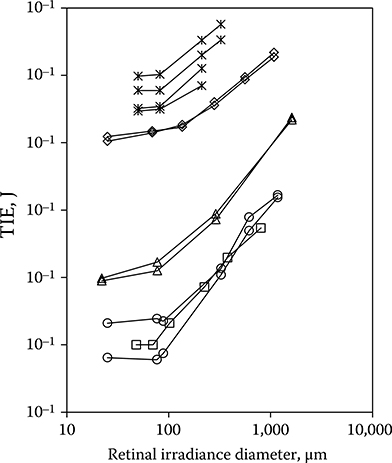
A number of investigations have shown that the incident energy required to produce retinal injury in an intact monkey eye does not decrease for D smaller than about 100 μm, but reaches a minimum at that diameter and remains relatively constant for all smaller diameters (Figure 11.23). These investigations included a number
FIGURE 11.21
(a) The dependence of αmax on the exposure duration in the new guidelines. αmax = 5 mrad for t ≤ 625 microseconds; αmax = 200t1/2 mrad for 625 microseconds < t ≥ 0.25 second; and αmax = 100 mrad for t > 0.25 second. (b) The form of CE for different exposure durations when αmax is time dependent.
of wavelengths and a broad range of exposure duration. The underlying cause for this behavior is unclear. Certainly, the optics of the eye can under normal conditions focus a collimated incident beam to a much smaller retinal diameter. Experimental evidence suggests that the higher than expected threshold for collimated beam exposure is a result of the inability of the investigator to visually detect a very small retinal lesion until the laser energy was increased above the true threshold level (Lund et al., 2008; Lund and Sliney, 2013).
Figure 11.22
The spot-size dependence of the ED50 for several exposure durations. The new CE is calculated for each exposure duration and shifted on the y-axis to match the data. Open squares, t = 2 seconds; open diamonds, t = 0.655 second; open triangles, t = 0.1 second; open circles, t = 0.01 second; solid triangles, t = 0.001 second; solid diamonds, t = 0.0001 second; solid circles, t = 5 nanoseconds.

Figure 11.23
The dependence of ED50 on D for a range of exposure durations and laser wavelengths. Squares: 150 femtoseconds, 1060 nm; open circles: 7 nanoseconds, 532 nm; triangles: 3 microseconds, 590 nm; diamonds: 100 milliseconds, 514 nm; asterisks: 0.125–1 second, 633 nm.
Experiments with bovine retinal explants, in which the anterior portions of the eye including the neural retina are removed so that the RPE layer can be directly irradiated, show that the energy required to damage the RPE continues to decrease with the diameter of the irradiated area for irradiance diameters down to 20 μm (Schulmeister et al., 2008). Figure 11.20b shows that the current guidelines provide a margin of safety for 100-millisecond-duration exposures, even given the possibility that the point source ED50 might be lower than that obtained through in vivo experiments. The current guidelines do not provide a safety margin when compared to the data of Zuclich et al. (2008) for 532-nm Q-switched exposures. The new guidelines will provide a safety margin for that data.
Safety Margin
The safety margin, defined to be the ratio ED50/MPE and commonly assumed to 10, is best viewed as a measure of confidence in the experimentally determined value of the ED50. That degree of confidence is greater for some combinations of exposure parameters than for others. The least confidence is assigned to the ED50 for pulsed exposure to a highly collimated laser beam. The Spot-Size Dependence section discussed uncertainty regarding the true dependence of ED50 on retinal irradiance diameter for diameters less than 80–100 μm and left the possibility that the threshold for damage might be lower in the actively blinking, actively accommodating eye of an alert young human. The Repetitive Pulses section raised the possibility that the laser–tissue interactions involving microcavitation are stochastic rather than deterministic. Figure 11.13 shows more scatter in the data for nanosecond- to microsecond-duration exposures as compared to longer duration exposures. On the other hand, the ED50 data for exposures at retinal irradiance diameters larger than 100 μm do not suffer from the limitations imposed by aberrations, scatter, and detectability; these data are more reliable and thus a smaller safety margin would suffice. Data for CW exposures are supported by deterministic thermal models and are also more reliable than the pulsed exposures.
The safety margin will also vary with wavelength, because the wavelength dependence of the MPE is a simplified model of the wavelength dependence of the retinal susceptibility to laser-induced injury. The new guidelines have adjusted the wavelength dependence in the 1200- to 1400-nm wavelength range to correct a range of very large safety margins in that range.
Conclusion
The body of laser/light-induced bioeffects data is very extensive. The logic and rationale involved in deducing an accurate, consistent, and coherent formulation for the MPE based on these data have been argued and evolved over the last 40 years and continue to evolve as new data challenge the current understanding.
REFERENCES
ANSI. (2007). American National Standard for the Safe Use of Lasers, Z136.1–2007. Orlando, FL: Laser Institute of America.
Brinkman, R., Huttmann, G., Roegener, J., Roider, J., Birngruber, R., and Lin, C. P. (2000). Origin of retinal pigment epithelium cell damage by pulsed lase irradiance in the nanosecond to microsecond time regime. Lasers Surg Med, 27(5), 451–464.
Cain, C. P., DiCarlo, C. D., Rockwell, B. A., Kennedy, P. K., Noojin, G. D., Stolarski, D. J. et al. (1996). Retinal damage and laser-induced breakdown produced by ultrashort-pulse lasers. Graefe’s Arch Clin Exp Ophthalmol, 234, s28–s37.
Cain, C. P., Thomas, R. J., Noojin, G. D., Stolarski, D. J., Kennedy, P. K., Buffington, G. D. et al. (2005). Sub-50-fs laser retinal damage thresholds in primate eyes with group velocity dispersion, self focussing and low-density plasmas. Graefe’s Arch Clin Exp Ophthalmol, 243, 101–112.
Cain, C. P., Toth, C. A., DiCarlo, C. D., Stein, C. D., Noojin, G. D., Stolarski, D. J. et al. (1995). Visible retinal lesions from ultrashort laser pulses in the primate eye. Invest Ophthalmol Vis Sci, 36(5), 879–888.
Cain, C. P., Toth, C. A., Noojin, G. D., Carothers, V., Stolarski, D. J., and Rockwell, B. A. (1999). Thresholds for visible lesions in the primate eye produced by ultrashort near-infrared laser pulses. Invest Ophthalmol Vis Sci, 49(10), 2343–2349.
CIE. (2012). CIE 203:2012 A Computerized Approach to Transmission and Absorption Characteristics of the Human Eye. Vienna: Commission Internationale de l’Éclairage. Connolly, J. S., Zuclich, J. A., Nawrocki, D. A., Bowie, H. W., Lemberger, R. F., Strickford, J. A. et al. (1975). Research on the Effects of Laser Radiation. Brooks AFB, TX: Technology Incorporated, 2nd Annual Report, USAF School of Aerospace Medicine Contract F41609-73-C-0016.
Dillon, J., Zheng, L., Merriam, J. C., and Gaillard, E. R. (2000). Transmission spectra of light to the mammalian retina. Photochem Photobiol, 71(2), 225–229.
Finney, D. J. (1971). Probit Analysis (3rd ed.). New York: Cambridge University Press.
Gabel, V. P., Birngruber, R., and Hillenkamp, F. (1976). Die lichtabsorbtion am augenhintergrund. Munchen FRG: GSF-Bericht A55, Geselschaft fur Strahen- und Umweltforschung.
Gabel, V. P., Birngruber, R., and Hillenkamp, F. (1978). Visible and near infrared light absorption in pigment epithelium and choroid. International Congress Series No. 450: XXIII Concillium Ophthalmologicum Kyoto. Amsterdam: Oxford/Excerpta Medica. Gerstman, B. S., Thompson, C. R., Jacques, S. L., and Rogers, M. E. (1996). Laser induced bubble formation in the retina. Lasers Surg Med, 18(1), 10–21.
Ham, W. T., Jr., Mueller, H. A., Ruffolo, J. J., and Clarke, A. M. (1979). Sensitivity of the retina to radiation damage as a function of wavelength. Photochem Photobiol, 29, 735–743.
Ham, W. T., Jr., Mueller, H. A., Ruffolo, J. J., Guerry Iii, D., and Guerry, R. K. (1982). Action spectrum for retinal injury from near-ultraviolet radiation in the aphakic monkey. Am J Ophthalmol, 93, 299–306.
Ham, W. T., Jr., Mueller, H. A., and Sliney, D. H. (1976). Retinal sensitivity to damage from short wavelength light. Nature, 260, 153–155.
Ham, W. T., Jr., Mueller, H. A., Wolbarsht, M. L., and Sliney, D. H. (1988). Evaluation of retinal exposures from repetitively pulsed and scanning lasers. Health Phys, 54(3), 337–344.
Henderson, R. and Schulmeister, K. (2004). Laser Safety. Bristol and Philadelphia: Institute of Physics Publishing [now Taylor and Francis].
ICNIRP. (2000). Revision of guidelines on limits of exposure to laser radiation of wavelengths between 400 nm and 1.4 mm. Health Phys, 29(4), 431–440.
IEC. (2007). IEC 60825-1 Safety of Laser Products—Part 1: Equipment Classification, Requirements and Users Guide (2nd ed.). Geneva: International Electrotechnical Commission.
Kelly, M. W. (1997). Intracellular Cavitation as a Mechanism of Short-Pulse Laser Injury to the Retinal Pigment Epithelium. PhD Thesis, Tufts University, Medford, MA.
Kelly, M. W. and Lin, C. P. (1997). Microcavitation and cell injury in RPE cells following short-pulsed laser irradiation. SPIE, 2975, 174–179.
Lee, H., Alt, C., Pitsillides, C. M., and Lin, C. P. (2007). Optical detection of intracellular cavitation during selective laser targeting of the retinal pigment epithelium: Dependence of cell death mechanism on pulse duration. JBO, 12(6), 064034.
Lin, C. P., Kelly, M. W., Sibayan, S. A. B., Latina, M. A., and Anderson, R. R. (1999). Selective cell killings by microparticle absorption of pulsed laser radiation. IEEE J. Select Topics Quantum Electron, 5(4), 963–968.
Lund, B. J. (2006). The Probitfit Program to Analyze Data from Laser Damage Threshold Studies, Report No. WTR/06-001, DTIC ADA452974. Brooks City-Base, TX: WRAIR.
Lund, B. J., Lund, D. J., and Edsall, P. R. (2008). Laser-induced retinal damage threshold measurements with wavefront correction. J Biomed Opt, 13(6), 064011.
Lund, B. J., Lund, D. J., and Edsall, P. R. (2009). Damage threshold from large retinal spot size repetitive-pulse laser exposures. Proc ILSC (pp. 84–87). Reno, NV: Laser Institute of America.
Lund, B. J., Lund, D. J., and Holmes, M. L. (2011). Retinal damage thresholds in the 1 ns to 100 ns exposure duration range. Proc ILSC (pp. 183–186). San Jose, CA: Laser Institute of America.
Lund, D. J. (2007). Repetitive pulses and laser-induced retinal injury thresholds. SPIE, 6426, 64625-64626-64628.
Lund, D. J. and Beatrice, E. S. (1989). Near infrared laser ocular bioeffects. Health Phys, 56(5), 631–636.
Lund, D. J., Edsall, P. R., Fuller, D. R., and Hoxie, S. W. (1998). Bioeffects of near infrared lasers. J Laser Appl, 10(3), 140–143.
Lund, D. J., Edsall, P. R., and Stuck, B. E. (1999). Spectral dependence of retinal thermal injury. SPIE, 3902, 22–33.
Lund, D. J., Edsall, P. R., and Stuck, B. E. (2001). Ocular hazards of Q-switched blue wavelength lasers. SPIE, 4246, 44–53.
Lund, D. J., Edsall, P. R., and Stuck, B. E. (2003). Ocular hazards of Q-switched near-infrared lasers. SPIE, 4943, 85–90.
Lund, D. J., Edsall, P. R., and Stuck, B. E. (2005). Wavelength dependence of laser-induced retinal injury. SPIE, 5688, 383–393.
Lund, D. J., Edsall, P. R., and Stuck, B. E. (2008). Spectral dependence of retinal thermal injury. J Laser Appl, 20(2), 76–82.
Lund, D. J., Edsall, P. R., Stuck, B. E., and Schulmeister, K. (2007). Variation of laser-induced retinal injury with retinal irradiated area: 0.1 s, 514 nm exposures. J Biomed Opt, 12(2), 06180.
Lund, D. J., Schulmeister, K., Seiser, B., and Edthofer, F. (2005). Laser-induced retinal injury thresholds: Variations with retinal irradiated area. SPIE, 5688, 469–478.
Lund, D. J. and Sliney, D. S. (2013). A new understanding of multiple pulsed laser-induced retinal injury threshold. Health Phys, in press.
Lund, D. J., Stuck, B. E., and Beatrice, E. S. (1981). Biological Research in Support of Project MILES, Report No. 96. Presidio of San Francisco, CA: Letterman Army Institute of Research Institute.
Lund, D. J., Stuck, B. E., and Edsall, P. R. (2006). Retinal injury thresholds for blue wavelength lasers. Health Phys, 90(5), 477–484.
Menendez, A. R., Cheney, F. E., Zuclich, J. A., and Crump, P. (1993). Probability-summation model of multiple laser-exposure effects. Health Phys, 65(5), 523–528.
Onda, Y. and Kameda, T. (1979a). Studies of Laser Hazards and Safety Standards. (Part 2) Retinal Damage Thresholds for Helium-Neon Lasers. Fort Detrick, MD: Technological Research and Development Institute, Japan Defense Agency, US Army Medical Intelligence and Information Agency Translation No. USAMIIA-K9991.
Onda, Y. and Kameda, T. (1979b). Studies of Laser Hazards and Safety Standards. (Part 3) Retinal Damage Thresholds for Argon Lasers. Fort Detrick, MD: Technological Research and Development Institute, Japan Defense Agency, US Army Medical Intelligence and Information Agency Translation No. USAMIIA-K9992.
Roach, W. P., Johnson, T. E., and Rockwell, B. A. (1999). Proposed maximum permissible exposure limits for ultrashort laser pulses. Health Phys, 76(4), 349–354.
Rockwell, B. A., Thomas, R. J., and Vogel, A. (2010). Ultrashort laser pulse retinal damage mechanisms and their impact on thresholds. Med Laser Appl, 25, 84–92.
Roegener, J., Brinkmann, R., and Lin, C. P. (2004). Pump-probe detection of laser induced microbubble formation in retinal pigment epithelium cells. J Biomed Opt, 9(2), 367–371. Roegener, J. and Lin, C. P. (2000). Photomechanical effects—Experimental studies of pigment granule absorption, cavitation and cell damage. SPIE, 3902, 35–40.
Roider, J., El Hifnawi, E., and Birngruber, R. (1998). Bubble formation as primary interaction mechanism in retinal exposure with 200 ns laser pulses. Lasers Surg Med, 27(5), 451–464.
Schüle, G., Rumohr, M., Hüttmann, G., and Brinkman, R. (2005). RPE damage thresholds and mechanisms for laser exposure in the microsecond-to-millisecond time regimen. Invest Ophthalmol Vis Sci, 46(2), 714–719.
Schulmeister, K., Edthofer, F., and Seiser, B. (2005). Modelling of the laser spot size dependence of retinal thermal damage. Paper presented at the ILSC 2005 Los Angeles.
Schulmeister, K., Husinski, J., Seiser, B., Edthofer, F., Fekete, B., Farmer, L. et al. (2008). Ex vivo and computer model study on retinal thermal laser-induced damage in the visible wavelength range. J Biomed Opt, 13(5), 054038.
Schulmeister, K., Stuck, B. E., Lund, D. J., and Sliney, D. H. (2011). Review of thresholds and exposure limits for laser and broadband optical radiation for thermally induced retinal injury. Health Phys, 100(2), 210–220.
Stuck, B. E., Lund, D. J., and Beatrice, E. S. (1978). Repetitive Pulse Laser Data and Permissible Exposure Limits, Report No. 58. San Francisco, CA: Letterman Institute of Research.
Takata, A. N., Goldfinch, L., Hinds, J. K., Kuan, L. P., Thomopoulis, N., and WeiGandt, A. (1974). Thermal Model of Laser-Induced Eye Damage (DDC AD A-017-201). Chicago, IL: IITRI.
Thompson, C. R., Gerstman, B. S., Jacques, S. L., and Rogers, M. E. (1996). Melanin granule model for laser-induced thermal damage in the retina. Bull Math Biol, 58(3), 513–553.
Vincelette, R. L., Rockwell, B. A., Oliver, J. W., Kumru, S. S., Thomas, R. J., Schuster, K. J. et al. (2009). Trends in retinal damage thresholds from 100 millisecond near-infrared laser radiation exposures: A study at 1110, 1130, 1150, and 1319 nm. Lasers Surg Med, 41, 382–390.
Westheimer, G. (1966). The Maxwellian view. Vision Research, 6, 669–682.
Wolbarsht, M. L., Walsh, A. W., and George, G. (1981). Melanin, a unique biological absorber, Appl Opt, 20(13), 2184–2186.
Zuclich, J. A. and Connolly, J. S. (1976). Ocular damage induced by near-ultraviolet laser radiation. Invest Ophthalmol, 15(9), 760–764.
Zuclich, J. A., Edsall, P. R., Lund, D. J., Stuck, B. E., Till, S. J., Hollins, R. C. et al. (2008). New data on the variation of laser-induced retinal damage threshold with retinal image size. J Laser Appl, 20(2), 83–88.
Zuclich, J. A., Griess, G. A., Harrison, J. M., and Brakefield, J. C. (1979). Research on the Ocular Effects of Laser Radiation, Report SAM-TR-79-4. Brooks AFB, TX: USAF School of Aerospace Medicine.
Zuclich, J. A., Lund, D. J., Edsall, P. R., Hollins, R. C., Smith, P. A., Stuck, B. E. et al. (2000). Variation of laser-induced retinal damage threshold with retinal image size. J Laser Appl, 12(2), 74–80.
Zuclich, J. A., Lund, D. J., and Stuck, B. E. (2007). Wavelength dependence of ocular damage thresholds in the near-IR to far-IR transition region: Proposed revisions to MPEs. Health Phys, 92(1), 15–23.