
Follow these steps to create your first visualization:
- In the Fields pane, if your Calendar table is not already expanded so that you can see the column names in the table, simply click the table name to expand.
- Start by clicking on the IsWorkDay column and drag and drop this column onto the canvas. Instantly, you have a clustered column chart whose y-axis goes from 0 to 800. If you hover your mouse over the column, you will see the text IsWorkDay 782 displayed. This popup is called a tooltip, and this indicates that there are 782 combined working days (Monday – Friday) in the years 2017, 2018, and 2019. Sure, this is a little high because we are not accounting for holidays, but we will get to that later.
Note that in the VISUALIZATIONS pane, IsWorkDay has been added to the Value field and the text IsWorkDay appears in the upper-left of our visual.
In the following screenshot, we can view our first visualization:

Figure 6: Your first visualization – a simple column chart
Obviously, this is not the world's greatest visualization, but it is a start.
- Drag Month from the FIELDS pane into this same visualization.
Now, our visualization has twelve columns of varying heights and, in the Visualizations pane, the Month column has been added to the Axis field. However, if you are being observant, you will notice that the months are in a seemingly strange order. In fact, the months are currently being sorted by the value of IsWorkDay. Let's change that.
- Click the ellipses (...) in the upper-right or lower-right of the visual and then choose Sort by and then Month. Click on the ellipses again, and this time choose Sort ascending. Hmm, it's still not quite right. Our visual is sorted by Month now, but our month names are still in the wrong order from what we would expect. This is because the Month column is text, and therefore, the names of the month are being sorted alphabetically instead of what you would expect to be in the order they occur within a year. Not to worry.
- In the Fields pane, click on the Month column. Now, select the Modeling tab in the ribbon and, in the Sort section, click Sort by Column and then MonthNum:

Figure 7: Sort by Column
There we go. All fixed! Now, our visual's x-axis lists the month names in the correct order! Your visual should now look similar to the following. The specific values in your y-axis may vary:
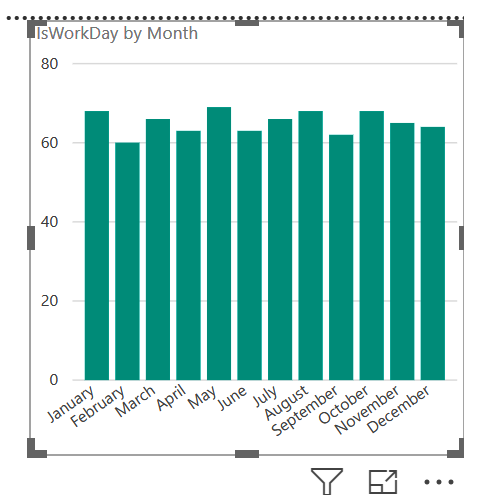
Figure 8: Correctly sorted column chart
Note that when this visual is selected on the canvas that is in the Visualizations pane, the fourth icon to the right in the top row is highlighted. This indicates what type of visual is currently displayed. Visualizations can be changed instantly by simply selecting a different visualization icon.