
Chapter 5: Tapping into the Data Stream
Wireshark provides the ability to capture and analyze network traffic. It is used by network administrators and security analysts in a wide variety of industries, governments, and non-profit organizations. Prior to analysis, you'll need to tap into the data stream and capture packets from the network. Once captured, you can analyze the packets to understand the traffic flow. In this chapter, we'll review the different network architectures, along with the various types of media that can be found on today's networks. Once outlined, this will help you get a better understanding of the complex nature of today's networked environment.
So that you can confidently begin capturing traffic, we'll look at the various options, including capture, input, and output. We'll then review what happens when you tap into a network so that you can identify what types of traffic you'll see. We'll also compare and contrast conversations and endpoints. Finally, so you can better identify abnormal behavior, this chapter ends with a discussion of the importance of baselining network traffic.
This chapter will address all of this by covering the following topics:
- Reviewing network architectures
- Learning various capture options
- Tapping into the stream
- Realizing the importance of baselining
Reviewing network architectures
We live in an exciting yet challenging period in history. Today, our internet-based ecosystem demands that business networks are available nearly 100 percent of the time. Enterprise networks must be able to adjust to changing traffic demands and maintain constant response times. In addition, they have to be agile enough to respond to unexpected security incidents.
Effective packet analysis begins with understanding the network architecture. In order to determine where to tap in to identify trouble spots, it's important to recognize the way that different media and devices influence network traffic. In this section, we will compare the different types of networks in use today, along with the various types of media used to transport data.
Let's begin our discussion by outlining the diverse types of networks in use today.
Comparing different types of networks
Today's networked environments are complex and can include data from mobile phones, cloud computing, virtualization, social media, and the Internet of Things (IoT). The network specialist deals with many different types of networks, which include Personal Area Networks (PANs), Local Area Networks (LANs), Campus Area Networks (CANs), and Wide Area Networks (WANs). All of these different types of networks influence how data is transmitted.
To begin, we will review the smallest network, a PAN, which you may encounter in your analysis.
Discovering PANs
A PAN is a network that shares data between devices that are close, normally within a range of 30 feet. Devices can connect to the internet or other networks. Because devices in a PAN generally communicate using low-powered wireless technology, a PAN is also referred to as a Wireless Personal Area Network (WPAN).
A WPAN is a short-range network that connects personal devices to exchange information using the IEEE 802.15 standard and includes technologies such as Bluetooth, Zigbee, and ultra-wideband.
Conducting packet analysis on a PAN may be done to troubleshoot or test IoT devices that connect to the internet, enabling them to send and receive data. Using Wireshark, you can study protocols such as Message Queuing Telemetry Transport (MQTT), a lightweight messaging protocol used for machine-to-machine communication.
One of the most common types of networks where you will capture traffic is a LAN. The following section provides an overview of the characteristics of a LAN.
Checking out LANs
A LAN is a private network in a localized area that an organization or individual owns, controls, and manages. A LAN is generally within a restricted geographic area, such as a corporate office, manufacturing plant, or healthcare facility, and provides the ability for hosts to share resources.
A LAN provides high-speed bandwidth using Ethernet technology on a fixed frequency, connecting network devices and enabling the ability to communicate and exchange data on a common channel.
Within a LAN, there might be a data center, which is a large group of servers that provide storage, processing, and distribution of critical company data for network clients. The data center is at the heart of any enterprise network and is located in a central location, generally in a secure computer or server room.
In today's large, multifaceted companies, there may be a larger network than a LAN that requires remote locations to serve all of the clients. The following section takes a look at the concept of a CAN.
Exploring CANs
A CAN is a large, private LAN in a common entity, such as a college, hospital, corporate campus, or military base, that has two or more interconnected LANs.
A CAN has a main campus where the central elements of the network reside, such as the data center and telephony, and provides connectivity, data, applications, and services to clients. In addition, a CAN might include remote locations that are away from the main campus.
Because a CAN, at times, is spread across a larger geographic area such as a city, remote locations will need to communicate over a WAN using an internet connection. Let's now discover the qualities of a WAN.
Navigating WANs
A WAN is a geographically dispersed collection of LANs that span a large distance. The internet is the largest WAN, spanning the globe, and is a network of globally connected networks that bring people, processes, data, and things together.
A WAN is different than a LAN in several ways. In most cases, no one entity owns a WAN; rather, WANs exist with shared or distributed ownership and management. WANs use common technology such as Multiprotocol Label Switching (MPLS), which is a data transport method for high-performance telecommunication networks. WANs can carry a signal using a variety of methods, which include the Plain Old Telephone Service (POTS), fiber-optic cables, wireless transmissions, and satellites.
As you can see, there are many different types of networks. In the next section, we'll explore each of the different types of media used to carry the signals.
Exploring various types of media
Devices on a network share access to a common medium that provides a channel for traffic to travel. Media can be either of the following forms:
- Bounded signals are controlled or confined to a specific path by traveling over a copper or fiber-optic cable.
- Unbounded signals travel using a wireless radio wave.
The following is a diagram that represents various types of network media:

Figure 5.1 — Various types of network media
For enterprise networks, it's common for multiple types of media to make up the networking environment. Each media type will influence the data flow and can include copper and fiber-optic cables, along with wireless transmissions.
Network administrators use Wireshark for troubleshooting network connectivity issues. Because of this, it's important to recognize some of the problems that may occur because of the physical layer (layer one) of the Open Systems Interconnection (OSI) model. In this section, we'll take a look at the different types of media that can transmit data. Let's begin by reviewing copper, which is subdivided into two categories, coaxial and twisted pair.
Understanding copper
Copper is a commonly used media type in today's networks for data communications. The two types of media that use copper are coaxial and twisted pair.
Transmitting over coaxial
Coaxial, also called coax, consists of a single copper wire encased by a layer of insulation and then by a grounded shield of braided wire. Coax is able to support high bandwidth and was originally the primary way to transmit data on a LAN.
Coax is no longer used by LANs to transmit data. However, you will still see coax, as it is used by cable television companies to transmit signals to clients in homes and businesses.
Although rare, it is possible to troubleshoot the differences in traffic transmitted between the cable modem and router, as Wireshark has a Data Over Cable Service Interface Specification (DOCSIS) dissector for that purpose.
Communicating with twisted pair
This type of cable consists of twisted pairs of copper wire that use pulses of electricity to carry a signal. The twists provide a shielding effect that minimizes crosstalk.
Twisted pair cabling has eight wires with four pairs of twists and comes in two forms:
- Unshielded Twisted Pair (UTP): This is the most commonly used wire.
- Shielded Twisted Pair (STP): This is used when protection from Electromagnetic Interference (EMI) is necessary.
Today, LANs use twisted-pair cables to transmit data. Twisted-pair cabling is so popular because it is reasonably priced, easy to install, and in most cases, provides high bandwidth for carrying both data and multimedia traffic.
In addition to copper, many companies employ fiber within their organization to provide a high-speed, high-bandwidth option over copper. The following section outlines the characteristics of fiber, which is subdivided into two categories, multimode and single mode.
Using fiber optic
A fiber-optic cable uses pulses of light to carry network traffic over longer distances. Fiber has high throughput that is naturally resistant to EMI. The signals are sent via laser or a Light-Emitting Diode (LED), using a core of glass or plastic. Many times, fiber is used as the backbone on a LAN and comes in two forms:
- Multimode (MMF): This uses multiple light signals, has a higher bandwidth than UTP, and is used to carry backbone traffic in a LAN. MMF can use either glass or plastic, using either LED or laser signals, over a distance of up to 2 km.
- Single mode (SMF): This uses a single light signal. Single-mode fiber has a higher bandwidth than MMF and can carry a signal for many miles. SMF must use a laser to produce a bright, coherent light.
Fiber optic has many benefits, but it is more expensive than twisted pair and requires special equipment to manage. As a result, LANs use fiber primarily for backbone traffic and use twisted pair for work areas.
Today, it is common to see wireless network communication, which uses radio waves to transmit signals. The following section outlines the various ways you may work with Wireshark to analyze a wireless connection.
Discovering wireless networks
Wireless networks use unbound media, which allows users to roam freely while still being connected to the network. Over time, wireless networks have improved in speed and bandwidth, and as a result, you will most likely capture wireless traffic during a troubleshooting exercise.
Wireless technology can provide connectivity for a LAN using Wi-Fi, or for a PAN using Bluetooth. Here, we will compare the two:
- Wi-Fi provides networking on a LAN using the family of IEEE 802.11 standards. Currently, the most widely used standards are 802.11a, 802.11b/g/n, and 802.11ac.
- Bluetooth provides networking on a PAN over short distances from fixed and mobile devices. The technology allows devices to communicate with each other to transfer files, control IoT devices, and provide hands-free calling in your car.
As you can see, there are many variables that you may deal with while capturing and analyzing traffic using Wireshark. The type of network and the media will influence how you capture traffic and what you might see once it has been captured. In most cases, however, packet capture using Wireshark is done on a LAN.
In the next section, we will explore how to properly set up a capture and examine each of the capture option tabs – Input, Output, and Options.
Learning various capture methods
When capturing traffic with Wireshark, most of us are familiar with the main interface, where we go to the lower part of the screen to see what interfaces are active by viewing the sparklines. Once here, you can select an active interface and begin capturing traffic. In addition, you can put in a capture filter and begin capturing traffic.
In addition to the welcome screen, you can go to the Capture drop-down menu and then select Options to do advanced configuration before capturing traffic. Across the top, you will see three tabs, Input, Output, and Options, as shown in the following screenshot:
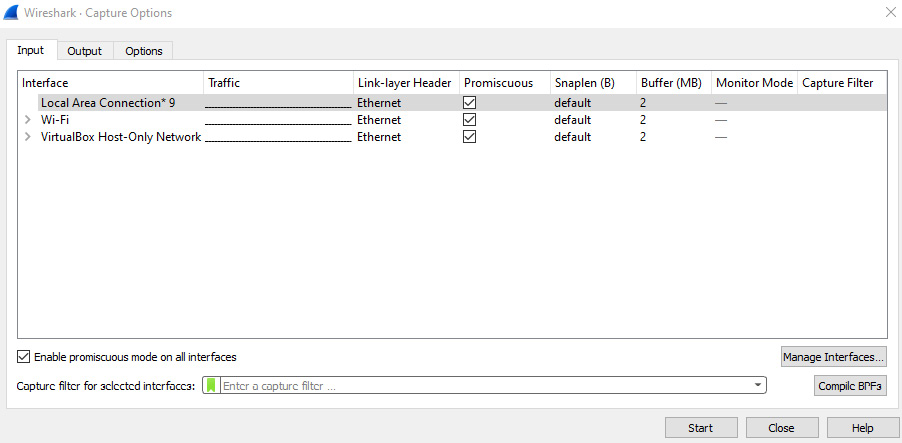
Figure 5.2 — Capture options
Let's start with a discussion on how to set up a capture by selecting an input interface.
Providing input
In the Capture Options dialog box, the Input tab will show a list of available interfaces on your device. Across the top, you will see various column headers, which include Interfaces, Traffic, Link-layer Header, and Capture Filter.
In the lower-left corner, there is a checkbox called Enable promiscuous mode on all interfaces. If you uncheck the box, it will take off promiscuous mode on all interfaces. You can then select the interface you want to be in promiscuous mode by checking the box to the right of it.
Across the bottom, you can create a capture filter for the selected interface.
In the lower right, you can select Manage Interfaces..., which will allow you to hide interfaces that you do not want to be visible on the Input tab. For example, we can see five unchecked USBPcap interfaces in the following screenshot:

Figure 5.3 – Capture options – Managing Interfaces
Once you have selected what you would like for input, you may want to save your file in a specific way. The next section outlines the Output tab.
Directing output
The Output tab directs where and how you want to save your file. Within this tab, there are several options.
The first option is Capture to a permanent file. In most cases, this box is left blank. When you begin capturing traffic, Wireshark will save the capture to a temporary file until you save it as something else.
Output format defaults as saving the file as pcapng (short for PCAP Next Generation); however, you can force Wireshark to save the file as pcap. Most of the time, pcapng is the best choice, as it allows you to add comments.
Whatever option you select, the next selection is Create a new file automatically…. The options include the following:
- After n packets
- After n file size
- After n seconds, minutes, or hours
- When there is a multiple of n seconds, minutes, or hours
The following screenshot shows the Output tab of the Capture Interfaces dialog:
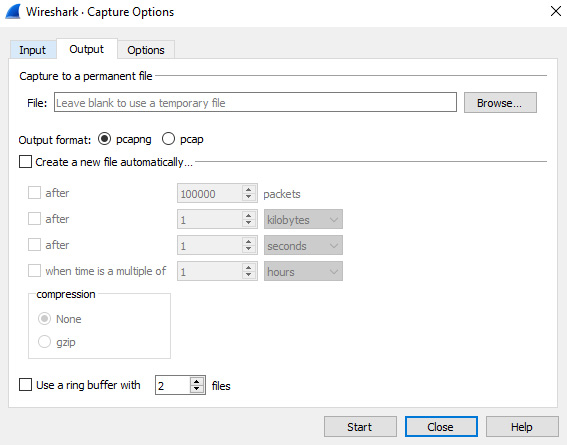
Figure 5.4 – Capture options – Output options
Wireshark also provides the ability to compress files using GNU zip (gzip).
Although you may be tempted to launch Wireshark and let it run while monitoring traffic for a long period of time, that isn't the best option. This is mainly because Wireshark will consume all of your memory if you leave a capture running, as it holds the capture in a temporary file until you stop the capture and save it to a permanent file.
The next selection outlines how you can use a ring buffer to monitor traffic.
Using a ring buffer
A ring buffer is handy if you want to run a capture to watch for a specific protocol or signature on your network. To use a ring buffer, you create multiple files and set a parameter to create a file automatically after either a specific file size is reached, such as after 1 megabyte, or after a period of time has passed, such as 10 seconds.
If you do want to create multiple files, you must specify a filename and location for the files; otherwise, you will throw an error, as shown here:
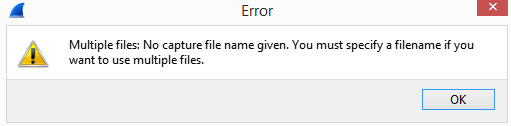
Figure 5.5 – An error message in the capture options
When you are ready, select Use a ring buffer with at the bottom of the dialog box and enter how many files you want to overwrite.
In addition to providing ways to select input and output options, Wireshark provides some custom options that you can modify. Let's take a look.
Selecting options
When looking at the Options tab, you will see across the top Display Options, which can be set as follows:
- Update list of packets in real-time
- Automatically scroll during live capture
- Show capture information during live capture
In addition, you'll also find the Name Resolution choices, which include the following:
- Resolve MAC addresses
- Resolve network names
- Resolve transport names
In most cases, it's okay to resolve MAC addresses and transport names, as these are changed into a human-readable format using static text files found in the local Wireshark folder. The files include the following:
- manuf.txt is a list of Ethernet vendor codes and well-known MAC addresses.
- services.txt holds a local copy of the IANA port numbers file.
However, if you select Resolve network names, this will ask the host Operating System (OS) to contact the Domain Name System (DNS) server multiple times while resolving the IP addresses. This activity will most likely impact system performance and cause additional traffic on the network.
The last selection on the Options tab is Stop capture automatically after…, whatever option you select. There are four choices:
- Packets
- Files
- The size of files
- After a specified time period
This last option can be used when baselining, and you can specify to stop capturing after 1,000 packets and then start your capture; Wireshark will capture 1,000 packets and then automatically stop the capture after a specified time period.
All options are shown in the following screenshot:
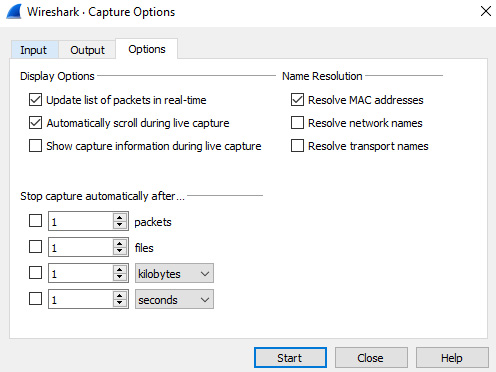
Figure 5.6 – Capture options – the Options tab
After you understand the network architecture and topology and have selected your capture options, you're ready to tap into the network. This next section will review the different types of packets you will see, along with how to look at the conversations and endpoints that are gathered while capturing traffic.
Tapping into the stream
While tapping into a LAN with the Network Interface Card (NIC) in promiscuous mode, the adapter captures the traffic and sends the packets up through the Enhanced Packet Analyzer (EPAN) for dissection and decoding, and then on to the Wireshark interface.
You'll then see the packets filling the screen. If you are on an end device and communicating with another host, you will most likely see three types of packets – namely, broadcast, multicast, and unicast:
- Broadcast: Packets are sent from one host to everyone on a network – for example, an ARP broadcast.
- Multicast: Packets are sent from one host to many hosts – for example, using Enhanced Interior Gateway Routing Protocol (EIGRP) multicasts.
- Unicast: This sends packets from one host to another host– for example, from your computer to a web server.
In a normal conversation with another host, once you have a connection, the OS will create a socket, which consists of an IP address and a port. During a capture, Wireshark will keep track of all of the connections or streams, which you can examine.
This next section explains how you can take a look at the conversations and endpoints in a capture.
Comparing conversations and endpoints
Whenever you are actively connecting with other hosts on the network, the OS keeps track of all the connections. To see all of your active connections on a Windows machine, open a command line and run netstat with the -an parameters, as shown in the following screenshot:

Figure 5.7 – The netstat command showing Transmission Control Protocol (TCP) connections
In Wireshark, a conversation consists of two endpoints that are in a connection together. An endpoint is one side of the conversation. To view all of the conversations in a capture, go to Statistics and then Conversations. Once the window opens, there are tabs along the top that allow you to view a specific type of conversation.
Each tab provides details of the type of conversation you selected, and each row represents one conversation. For example, the Ethernet tab shows conversations listing the MAC addresses of the endpoints, as shown in the following screenshot:

Figure 5.8 – Viewing conversations
You can always add or remove tabs by selecting Conversation Types in the lower right-hand corner, as shown here:

Figure 5.9 – Selecting conversation types
Wireshark has advanced options within this window. Right-click any of the conversations and you will see the following options:
- Apply as a filter: This will select the highlighted conversation and run the filter.
- Prepare as a filter: This will select the highlighted conversation and prepare the filter, which can then be modified. When you are done editing, you must press Enter to run the filter.
- Find: This will select the highlighted conversation and place the variables in the search toolbar.
- Colorize: This will select the highlighted conversation and allow you to create a custom coloring rule.
The following screenshot shows the search toolbar that is launched when you select Find:

Figure 5.10 – The Find toolbar
All of these options allow you to further refine your selection. Right-click and select one of several options that include A to B, B to A, and A to Any.
At the bottom of the window, there are additional choices with which you can refine and customize your view:
- Name resolution: Wireshark will resolve the physical, network, and transport addresses for the specific conversation type. For example, if the TCP tab is selected, the transport address will be resolved.
- Limit to display filter: This will show only conversations included in the current display filter.
- Absolute start time: This will change the start time column to the absolute start time, which is in the Time of Day display format. If you uncheck this, the time will revert to the relative start time, which is in the Seconds since Beginning of Capture time display format.
- Copy: This will copy the list to the clipboard in either Comma Separated Values (CSV) or Yet Another Markup Language (YAML) format. You can then paste it into a notepad file or a spreadsheet.
- Follow Stream: This allows you to see the details of a single TCP or User Datagram Protocol (UDP) conversation.
- Graph: This will launch and display a TCP stream graph on the selected TCP conversation, as shown here:

Figure 5.11 – A TCP stream graph
As you become more experienced with using Wireshark, you will be able to navigate around the interface with ease. Until then, experiment with some of the menu choices and options.
In order to troubleshoot a network more effectively, it is important to start with a packet capture so that you can compare possible changes. One way to achieve this is by creating a baseline, which we will cover in this next section.
Realizing the importance of baselining
Every network is like a snowflake in that no two are alike. Each network has its own signature that includes characteristics such as utilization, network protocols, and latency issues.
A baseline is a packet capture on a subnetwork that is obtained using Wireshark or tshark during normal working conditions. If the network is experiencing problems, the network administrator can then use the baseline to identify any changes. Once you learn what normal network behavior is, you can better identify abnormal network behavior.
In addition to troubleshooting, a network baseline can be used for optimizing, forecasting, planning, and tuning a network. The baseline process goes through several stages – plan, capture, analyze, and save.
We will begin with planning, which provides steps for the best way to go through the process.
Planning the baseline
To plan the baseline, create a network map and list all of the subnetworks and Virtual Local Area Networks (VLANs). You should have a strategy on how you are going to go about the process. Some things to consider include the following:
- The time of day to run the capture
- Whether you are going to capture wireless or wired traffic
- Details about the location
- What applications may be in use on a particular subnetwork
Once planning is complete, we can then move on to the next step, which is where we actually capture network traffic.
Capturing traffic
When it's time to capture the traffic, limit the packet capture to a consistent size so that you have a consistent capture size for the baselines. Determine what an appropriate capture would be for your network so that you can get a snapshot of the network at a slice in time.
The process should be documented – for example, document where the capture was obtained, the time of day, and what equipment was used during the capture.
The key is to be as consistent as possible with your captures so that you compare apples to apples. If you select Statistics and then Capture File Properties, you can add a comment to provide additional information about the capture, as shown in the following screenshot:
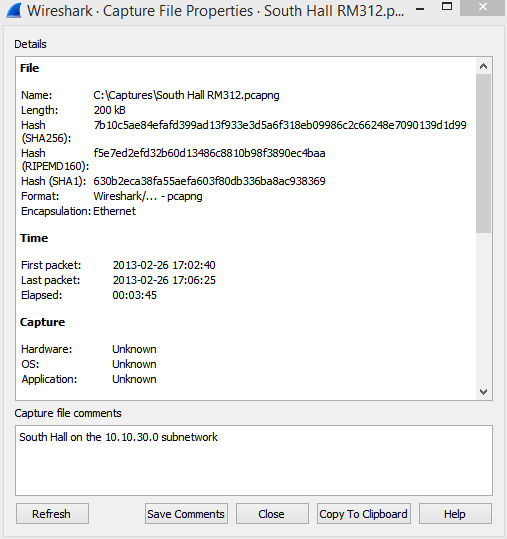
Figure 5.12 – The Capture File Properties window
After we complete the capture phase, we then move to the analyzing phase, where we will take a closer look at the capture.
Analyzing the captured traffic
Once you have obtained the packet capture, take a moment, and review the capture to see whether anything stands out as unusual or suspicious. Within Wireshark, you can go to Statistics and then Protocol Hierarchy to spot-check what protocols appear on the subnetwork, as shown here:

Figure 5.13 – The Protocol Hierarchy Statistics window
For example, after examining the capture, you will see a large amount of Spotify (a streaming music service) traffic, which is prohibited on your network. At that point, you might choose to investigate the source of the traffic.
In addition, you can go to Statistics and then Conversations to identify what ports are in use. After all of the captures are complete, we will move on to the final phase where we save the captures for later comparison.
Saving the baselines
Once you have completed and analyzed the capture, and made any appropriate comments, it's time to preserve the baseline. Whether you work on your own or within a team, you should have a standard format and procedure to document the findings.
The suggested guidelines for documentation include the following:
- List where the capture was taken, and include the name of the building and/or subnetwork.
- List the name of the technician who performed the capture. If someone has questions about the capture, they can contact the individual.
- List the date and time of the capture.
- Outline or summarize the overall findings, such as "normal traffic flow with no unusual or unauthorized protocols in use".
- List the name of the file and where the baseline is stored.
Although much of the information in the preceding list can be recorded within the capture in the form of comments, it's best to document to preserve the information.
When naming the capture files, have your team agree on a standard format. This is so you can easily search through the captures later. One format or standard might be to use the building name and room or even the subnetwork IP address.
For example, you might use this format – building-room-subnet (or BLD-RM-SN). Then, if you have a capture from aviation building – room 78 – subnetwork 192.168.10.112, you can save the file as AV-78-10.112.pcap.
The format for saving the information can be a shared spreadsheet that the team can update and use to record their findings.
Summary
By now, you understand the many different types of networks that can influence how data travels. In addition to the various network types, we saw how we must also contend with the media that transmits the data. So that you can effectively capture traffic, we took a closer look at various capture selections that include display options, using multiple files, and name resolution.
We then moved into a discussion of the different types of traffic you will see when tapping into a switched network and compared the difference between conversations and endpoints. We then looked at the many options for analysis within the Conversations window. Finally, we summarized the importance of baselining the network and provided some steps on how to move through this process.
In the next chapter, we will discover the many ways to personalize the Wireshark interface. You will learn ways to adjust the appearance and basic layout. I'll show you ways to add, modify, and personalize the configuration profiles. Then, we will evaluate how to add comments to a single packet or an entire capture. Finally, we'll take a look at creating a complex filter expression and a button for your toolbar to simplify your analysis.
Questions
Now, it's time to check your knowledge. Select the best response, and then check your answers with those found in the Assessments appendix:
- A _____ is a private network in a localized area that an organization or individual owns, controls, and manages:
- LAN
- WAN
- CAN
- PAN
- When using name resolution, it is okay to select Resolve MAC Addresses and Resolve transport names, as these come from static text files. _____ is a list of Ethernet vendor codes and well-known MAC addresses:
- vendor.txt
- services.txt
- manuf.txt
- network.txt
- In the capture options, the ___ tab allows you to specify where and how you want to save your file:
- Input
- Output
- Options
- Baseline
- When using a fiber-optic cable, ___ carries a single light beam that can carry a signal for many miles and must use a laser:
- multimode
- coaxial
- UTP
- single mode
- In the Output tab of the capture options, Output format saves the file by default as ___; however, you can force Wireshark to save the file as .pcap:
- .pcapng
- dmp.gz
- cap.gz
- .txt
- This type of cable consists of twisted pairs of copper wire that use pulses of electricity to carry a signal:
- Multimode
- Coaxial
- UTP
- Single mode
- In Wireshark, a _____ consists of two endpoints that are in a connection together:
- coax
- named pair
- conversation
- statistic
- If you select _____ and then Capture File Properties, you can add a comment to provide additional information about a capture:
- Capture
- Edit
- View
- Statistics