
Chapter 18: Subsetting, Saving, and Exporting Captures
Not every packet capture is the perfect size or representative of the data you need to analyze. Whether you have captured the traffic yourself or someone has sent a file to you to examine, some packet captures are large and cumbersome. Many times, large files have to be subdivided into smaller files for effective analysis. In addition, when done, you will most likely need to save the file, or in some cases, export the capture into a specific format.
In this chapter, we'll cover several methods and techniques that we can use to work with packet captures. So that you can reduce a large file to a more manageable size, we'll look at filtering the capture to narrow down the results. You'll learn how versatile Wireshark is in exporting different components of a capture. Finally, you'll see how you can export files, along with specified packets, packet dissections, and objects. In addition, you'll discover reasons and ways to add comments to a single packet or an entire capture.
This chapter will address all of this by covering the following:
- Discovering ways to subset traffic
- Understanding options to save a file
- Recognizing ways to export components
- Identifying why and how to add comments
Discovering ways to subset traffic
Packet analysis is used for a variety of reasons, including troubleshooting, testing, monitoring, and baselining the network. Although we can reduce the file size before we begin our analysis by using a capture filter, many times we gather all the traffic so that we don't miss any important details. Then, once captured, the file can be shared with other members of the team for further analysis or to point out specific issues.
While capturing traffic, it's optimal to get a capture that is the perfect size and includes only the troublesome packets. However, that is not always the case. At times, you may find you have to work with a large file, for a variety of reasons that include the following:
- You have obtained the capture from a network device with a large amount of traffic. Tapping into the network, even for a short time, can generate a huge number of packets. Even if you used a capture filter while obtaining the file, you may still end up with a large amount of data.
- You have received a file from someone with good intentions, who felt a large capture would help your analysis. For example, you have received a large file from a co-worker that captured traffic off of the server and they need your help in analyzing a specific problem.
Whatever method you've used to obtain the capture, you'll need to work with it in Wireshark. Keep in mind that while Wireshark can load a large file, it can be very resource-intensive and slow in responding. This is because Wireshark will attempt to dissect all the protocols before displaying the capture. In addition, when you apply a display filter to a large capture, it will take a while to filter the traffic. As a result, the best option is to subset the capture and focus on the problem areas.
When we subset traffic, we break it down into smaller files for analysis. There are many ways to break down or subset traffic, which include subsetting by IP address, port number, protocol, or a specific stream.
Together, we can examine ways of breaking apart a large file using bigFlows.pcap, located here: http://tcpreplay.appneta.com/wiki/captures.html#bigflows-pcap. Once there, download the file and open it in Wireshark so you can follow along.
When you open bigFlows.pcap, you can easily see how cumbersome it is to work with a large file, as this capture has 791,615 packets. For example, even when entering a simple filter to display only Transmission Control Protocol (TCP) traffic, it will take time for Wireshark to rescan the capture and present the data. Wireshark has a status bar that indicates the process while rescanning the capture, as shown on the lower left-hand side of the following screenshot:
Figure 18.1 – Rescanning the capture
Depending on the system used to analyze the capture, it may run very slowly, freeze up, or even shut down Wireshark.
Once you have opened the file, you'll need to plan what data you want to subset. There are many ways to achieve this, and it really depends on what you want to analyze. In this section, we'll look at a few ways to break down a large capture. First, we'll examine how to use an Internet Protocol (IP) address to subset traffic.
Dissecting by an IP address
One way to break down a large capture is by filtering a specific IPv4 or IPv6 address and then using the subset for your analysis. For example, you suspect that a specific host is causing excessive bursty traffic. By homing in on the activity of a specific IP address, you can better troubleshoot the issue.
Let's review how to narrow your search. In any large capture, you will most likely have gathered many IP addresses. Go to the bottom of the Statistics menu, where you will see menu choices for both IPv4 Statistics and IPv6 Statistics, as shown in the following screenshot:
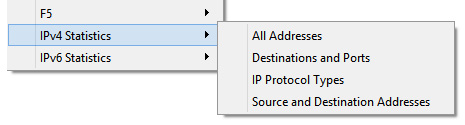
Figure 18.2 – IPv4 and IPv6 statistics
The IP statistics have four choices for either IPv4 or IPv6, which include the following:
- All Addresses: Provides a sortable list of IP addresses, as shown:
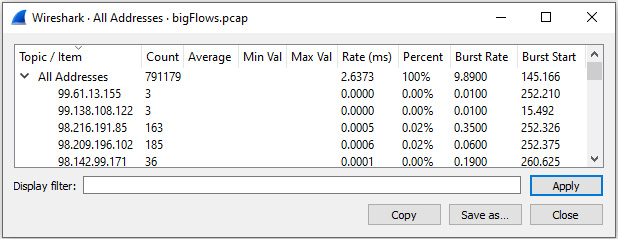
Figure 18.3 – Statistics: All Addresses
- Destinations and Ports: This report shows a detailed list that breaks down each IP address with additional statistics on TCP and User Datagram Protocol (UDP), as displayed in this screenshot:
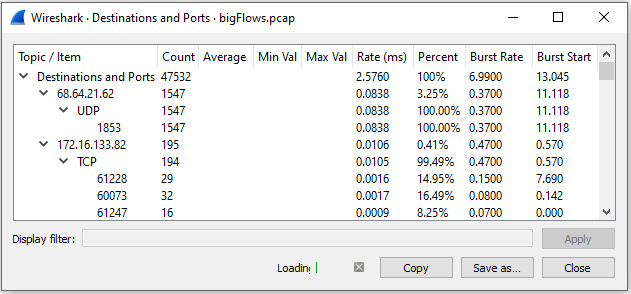
Figure 18.4 – Statistics: Destinations and Ports
- IP Protocol Types: This report breaks down by protocols that follow the IP header, which can be TCP, UDP, or NONE, as shown:
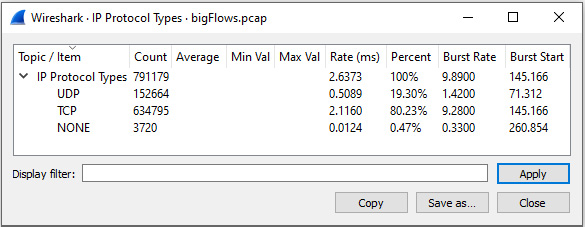
Figure 18.5 – Statistics: IP Protocol Types
- Source and Destination Addresses: This breaks down all addresses by source and destination IP addresses.
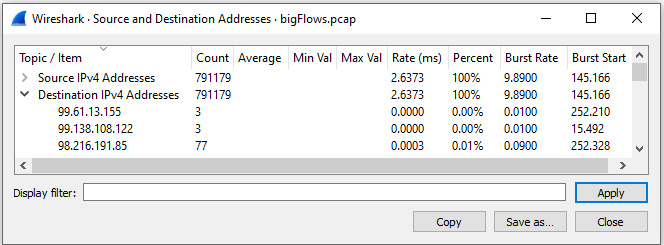
Figure 18.6 – Statistics: IP Protocol Types
All filters have additional information, such as Count and Burst Rate, along with the ability to filter and sort. In addition, you can select Save as... to save any of the statistics in a variety of file types, as shown here:
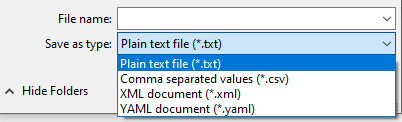
Figure 18.7 – Statistics: Save as
While subsetting traffic by IP addresses may be helpful to home in on troublesome hosts, another way to break down a large capture is by using conversations.
Narrowing down by conversations
A conversation is two endpoints communicating with one another. In a large capture, you will most likely have many conversations. To see a list, go to the Statistics menu and select Conversations, as shown:
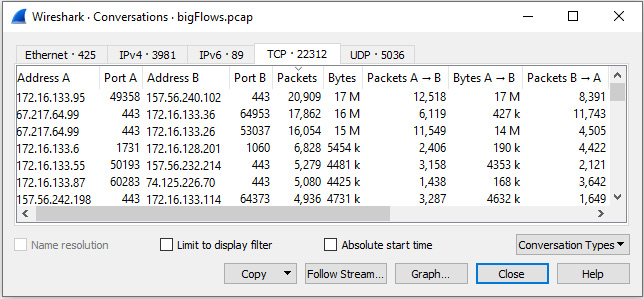
Figure 18.8 – Displaying all conversations
Once in the Conversations dialog box, we can sort by columns to identify top talkers, which are the two endpoints that are exchanging the most data. We can also select a conversation between two known endpoints, such as a Voice over IP (VoIP) client and server exchanging data. Once identified, we can use the data to create graphs and flow charts for analysis.
Within the window, you will see tabs along the top that allow you to view a specific type of conversation, such as Ethernet, IPv4, TCP, and UDP. Select a conversation, such as the one between 172.16.133.95 and 157.56.240.102. Once selected, you can filter the results so that you only see the traffic you want to use as your subset, as shown in the following screenshot:
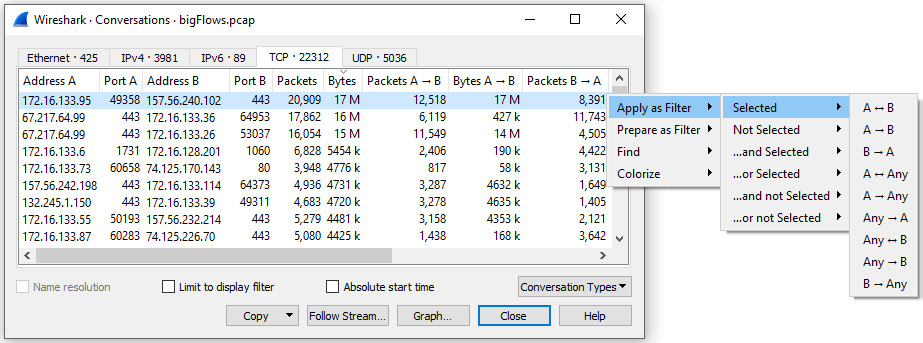
Figure 18.9 – Conversations: Filter options
Within one capture, there may be many conversations. Although you may find that subsetting a large capture by conversations is helpful, sometimes, you may want to zero in on a specific port and use that as your subset. The following section illustrates how you can filter by port numbers, so you can work with the resulting smaller file.
Minimizing by port number
While subsetting by IP address or conversation may be helpful, sometimes you may want to study a specific port. You might be looking through the conversation under either the TCP or UDP tab and identify suspicious port usage. Or you may want to further investigate a specific port used in a multicast stream when checking for bursty traffic.
There are many reasons to subset by port numbers. In Wireshark, you can find a list of UDP/TCP ports in a few areas, which include the following:
- Conversations
- Endpoints
- IPv4 or IPv6 Destinations and Ports
- UDP Multicast Streams
For example, return to bigFlows.pcap, then go to Statistics and then UDP Multicast Streams, as shown:
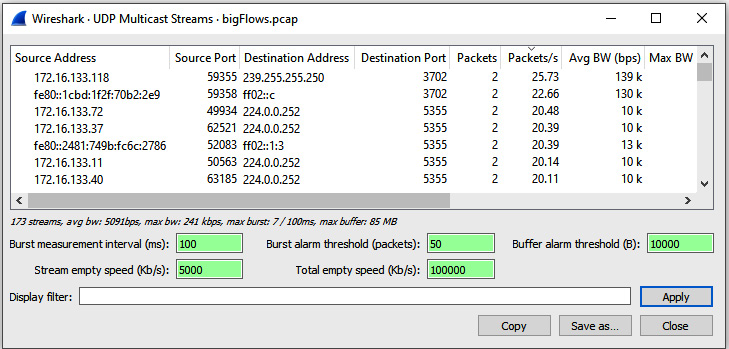
Figure 18.10 – UDP Multicast Streams
Once you run the report, you can isolate the port you want to analyze, apply a filter, and select only the traffic you want to use as your subset.
Another way to dissect a large capture is by filtering on a specific protocol. Let's take a look.
Breaking down by protocol
Wireshark is capable of dissecting hundreds of protocols. To see a list, go to Statistics and then Protocol Hierarchy, which will provide a list of what protocols appear in the capture. As with many other options, within Protocol Hierarchy Statistics, you can apply a filter and create your subset, as shown in the following screenshot:
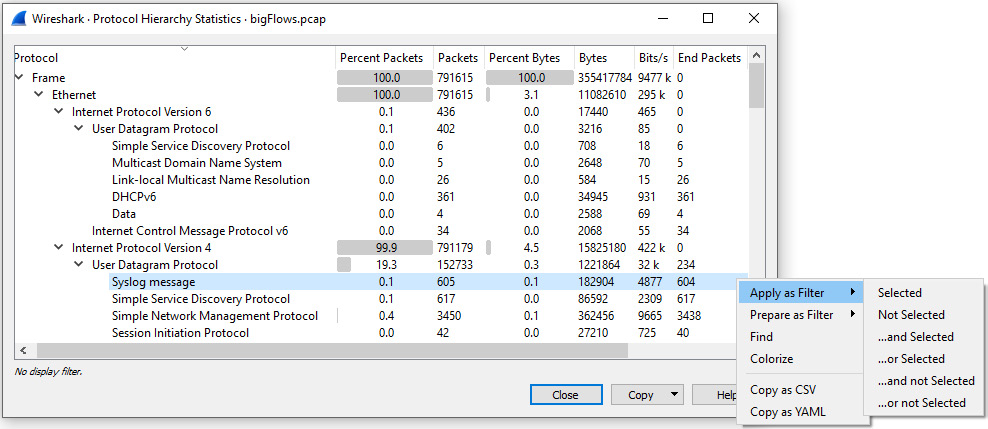
Figure 18.11 – Protocol Hierarchy: Apply as Filter
In addition, if you know the protocol you want to review, you can use a display filter, enter a specific protocol, and use that as your subset.
One of the common ways of analyzing traffic is by examining a particular traffic stream. In the final segment, we will see what elements of a capture we can view by using the follow the stream feature.
Subsetting by stream
There are times when you may want to see only the details of a single traffic stream. An easy way to do this in Wireshark is to use the follow the stream option.
You must first select either a TCP or UDP conversation, right-click and select Follow, and then select the appropriate stream, such as TCP, UDP, TLS, or HTTP.
For our example, we'll use bigFlows.pcap. In the display filter, enter tcp.stream eq 946. It will take a while to filter. Once complete, you will see the contents of the communication stream, which is a web page, as shown in the following screenshot:
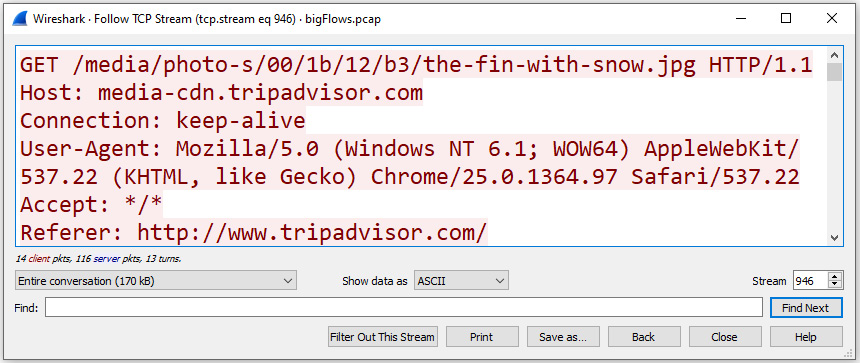
Figure 18.12 – Follow TCP Stream 946
Now that we have reduced the file to a more manageable size by using any of the preceding methods to subset traffic, the next step is to preserve the file in some way. You can save the file in the default .pcapng format, or in one of the many other formats that have been added and enhanced over the years.
With Wireshark, there are many ways to subset a file to a more practical size. After you have subsetted the capture, you will most likely want to save the file to preserve your work. The following section provides various ways to save a file in Wireshark.
Understanding options to save a file
Whenever you run and then stop a capture, Wireshark will hold the capture in a temporary file. Wireshark will display the temporary filename in the Status bar, which is found on the lower left-hand side of the interface. In addition, along the top, you will see the name of the interface used in the capture and an asterisk, as shown in the following screenshot:
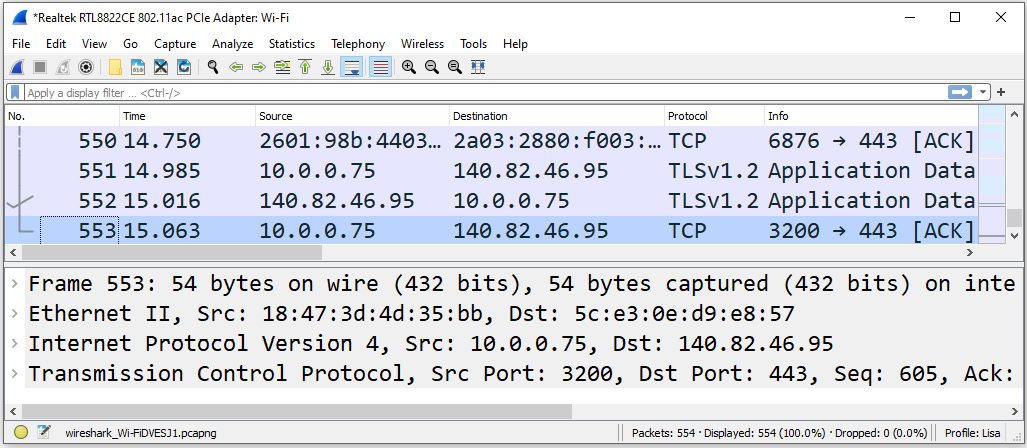
Figure 18.13 – Temporary file in Wireshark
At some point, you will most likely want to save the file. To save the file, go to the File menu choice and then click on Save. Once you save the file, the filename will appear along the top of the Wireshark interface, as shown in the following screenshot:
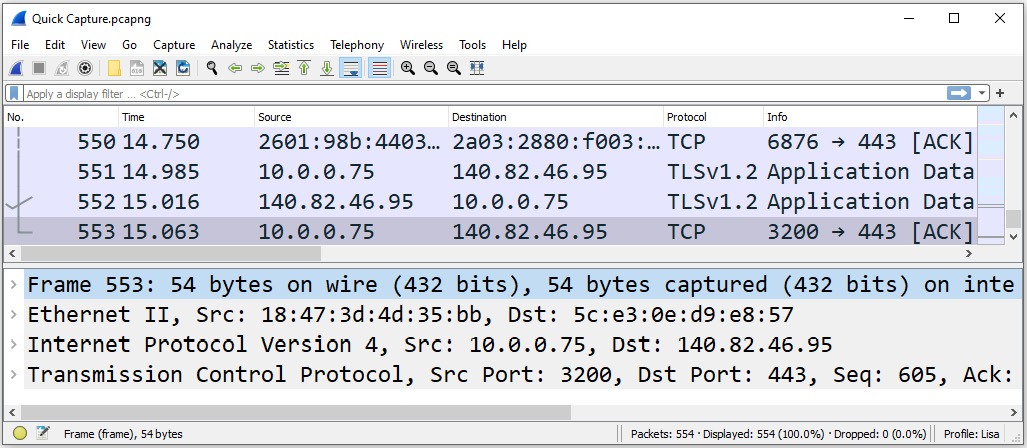
Figure 18.14 – File saved in Wireshark
When you do go to File and then Save, you will find that Wireshark will allow you to save the capture file in many different formats, as discussed next.
Using Save as
The File menu choice has many common options to work with files, such as Open, Import, Save, Print, and Export. One option is to use Save as when you need to save the file as something other than the default extension, which is .pcapng.
When you are ready to save the file, go to the File menu choice and select Save as, which will open a dialog box, as shown in the following screenshot:
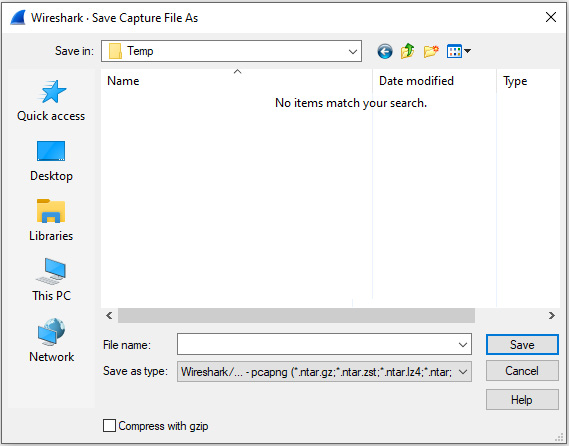
Figure 18.15 – The Save Capture File As dialog box
Over the years, developers have added many different file formats to Wireshark. As a result, when you click on the Save as type dropdown, you will see a list of all the supported file formats. The following screenshot shows a partial list of the formats available:
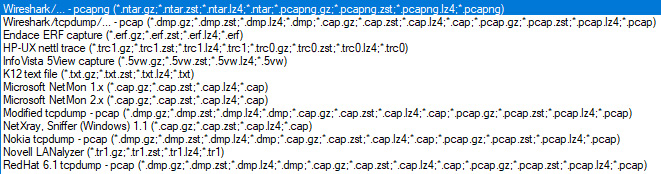
Figure 18.16 – Partial list of Save as selections
Some of the formats available include Microsoft NetMon (.cap), Novell LANalyzer (.tr1), Sniffer (Windows: .caz), and K12 text file (.txt). While some of the formats are legacy and might not ever be used, it's nice to know you have a variety of options.
One common use of the Save as menu choice is to open a file in one format and then save it in another format. An example is obtaining a file with a .pcap extension. Although you can do many things with a .pcap file, that format can be restrictive. For example, when analyzing a file in the .pcap format, you cannot save any comments. If you do add any comments, when you close the file, Wireshark will prompt you to save as .pcapng if you want to preserve your comments.
Therefore, in most cases, saving as a .pcapng is a better option, as this format has several enhancements and is able to dissect and display payloads better.
While saving an entire file is common, you may want to export only a portion of the file. The next section covers the various ways to export specific packets, along with various objects found within the capture file, such as images or web pages.
Recognizing ways to export components
We discussed the many ways you can subset a capture to reduce the file to a more practical size, such as by IP address, port number, or stream. Another option is to export the subset as specified packets or packet dissections, or even export various objects that exist in the capture.
Let's take a look at the many export options Wireshark offers, starting with specified packets.
Selecting specified packets
After you have filtered a capture, you may want to export a portion of the capture. With Wireshark, you can be very specific in what you select to export. Let's step through an example.
Return to the bigFlows.pcap capture and enter tcp.stream eq 946 in the display filter. Once you have run the filter, you are ready to preserve this subset. In this case, we will go to the File menu choice and then select Export Specified Packets. Once open, you will see that you have several ways to export file components, as shown in the following screenshot:
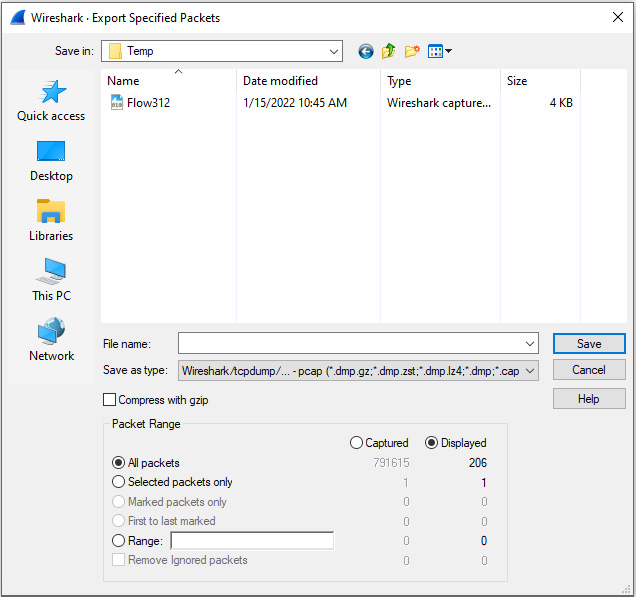
Figure 18.17 – Export Specified Packets
Near the bottom of the dialog box, you will see a header named Packet Range, where you will make your selections. If you have filtered the capture, Wireshark will assume you would like to export only the displayed packets, and the radio button for Displayed will be active. However, if you want to export all the packets, select Captured.
Below that, you will see other choices for the packet range you would like. The options include the following:
- All packets: This will export all packets. Wireshark will show how many are either Captured or Displayed.
- Selected packets only: This will only export the packet selected. In most cases, you will have placed your cursor on one of the packets, so Wireshark will assume you have selected that packet. That is why in Figure 18.17, Wireshark shows one (1) packet in the Selected packets only option.
- Marked packets only: Marking packets allows you to right-click and mark a specified packet or packets of interest, causing the packet(s) to turn black. When selecting this option, Wireshark will only process marked packets.
- First to last marked: If you have marked several packets in your capture, Wireshark will export all marked packets, from the first to the last.
- Range: This will allow you to specify a packet range. For example, if you enter 233-799, Wireshark will only export that range.
- Remove Ignored packets: If in a capture you have ignored certain packets (see Chapter 4, Exploring the Wireshark Interface, under the Marking or ignoring packets section) and you select this option, Wireshark will not include the ignored packet(s) in the export.
TCP stream 946 is a web page retrieved from a travel site, so we'll name the file Web Page. When exporting, you will need to force the file format to be .pcapng, as Wireshark will default to the original file format, which is .pcap, for bigFlows.pcap. To export only TCP stream 946, follow these steps:
- Go to the File menu choice and then click on Export Specified Packets.
- Leave the default values as they are, as shown in Figure 18.17.
- Select a location in which to save the file.
- In File name, enter Web Page.
- Under the drop-down menu for Save as type, select Wireshark/…– pcapng.
Once the export is complete, close bigFlows.pcap, and then open the newly created file: Web Page.pcapng.
Within the File menu choice, we will also find Export, which includes several options. The options include the ability to export specific packets or bytes, TLS session keys, and other objects, as outlined next.
Exporting various objects
When working with a capture, there may be a variety of objects within the file. Wireshark reassembles the objects, which can be collected and analyzed, as long as the object is unencrypted.
There are several reasons you may need to collect objects within a capture file. For example, during an active malware investigation, you may need to see what types of files are being transferred. Or there may be some concern that an individual may be sending sensitive information out of the organization. Wireshark makes it easy to export objects so that you can take a closer look at the type of traffic that is being sent across the network.
Some of the possible objects that can be exported include those identified within the following protocols:
- Digital Imaging and Communications in Medicine (DICOM)
- HyperText Transfer Protocol (HTTP)
- Internet Message Format (IMF)
- Server Message Block (SMB)
- Trivial File Transfer Protocol (TFTP)
If you suspect that any of the preceding protocols contain objects, you can export them for examination by going to the File menu choice and then Export Objects, as shown in the following screenshot:
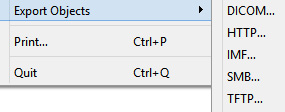
Figure 18.18 – Export Objects
For example, open the bigFlows.pcap file. Once open, select Export Objects and then HTTP.... Wireshark will locate all objects, such as text/css, applications/javascript, images, and text/html. This will take a few seconds, depending on the size of the file. Wireshark will then present a list, as shown here:
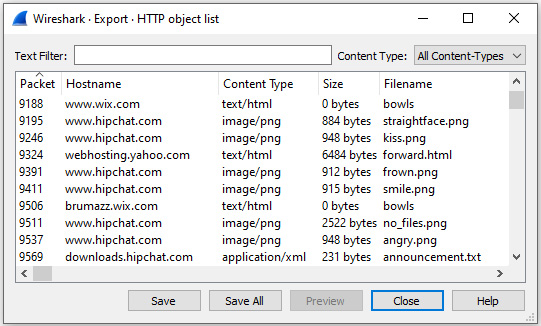
Figure 18.19 – HTTP object list
In the dialog box, you can search for text strings. In the lower left-hand corner, you'll see a Text Filter label. Enter footstesp-to-the-summit.jpg [sic], exactly as shown in the following screenshot:
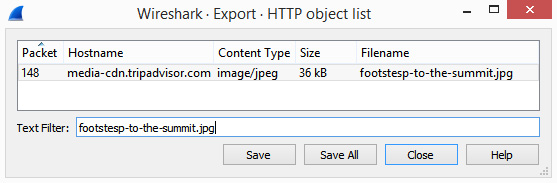
Figure 18.20 – Searching footstesp-to-the-summit.jpg
Select Save, and when the dialog box opens, enter the filename and the appropriate extension. In this case, I used footstesp-to-the-summit.jpg. After you save the object, you can then locate, open, and view the image.
If there are other objects of interest, you can save them individually as well. Alternatively, you can select Save All, and Wireshark will save all objects found in the file.
As evidenced, Wireshark provides many ways to preserve and export components and objects. But what happens when you're done working with a file?
While doing analysis, you may know why you are working on a particular capture. However, when you return to the file, you may not remember what caused you to look at the capture in the first place. In addition, if you share the file with a co-worker, they may not be able to identify why the file was significant. In either case, it's best to identify key elements and concerns by adding comments.
To preserve the reasons why the file was important, Wireshark provides ways to add comments, as discussed in the following section.
Identifying why and how to add comments
When working with trace files, you might need to make a note on a single packet or the entire capture, for future reference.
Wireshark has options when working with comments. You can add comments to preserve the details of the entire capture or a single packet, as outlined next.
Providing file and packet comments
Within Wireshark, you can comment on the entire capture to document what you found within the file. You might preserve this information, either for yourself or to share with others when working with a team. Let's walk through an example of adding a comment using the Web Page.pcapng subset.
To add a comment to the file, you can do one of the following:
- Select the comments icon in the lower left-hand corner, which looks like a pad and pencil.
- Go to Statistics | Capture File Properties and include your comments in the space below Capture file comments.
For example, in my Web Page.pcapng file, I went to Statistics | Capture File Properties and entered the comment HTTP traffic with interesting images. I then clicked Save Comments, as shown in the following screenshot:
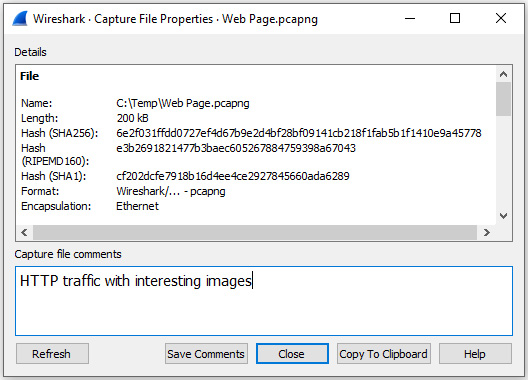
Figure 18.21 – Capture file comments
Keep in mind that when adding comments, Wireshark does not highlight spelling errors. Therefore, if you want the comments in your file to look professional, take the time to check your spelling.
Adding a comment to an entire file is handy. However, sometimes you may want to preserve the details of one or more packets within the file that you found to be interesting. Adding a comment to a single packet is similar to adding a comment to the entire file. However, while in a single packet, go to the Edit menu choice and select Packet Comments, as shown in the following screenshot:
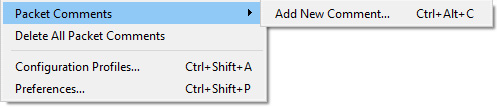
Figure 18.22 – Packet Comments selection
Wireshark will open a form where you can add your comment. If you would like to add more comments later, simply select the same packet and repeat the steps you took to add the original comment.
In addition, you can delete all packet comments by going to the Edit menu choice and selecting Delete all Packet Comments, as shown in Figure 18.22.
After adding or editing comments, you'll need to save them so you can view them later, as discussed next.
Saving and viewing comments
Once you are done adding comments, either on the entire file or a single packet, you'll see that the filename has an asterisk in front of the name, as shown along the top of the Wireshark interface:
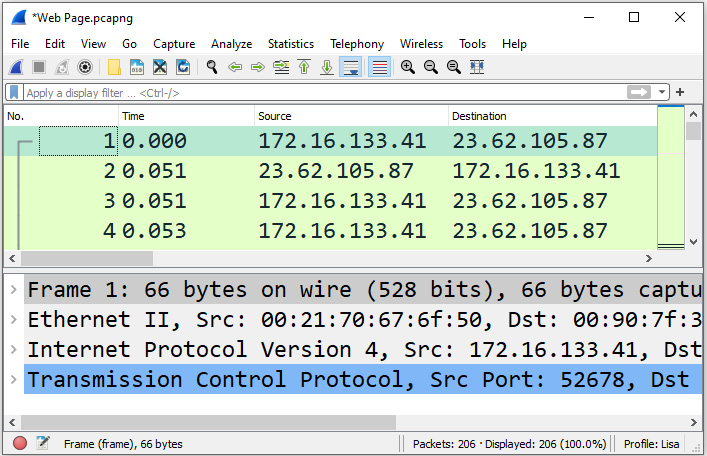
Figure 18.23 – Filename with an asterisk
The asterisk serves as a reminder that you have modified the capture. When you close the capture, Wireshark will prompt you to save the modified file. It's important to note that you must save in .pcapng format when using comments.
Once preserved, there are several ways to view the comments:
- To see comments on a file, go to Statistics | Capture File Properties. This will open a dialog box, as shown in Figure 18.21.
- To see comments on individual packets, go to Expert Information and select Show Comments, which is on the lower right-hand side of the console. You will then see the comments listed, as shown here:
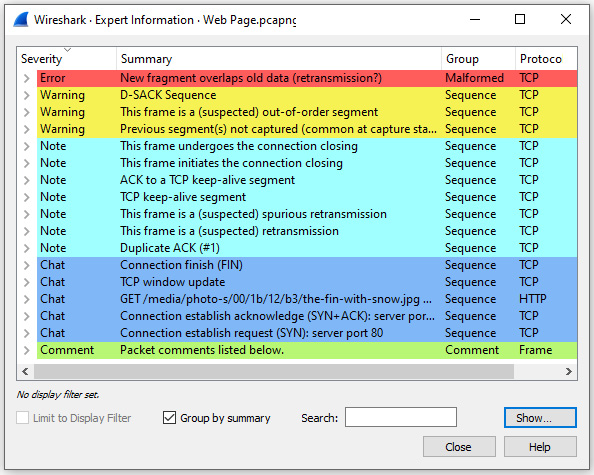
Figure 18.24 – Expert Information: show comments
As evidenced, it's easy to add comments to an entire capture or a single packet so that you or your team can view the comments at a later date.
Summary
In this chapter, we discovered how you can take a large, unmanageable file and turn it into a smaller, more manageable file. Once reduced, we can then share the file with co-workers or preserve the capture for future reference. You learned about the many ways to subset traffic, which includes filtering by IP address, conversation, port number, or stream. We discovered that, after working with a packet capture, there are many options and formats available in Wireshark to preserve the capture. In addition, you now know about the many ways to export files, objects, session keys, and packet bytes. Finally, in order to preserve the reasons why the file was important, we discovered how we can add comments to a single packet or an entire capture.
In the next chapter, we'll first discover the many ways the Statistics menu can help us when analyzing a capture file. We'll also learn how to create basic I/O graphs to help visualize network issues, such as dropped connections, lost frames, and duplicate acknowledgments. We'll then look at ways we can modify the settings along with other options when working with an I/O graph. We'll summarize by comparing how the different TCP Stream Graphs can provide a visual representation of the streams.
Questions
Now, it's time to check your knowledge. Select the best response, and then check your answers with those in the Assessment appendix:
- A _____ in Wireshark represents two endpoints that are communicating with each other.
- Match point
- Tuple
- Conversation
- Filter
- Wireshark is capable of dissecting hundreds of protocols. To see a list of all of the protocols present in a given capture, go to Statistics and then _____.
- Protocol Hierarchy
- Conversations
- IPv4 Statistics
- Match point
- Currently, when you save a file, the default file format in Wireshark is _____.
- snoop.gz
- .pcapng
- .pcap
- erf.gz
- When working with packets, right-click on a specified packet or packets of interest and select _____, which will turn the selected packet(s) black.
- Ignore
- Snoop
- Spatter
- Mark
- When you select Export Objects _____, Wireshark will locate and include all objects that include applications/javascript, images, and text/html, and then display a list of the objects found.
- DNS
- DICOM
- HTTP
- SMB
- Prior to saving a capture you have run, along the top of the interface, you will see the name of the interface used in the capture and a(n) _____.
- .temp extension
- Pencil icon
- Em dash
- Asterisk
- To add a comment to an entire capture file, you can go to the _____ menu choice and then Capture File Properties and include your comments in the space below Capture file comments.
- Statistics
- View
- Edit
- File