Chapter 7: Using Display and Capture Filters
Whether analyzing data in real time while capturing traffic or investigating a pre-captured file, you're generally faced with a huge amount of data. How do you make sense of all this information? Most likely, you will benefit from filtering the traffic to narrow the scope, so that Wireshark only displays the traffic that you want to see. This chapter reviews the many methods you can use in Wireshark to filter traffic.
When working with data, it appears as if the capture and display filters are the same. However, while either one can filter traffic, each has its own syntax that must be used when creating a filter. To help you better understand the different ways to refine your view, we'll cover when to filter traffic and outline the difference between display and capture filters. So that you can refine your skills when zeroing in on specific traffic, we'll review ways to drill down to a specific field value by building an expression. In addition, we'll learn how to create more complex filters using logical operators. Finally, because filters are so helpful, we'll cover some tricks, shortcuts, and common filters that will help you achieve a more effective analysis.
This chapter will cover the following:
- Filtering network traffic
- Comprehending display filters
- Creating capture filters
- Understanding the expression builder
- Discovering shortcuts and handy filters
Filtering network traffic
Wireshark, along with many other packet analysis tools, can take a large capture, filter specific types of traffic, and refine your view to help with analysis. Within Wireshark there are several options you can use to filter traffic:
- Display filters: Used during an active capture or on a pre-captured file
- Capture filters: Applied prior to capture to only display a certain type of traffic
- Expressions: Creates complex filters using logical operators
- Shortcuts: Builds a filter on the fly while analyzing packets
Wireshark has capture and display filters that can be used to refine your view. Each filter is applied during a specific time when analyzing traffic. In the next section, let's explore when the best time is to apply a filter.
Analyzing traffic
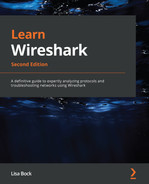
While examining traffic, there are four main phases of packet analysis, as discussed in Chapter 2, Using Wireshark. The phases are Gather, Decode, Analyze, and Display, as shown in the following diagram:
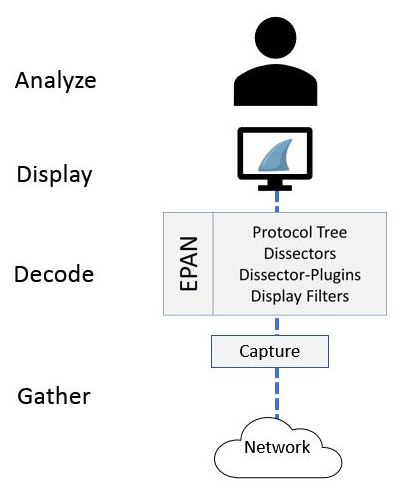
Figure 7.1 – Phases of packet analysis
Refining your view can begin as you are gathering traffic by using a capture filter. The filter will remove unwanted traffic before the packets are presented to the user.
Capturing traffic
While gathering network traffic, the packets pass through the appropriate capture engine, such as Npcap or WinPcap. If you want to see only specific traffic, you will need to use a capture filter, and when used, Wireshark will drop any packets that are not in the filter. For example, when capturing Wireless Local Area Network (WLAN) traffic, and you want to filter out any beacon frames, you will apply this capture filter: wlan[0] != 0x80.
Capture filters will remove any unnecessary traffic. However, to filter out unwanted packets while preserving all the traffic, you should use a display filter.
Viewing traffic
Once the packets go through Wireshark's Enhanced Packet ANalyzer (EPAN), it then passes the dissected traffic through the Graphical User Interface (GUI) to be presented to the user and then analyzed. While displaying packets in the Wireshark interface, you can apply a display filter using the appropriate syntax, and apply the filter before, during, or after capture.
Similar to our previous example, when capturing wireless traffic, if you want to filter out any beacon frames while preserving all packets you will apply this display filter: !(wlan.fc.type_subtype == 8).
While building either a capture or a display filter, Wireshark will check the syntax to see whether the string is valid. Let's see how this works.
Checking syntax
When creating filters while analyzing traffic, we inherently know what to build, and in most cases, we will generate a valid filter. Wireshark helps us create an appropriate filter by checking the syntax prior to running a capture. The syntax checker works as follows:
- A valid display filter will turn the background green and the filter will run.
- An invalid or incomplete string will turn the background red and the filter will not run.
- An unknown display filter or string will turn the background yellow and the filter might run.
While it is common to see a green or red background, in rare cases, you may see a yellow background. For example, while filtering for Dynamic Host Configuration Protocol (DHCP), if you enter bootp instead of dhcp the background will turn yellow, as shown here:
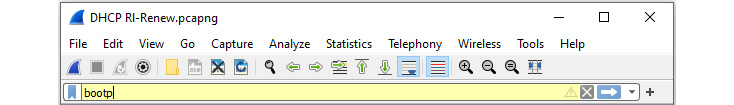
Figure 7.2 – Syntax checker with a yellow background
While the filter might run, you may get unexpected results.
In the next section, we'll outline the purpose of two files, dfilters.txt and cfilters.txt, in the Wireshark folder, which are used to hold a list of filters.
Comparing the filters' files
Within the Wireshark folder, there are two text files used for Wireshark's built-in and any user-saved filters, and these are as follows:
- dfilters.txt holds a list of display filters.
- cfilters.txt holds a list of capture filters.
The files relate to the bookmark icon on the hard left of either the display or capture filter bar. As shown here, we see the blue icon on the display filter bar:

Figure 7.3 – Viewing the bookmark icon
Working with either word filter file, once modified they can be copied and then shared with a coworker. In addition, you can customize either file when using a specific profile, so that you can access the customized filters by simply switching profiles.
First, we'll take a look at the display filters file.
Investigating display filters
You'll find a list that holds the display filters in the dfilters.txt file. Once you locate the file, you can open it in Notepad, as shown here:
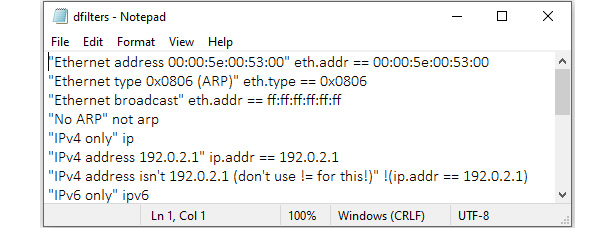
Figure 7.4 – dfilters.txt
The filters are represented by a Name | Filter pairing. For example, when examining the filter that excludes Address Resolution Protocol (ARP) traffic, you will see the following:
- Name: The name of the filter, surrounded by quotation marks. For example, "No ARP".
- Filter: The syntax for the filter. For example, not arp.
Next, we'll view how the capture filters are stored.
Examining capture filters
The cfilters.txt file holds a list of the capture filters, as shown in the following screenshot:
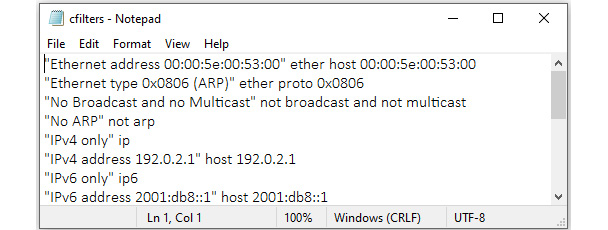
Figure 7.5 – cfilters.txt
Similar to the display filters, the capture filters are represented by a Name | Filter pairing as well. For example, when examining the filter that includes only Transmission Control Protocol (TCP) traffic, you will see the following:
- Name: The name of the filter, surrounded by quotation marks. For example, "TCP only".
- Filter: The syntax for the filter. For example, tcp.
Note
While it is possible to open and modify either file in Notepad, as shown, it's safer and easier to use the Wireshark interface to make changes to the filters. For example, by going to the Analyze | Display Filters… menu option and then editing in the dialog box, you preserve the correct syntax.
Now that you have seen the main differences, let's take a closer look at the display filters.
Comprehending display filters
While capturing traffic, or analyzing a pre-captured file, display filters help to narrow the scope and home in on specific types of traffic. It's not uncommon to have a capture with over 3,000 packets containing many different types of traffic.
When you launch Wireshark, you will see the startup screen. Across the top, below the icons, is the filter toolbar. Within the toolbar is the text Apply a display filter…, where you can easily apply and edit display filters, as shown here:
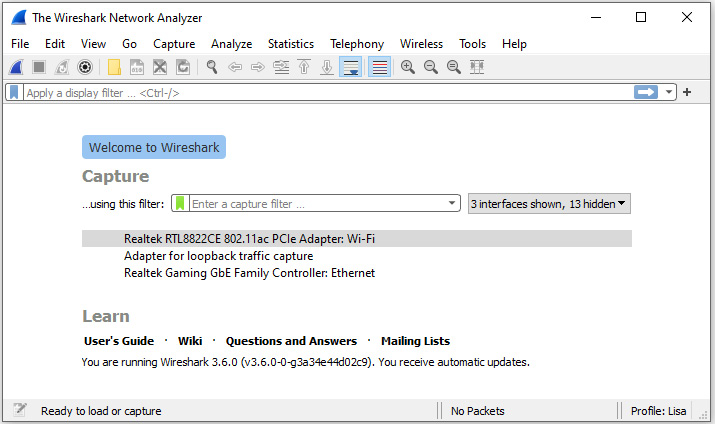
Figure 7.6 – Wireshark startup screen
You can create a simple filter on any of the protocols Wireshark supports by using a single protocol or adding a logical operator. For example, if you want to see TCP or ARP traffic, then you would use the tcp || arp display filter.
Wireshark's display filters can easily be modified. The following section illustrates how you can edit the display filters to customize your workflow.
Editing display filters
After working with the display filters, you may need to change an IP address, port number, or make some other change. To edit the display filter, go to the Analyze menu, and then select Display Filters…, which will bring up the following dialog box:
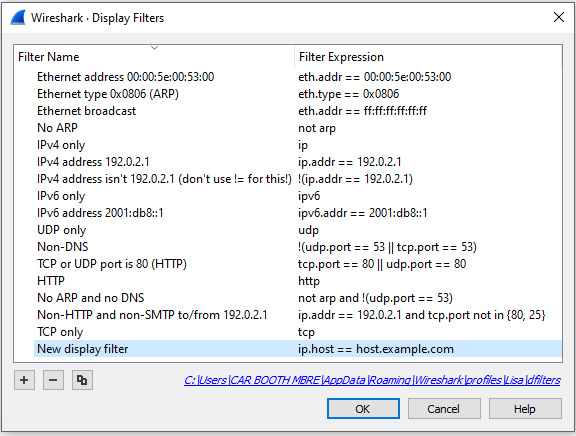
Figure 7.7 – Display Filters dialog box
Once there, you can select one of the three icons as shown in the lower left-hand corner of the Display Filters dialog box:
- A plus icon will add a new display filter. When selected, Wireshark will create a space where you enter a name on the left and the actual filter on the right, as shown in Figure 7.7.
- A minus icon will delete a display filter. Select (highlight) the filter you want to remove and hit the minus sign to remove the filter from the dialog box and update the dfilters.txt file.
- A copy icon will copy a display filter. Once copied, you can modify the filter without changing the original. Wireshark will then add the new filter to the dfilters.txt file.
In the next section, we'll see how, when you do get a display filter that works and you would like to reuse it, you can save it to a bookmark.
Using bookmarks
On the right-hand side of the display filter, there is a blue toolbar icon called bookmarks. This is where Wireshark's built-in filters and any user-saved filters reside. If you click on the icon you will see options, along with several pre-loaded filters that you can use, as shown here:
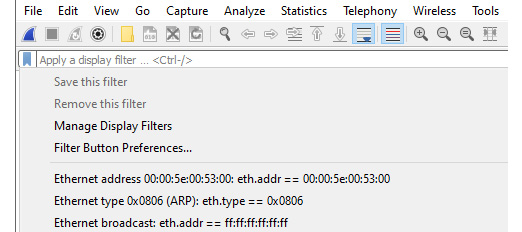
Figure 7.8 – Display filter bookmark dropdown
When working with bookmarks, you will see configuration options that include the following:
- Save this filter: After you create a filter, you can save the filter to the bookmark by selecting this option.
- Remove this filter: This will delete the filter currently in use that is stored in the dfilters.txt file.
- Manage Display Filters: This will open the Display Filters dialog box.
- Filter Button Preferences…: This will open the Preferences dialog box with the Filter Buttons option highlighted.
Below the selections, you will see a list of filters. Even if you have never saved a filter, you will see the list, as Wireshark will show the list of filters found in the dfilters.txt file.
Once you create your own filter or select one from the drop-down list, you can press Enter or click the blue arrow on the right-hand side of the display filter to run the filter.
On the far-right side of the display filter is a drop-down arrow (caret). When selected, you can see previously used filters, as shown in the following screenshot:
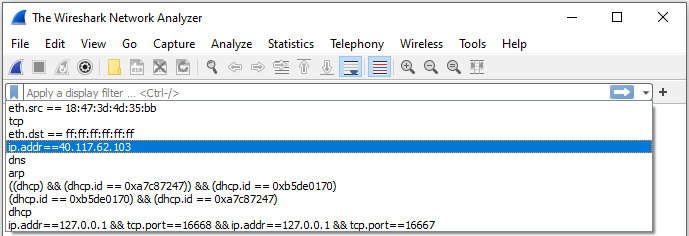
Figure 7.9 – Previously used display filters
A display filter can be applied before, during, or after packet capture. When you are ready to clear the filter, select the X on the right-hand side of the filter, as shown here:
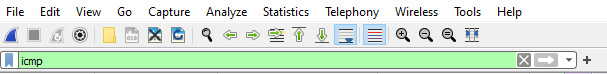
Figure 7.10 – The display filter toolbar
As we can see, display filters can be very helpful in providing a more targeted view of the capture. However, there may be times that you only want to gather a certain type of traffic. In that case, you would use a capture filter, which we'll discuss in the next section.
Creating capture filters
Understanding how to use display filters is important. However, capture filters help target only the traffic you want to see. In addition, filtering can remove much of the noise, such as management traffic and ARP broadcasts.
You can create a capture filter in a couple of ways as follows:
- Go to the center of the startup screen and enter the filter following ...using this filter: as shown in Figure 7.6.
- Go to the Capture menu and then select Options..., as shown here:
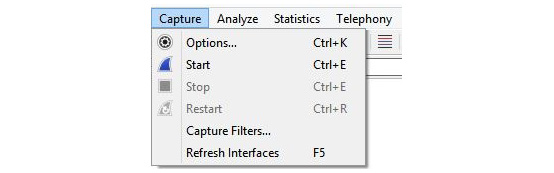
Figure 7.11 – Capture menu dropdown
Once there, you will see capture options, and at the bottom of the dialog box you will see the capture filter area, as shown in the following screenshot:
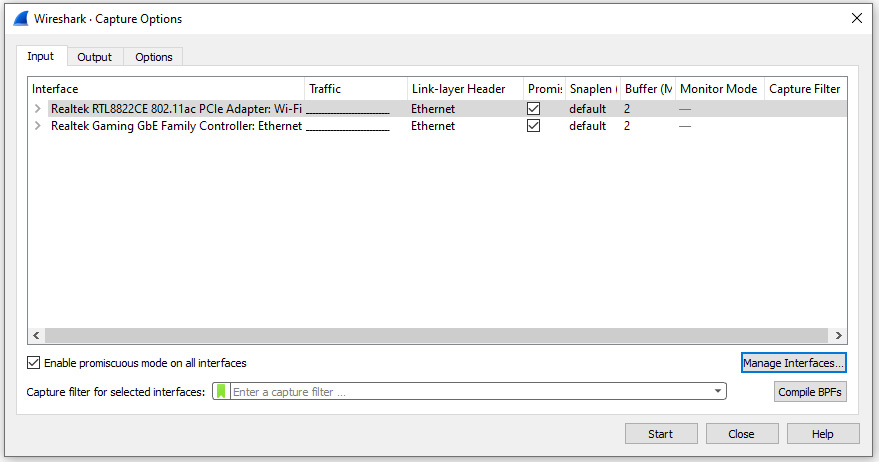
Figure 7.12 – Location to add a capture filter
Although both options will give you the ability to create a capture filter, I generally go to the Capture menu choice and select Options..., as this will allow me to see all the interfaces.
You can create a capture filter on any of the protocols Wireshark supports by using a single protocol or multiple ones and adding a logical operator. To clear the filter, select the X on the right-hand side of the capture filter.
To see your previously used capture filters, go to the right-hand side of the capture filter and select the down arrow to display the list. This is similar to the display filter drop-down list, as shown in Figure 7.8.
In addition to being able to modify the display filters, you can customize capture filters as well, as outlined in the following section.
Modifying capture filters
To edit the capture filters, go to the Capture menu choice and then select Capture Filters, which will display a list of prebuilt filters, as shown in the following screenshot:
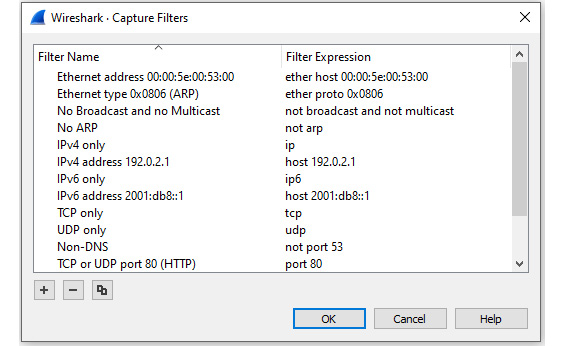
Figure 7.13 – Capture Filters dialog box
At the bottom of the dialog box, there are three icons:
- The plus icon will add a new capture filter. When selected, Wireshark will create a space where you enter a name on the left and the actual filter on the right.
- The minus icon will delete a capture filter. Select (highlight) the filter you want to remove and hit the minus sign to delete the filter from the dialog box and update the cfilters.txt file.
- The copy icon will copy a capture filter. Once copied, you can modify the filter without changing the original. Wireshark will then add the new filter to the cfilters.txt file.
Although the capture filters interface may look like the display filter toolbar, the syntax is different. As a result, you'll need to be careful when crafting a capture filter as it uses the Berkeley Packet Filter (BPF) syntax. In the next section, we'll walk through an example of creating a capture file using the appropriate syntax.
Recognizing BPF syntax
Capture filters can reduce the number of packets obtained by gathering only the type of traffic you want to see. For example, if I need a filter to capture File Transfer Protocol (FTP) traffic only, then I might enter ftp in the capture filter, as I would in the display filter. However, you will see the syntax checker turn red, which means this is an invalid filter, as shown here:
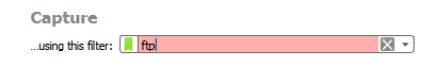
Figure 7.14 – Invalid capture filter syntax
Although this filter would work as a display filter, you must write a capture filter that uses the correct syntax.
When creating a new capture filter, try using one of the prebuilt filters as a guide to properly build your filter. Let's see how this works.
Crafting a capture filter
When you need to create a capture filter, find a capture filter similar to the one you need, select the filter, and click the copy icon. Wireshark will copy the filter and place it at the end, where you can edit it.
Let's go through an example of creating a capture filter for FTP by copying an existing filter:
- Go to the Capture menu and select Capture Filters.
- Select the HTTP TCP port (80) capture filter and then click the copy icon. Wireshark will place the copied filter at the end of the list, as shown in the following screenshot:
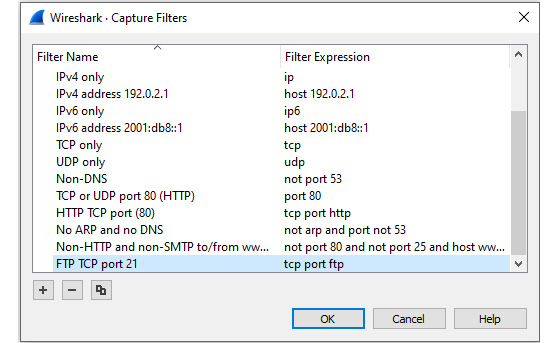
Figure 7.15 – Create new capture filter
- To edit the filter, change the name to FTP and change the filter to tcp port ftp or tcp port 21.
- Close the Capture Filters dialog box.
- Restart Wireshark so that the newly created capture filter is recognized.
To use the newly created filter, follow these steps:
- Go to the Capture menu choice, and then select Options....
- Click the interface that will be used to capture traffic. For example, in the following screenshot, the Microsoft: Wi-Fi interface is selected.
- In the capture filter area, drop down the green bookmark and select the filter you just created. The bookmark will turn yellow, as shown here:
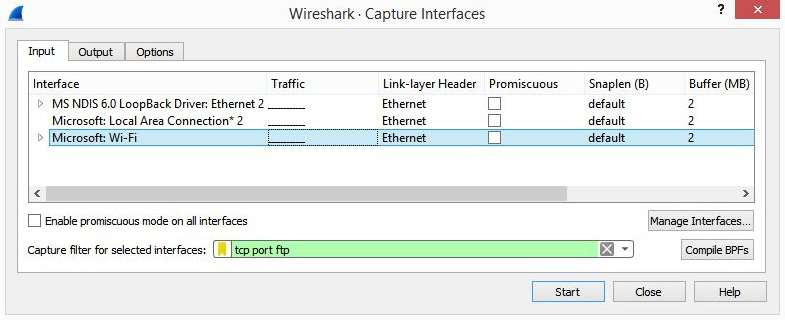
Figure 7.16 – FTP capture filter
- Once you click Start to begin your capture, you will only capture FTP traffic.
Note
When you are done using a capture filter, make sure you remove any trace of the filter by going into the Capture menu and then Options.... Once open, delete the capture filter so that you can capture all traffic again.
You might have used a capture filter that works well, and you would like to preserve the filter for future use. Next, let's take a look at how you can save your capture filter to a bookmark.
Bookmarking a filter
On the right-hand side of the capture filter is a green toolbar icon called bookmarks, where the built-in capture filters are stored. Any time you create and save a filter, Wireshark will store the filter in the bookmark.
If you click on the green toolbar icon, you will see a list of capture filters, as shown in the following screenshot:
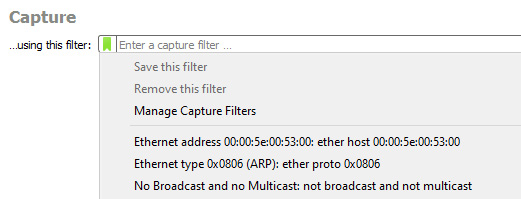
Figure 7.17 – Capture filter bookmark drop-down
Once there, you can select one of the filters, and Wireshark will populate the capture filter field.
If you create a filter and want to save it, drop down the bookmark icon and select Save this filter, and Wireshark will store the filter in the bookmark.
Capture filters can be useful; however, keep in mind that while using a capture filter, you might miss important traffic that can help during troubleshooting or searching for evidence of intrusion.
During analysis, you may need to create an expression using specific field values. The following section outlines how to use the expression builder.
Understanding the expression builder
In addition to building simple display filters, Wireshark has the ability to create an expression that zeroes in on specific field values. To build an expression, go to Analyze and then select Display Filter Expression, as shown here:
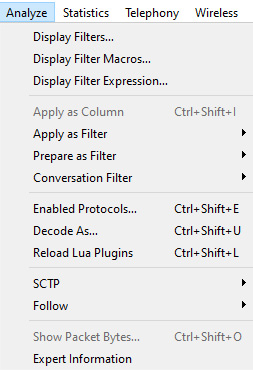
Figure 7.18– The Display Filter Expression menu choice
Click the link to launch the expression builder. On the left-hand side, you will see a list of all of Wireshark's supported protocols, as shown in the following screenshot:
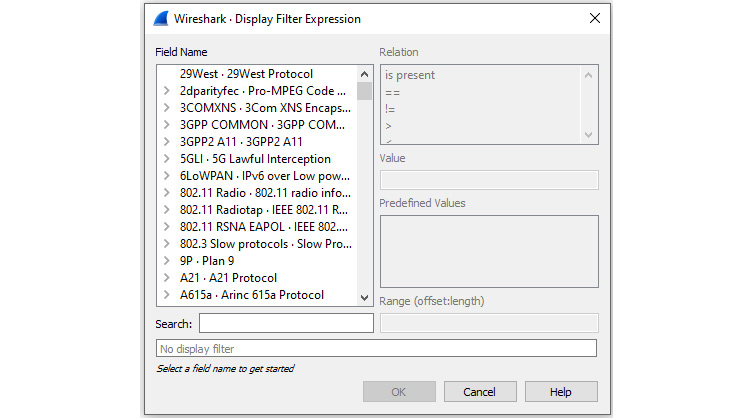
Figure 7.19 – Display Filter Expression
Wireshark is capable of dissecting hundreds of protocols with more added all the time, so the list will be long.
To further refine the filter, you can select from the four variables listed on the right-hand side:
- Relation: This is a list of comparison operators to compare a field value against another value using logical operators:
- is present: Indicates the selected field exists in the capture
- ==: Equal to
- !=: Not equal to
- >: Greater than
- <: Less than
- >=: Greater than or equal to
- <=: Less than or equal to
- Value: Indicates the appropriate value required. Wireshark populates this with the appropriate type of value, that is, Boolean or string.
- Predefined Values: Wireshark populates this with the appropriate values for a given field.
- Range (offset:length): This allows you to enter a range of integers such as 4-8 or 12-20 if they are an appropriate selection for this field or filter.
Now that you have a good understanding of what the expression builder can do, let's go through a simple example of building a custom filter.
Building an expression
In this example, I want the filter to show me all the packets that have the TCP SYN flag present. On the left-hand side of the Display Filter Expression dialog box, I have drilled down and selected the tcp.flag.syn value. Wireshark will populate the following on the right-hand side of the dialog box:
- Relation: ==
- Value: 1
- Predefined Values: Set
Range is grayed out as this is not an appropriate selection for this field value.
Once all the values are selected, Wireshark populates the display filter area along the bottom with the generated expression. In this case, the filter is tcp.flags.syn == 1, as shown here:
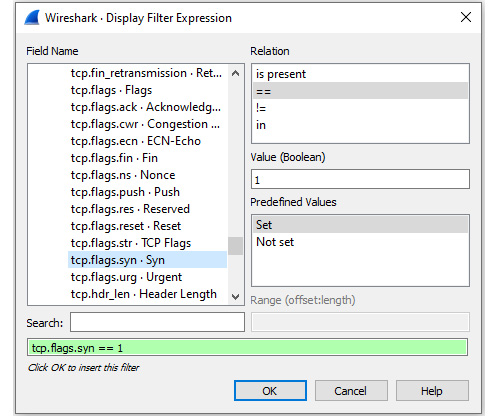
Figure 7.20 – TCP SYN flag filter
At this point, we can select either of the following:
- Cancel: This will exit the expression builder and will not create a filter.
- OK: This will place the filter in the display filter toolbar.
Once the filter is in the display filter toolbar, you can make any necessary modifications, such as changing tcp.flags.syn == 1 to a modified filter such as tcp.flags.syn == 0. Once you are satisfied with the filter, you can run the filter by pressing Enter or clicking the blue arrow on the right-hand side of the display filter.
As you can see, the expression builder is an easy way to go through the process of building a custom filter.
In the next section, we'll see that, while working with a packet capture, Wireshark has many shortcuts that allow you to quickly create a filter to streamline your workflow.
Discovering shortcuts and handy filters
Over the years, Wireshark has evolved. Now more than ever, it's very easy to create a display filter on the fly while analyzing by simply right-clicking and choosing to apply or prepare as filter.
In this section, let's take a look at the many ways in which we can apply a filter, without going through the complicated exercise of launching the expression builder. In addition, we'll see some handy filters that you can use to get right down to the issue. We'll start with an overview of the many shortcuts to use when filtering traffic.
Embracing filter shortcuts
While working with Wireshark in the Packet Details panel, you might want to filter on a specific IP address or a particular port number. Once you identify the item of interest, you can right-click on it and you will see several filter shortcuts, as shown here:
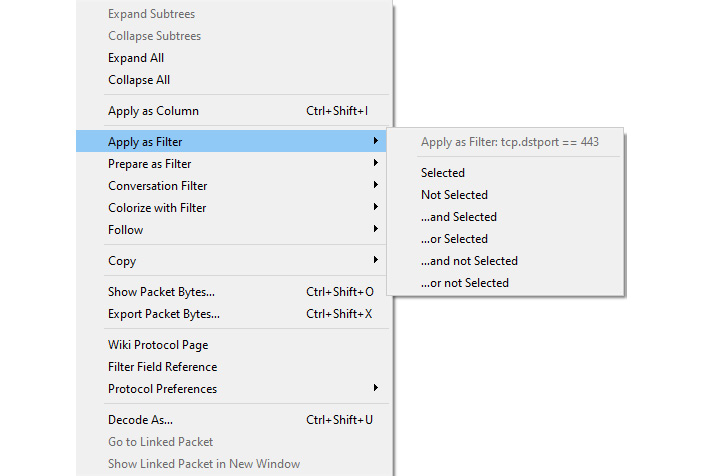
Figure 7.21 – Right-click to view filter shortcuts
Although there are many options when you right-click, in the center you can see the shortcuts that deal with filters. The following options are available:
- Apply as Filter: When selected, it will create and run a selected field value.
- Prepare as Filter: When selected, it will create and place the selected field value in the display filter area, giving you a chance to make any modifications or add to the filter.
- Conversation Filter: When selected, it allows you to follow the conversations according to protocols, such as Ethernet, IPv6, and TCP, as shown in the following screenshot:
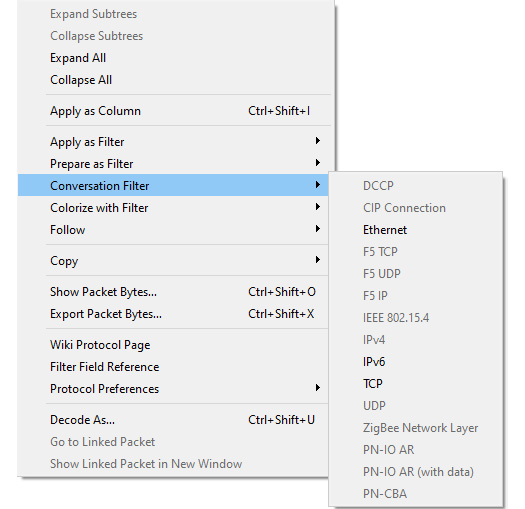
Figure 7.22 – Conversation Filter selections
- Colorize with Filter: This allows you to colorize a specific conversation. As you can see, you can select from the many available colors, or you can create your own coloring rule, as shown in the following screenshot:
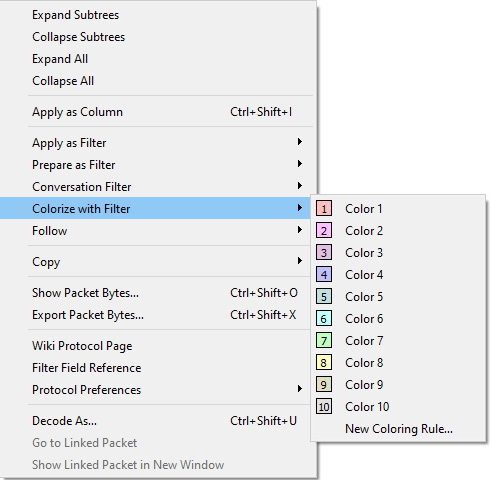
Figure 7.23 – Colorize with Filter
Note
If you have applied a filter to colorize a specific stream and then want to undo your changes, go to View | Colorize Conversation and then select Reset Colorization.
When you right-click on a field value and select either Apply as Filter or Prepare a Filter, you will see additional choices when building a filter. Let's investigate how this works.
Viewing additional choices
Even within the shortcuts, you will find additional methods to filter traffic when using either Apply as Filter or Prepare as Filter. As shown in Figure 7.21, you can right-click to view filter shortcuts. The following list shows how you can select simple filters or add logical operators:
- Selected: Selects the current field value.
- Not Selected: Creates a filter that removes the selected field. For example, if I right-click on destination port 443 and select Not Selected, then Wireshark will generate !(tcp.dstport == 443) and place it in the display filter.
- ...and Selected: Adds a field value to the filter.
- ...or Selected: Creates an OR filter.
- ...and not Selected: Adds a filter that removes the selected field.
- ...or not Selected: Creates an OR filter with a filter that removes the selected field.
Using filters is one of the tools that helps you home in on a problem. The next section provides some suggestions on useful filters that can help you when searching for specific types of traffic.
Applying useful filters
Wireshark is a common tool used by developers, network administrators, students, and security analysts. Network administrators use Wireshark to investigate the many issues that can surface and cause the network to degrade or spread malware.
Once you have worked with Wireshark for any length of time, you'll learn tips and techniques to streamline your workflow. One common task is to apply various display filters.
Using display filters
While you can always build a filter on the fly, it's common to have some handy display filters that include the following:
- http.request: This searches the capture file for any HTTP GET or POST requests.
- tcp.port==xxx: Use this filter if you are monitoring TCP traffic by using a specific port.
- tcp.stream eq X: This filter will follow a specific stream, where X is the stream index.
- !(arp or icmp or dns): This filter will eliminate arp, dns, and icmp traffic.
- vlan.id ==X: This shows a specific vlan.
Wireshark also provides a handy drag-and-drop feature, where you can simply drag a field from the packet tree and drop it into the display filter.
In addition to display filters, there are times when capture filters are used to collect specific traffic.
Using capture filters
As we know, capture filters narrow the scope when capturing traffic. Some practical examples include the following:
- port ftp || port ftp-data: This will capture FTP traffic.
- ip host x.x.x.x: This will capture traffic from a specific host.
- ip multicast: This will capture multicast traffic.
The Wireshark wiki also lists several capture filters that are used to detect malware. For example, dst port 135 and tcp port 135 and ip[2:2]==48 will display evidence of the Blaster worm virus.
Note
Read more about the Blaster worm virus by visiting https://docs.microsoft.com/en-us/troubleshoot/windows-server/security-and-malware/blaster-worm-virus-alert.
There are many ways to filter traffic to only display the traffic you want to see, which helps remove unnecessary traffic and improve your analysis skills. Depending on the type of network you work with on a daily basis, you will most likely build your own arsenal of filters.
Summary
Wireshark is a powerful tool that allows us to capture and analyze traffic. In this chapter, we reviewed how to study a capture more effectively by using the built-in filter functions. We learned how to use a display filter and discussed how it can provide either a simple filter showing only a single protocol, or a combination of field values. We then reviewed how you can edit the display filters, along with how you can create your own and store them for easy reference in the bookmarks.
We then covered how capture filters are applied prior to gathering traffic to display only a specific type of traffic. We also saw how to drill down on a specific field value by building an expression. In addition, we saw that when carrying out a granular investigation, we can create filters that include logical operators and specific field values. With the many ways to filter traffic, we looked at the shortcuts to build filters on the fly while conducting analysis. We then closed by discovering the benefits of having several useful filters in your arsenal.
In the next chapter, we will take a look at the Open Systems Interconnection (OSI) model, an essential concept to grasp in order to be effective at packet analysis. So that you have a better understanding of the OSI model, we'll review each of the seven layers. We'll discuss addressing, the protocol data units, and the protocols in each layer. In addition, we'll step through the process of encapsulation as the data is readied for frame formation in order to be sent via the appropriate media.
Questions
Now, it's time to check your knowledge. Select the best response, then check your answers with those provided in the Assessments appendix:
- When creating a display filter, if the background is ____, then you have entered a valid filter.
- red
- green
- yellow
- cyan
- When creating an expression using the expression builder, you can refine the filter by modifying any of the four variables listed on the right-hand side, which are Relation, _____, Predefined Values, and Range.
- Float
- Integer
- Value
- Boolean
- To create a capture filter to see only DNS requests and responses, you would enter _____ in the capture filter.
- tcp port 53
- DNS
- dns
- udp port 53
- If you need to build a filter to zero in on specific field values, you can use the _____ builder.
- Expression
- Berkeley
- EPAN
- Dissector
- When using either Apply as a Filter or Prepare as Filter, you will see additional choices to create a simple filter or add logical operators. _____ adds a filter that removes the selected field.
- ...or Selected
- ...and Selected
- Not Selected
- ...and not Selected
- In Wireshark, the capture filter uses the _____ syntax.
- Expression
- BPF
- EPAN
- Dissector
- When selecting the shortcut _____, it will create and place the selected field value in the display filter area, giving you a chance to make any modifications or add to the filter.
- Prepare as Filter
- Apply as Filter
- Build a Filter
- Generate a Filter
Further reading
Please refer to the following links for more information:
- Read more about the Berkeley Packet Filter, The BSD Packet Filter: A New Architecture for User-level Packet Capture, which is found at https://www.tcpdump.org/papers/bpf-usenix93.pdf.
- To view a list of handy 802.11 filters, visit https://semfionetworks.com/wp-content/uploads/2021/04/wireshark_802.11_filters_-_reference_sheet.pdf.
- To learn more about wireless filters along with several examples, visit https://tiebing.blogspot.com/2015/02/wireshark-display-filters.html.
- For an extensive list of capture filter examples, go to the Wireshark wiki at https://wiki.wireshark.org/CaptureFilters.
- To find a complete list of built-in field values used in building filters, go to https://www.wireshark.org/docs/dfref/, where you can select a protocol link and learn more about the supported field values.