
Chapter 20: Using CloudShark for Packet Analysis
Although Wireshark is a powerful, versatile tool, there are times when you may need to involve your team in a packet analysis exercise. One site that makes it easy to share your packet captures with co-workers is CloudShark (CS). CS does not have as many features as Wireshark; however, you can still complete a number of functional tasks during an analysis. In this chapter, we'll discover CS, a browser-based solution that offers several of the same benefits as Wireshark.
You'll learn that, in addition to the basic tasks, you can create an account and perform more advanced functions such as uploading and sharing captures. So that you can get the full benefit of CS, we'll step through basic packet capture analysis, such as applying filters to narrow the scope. In addition, we'll learn how to create graphs that provide a visual representation of the data. We'll also explore some of the built-in analysis tools. CS has several tools, which allow us to dissect a Voice over Internet Protocol (VoIP) call, complete a Hypertext Transfer Protocol (HTTP) analysis, and monitor for possible threats. Finally, so that you continue to improve your packet analysis skills, we will take a look at the many online repositories where you can obtain sample captures.
This chapter will address all of this by covering the following topics:
- Discovering CloudShark
- Outlining the various filters and graphs
- Evaluating the different analysis tools
- Locating sample captures
Discovering CloudShark
Most of us would agree that Wireshark is a great tool for troubleshooting, along with identifying malware and other anomalies on a network. However, Wireshark has some limitations in that it must be installed on a local machine to gather traffic, and it can be resource-intensive. In addition, Wireshark is not designed to be used concurrently by multiple people, such as in a team.
CS is a browser-based Software as a Service (SaaS) that provides a way to upload packet captures and share them with co-workers or even the world. You can also do an analysis on the fly, or simply use it as a browser-based solution to learn about protocol behavior.
CS offers the following features:
- Capture Index, where you can store and share captures
- The main interface, where you can apply filters and add notes
- The ability to conduct advanced analysis and threat evaluation
You can find CS at https://www.qacafe.com/analysis-tools/cloudshark/qa-cloudshark-personal-saas/. On the main page, you can either log in or set up a free trial. To get the most out of CS, create a trial account. Once your account is active, you will begin on the welcome page, as shown in the following screenshot:
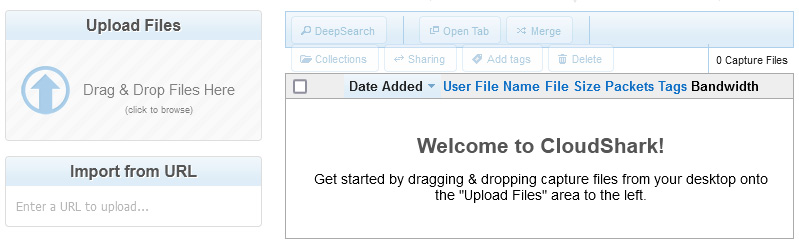
Figure 20.1 – CS welcome page
From the welcome page, you can upload files from your PC or laptop or import them from a Uniform Resource Locator (URL), as shown on the left-hand side of Figure 20.1.
After you have uploaded your files, they will be listed on the right-hand side of the screen. Once you become familiar with the CS interface, you can adjust many aspects of your account, as we'll see next.
Modifying the preferences
In CS, there are several areas that you can customize and fine-tune, such as account information, managing your uploads, creating collections, and enforcing quotas. To get to the Preferences menu, go to the top right-hand side of the screen, where there is a drop-down menu that allows you to modify the following variables:
- Account: Here, you can view the type of subscription information for your account. It also offers the option to start a subscription when you are ready.
- Capture Index: This is where you can customize your column headers. As shown in the following screenshot, you can use the default layout, or remove any of the visible fields. In addition, you can drag Additional Columns from the available options to where you would like them:
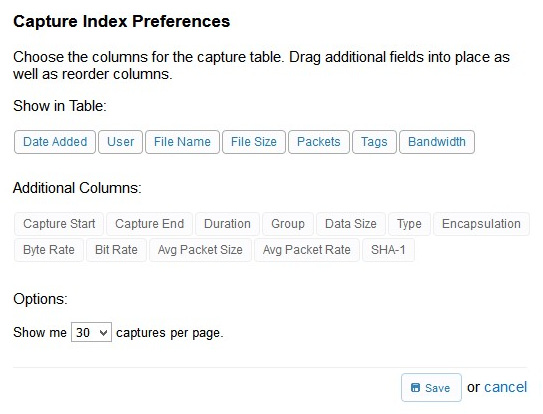
Figure 20.2 – CS Capture Index Preferences
When you are done with your selections, select Save, and CS will rearrange the columns according to your preferences.
- Uploads: CS is designed to be a collaboration tool, so it is assumed you will have interactivity, and other team members will have access to the files you have uploaded. The Uploads preferences is where you tell CS what group you want to assign the files you have uploaded, as shown here:
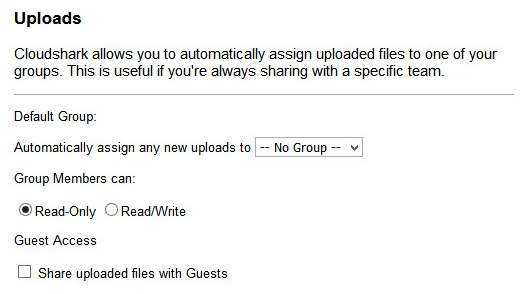
Figure 20.3 – CS Uploads preferences
Once the files are loaded, you can further restrict what group members can do with the files, by selecting either Read-Only or Read/Write. In addition, CS can provide guest access to your uploaded files.
- API Tokens: You may have your own tools that you want to interact with CS. This is where you can find the Application Programming Interface (API) token so that CS can interact with your software.
- Usage Quotas: Packet captures can consume a great deal of storage. This preference menu choice will list how much storage you have used out of your allocation (the trial provides 2 gigabytes (GB) of storage), along with how many uploads you have completed out of your allocation (the trial provides a limit of 500 files). If you are in danger of exceeding the limit, there is a link to upgrade.
- Collections: To organize your captures, you can create collections where you can house similar captures together. Once created, a collection will appear on a separate landing page, as shown in the following screenshot:
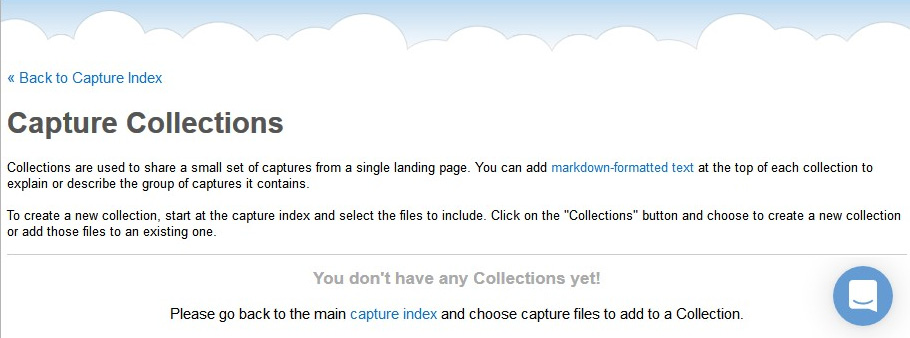
Figure 20.4 – CS capture collections
After modifying your preferences, you're ready to upload your captures, to share with your team or the world, as discussed next.
Uploading captures
To upload and share your captures, go to the left-hand side of the CS welcome page, as shown in Figure 20.1. You can either drag them from your file manager and drop them in the Upload Files area, or you can click and browse to a file location. Once a file is uploaded, CS will display a summary, as shown here:
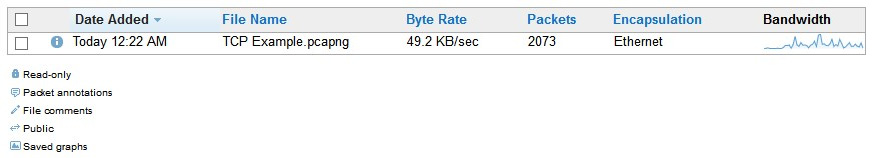
Figure 20.5 – File upload summary
After uploading your files, click Done to return to the Capture Index main menu, which will display a list of the files in your repository. Once there, select the check mark to the left of a file and the menu choices along the top will become active, as shown in the following screenshot:
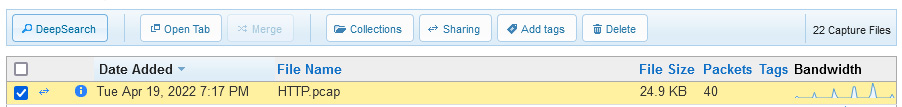
Figure 20.6 – File selected
The menu choices will allow you to complete several tasks with each file. Let's explore this concept next.
Working with capture files
CS has several menu choices. For example, you can conduct a DeepSearch capture, which will allow you to search specific fields within a capture. In addition, you can also search using an Index Filter, found on the lower left-hand side of the Capture Index feature, as shown here:
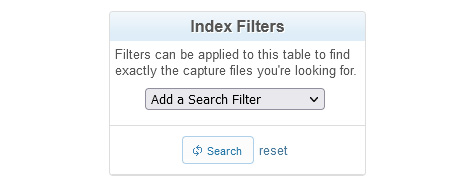
Figure 20.7 – Index Filters
To launch a search, click on the drop-down menu and select an option, as shown in the following screenshot:
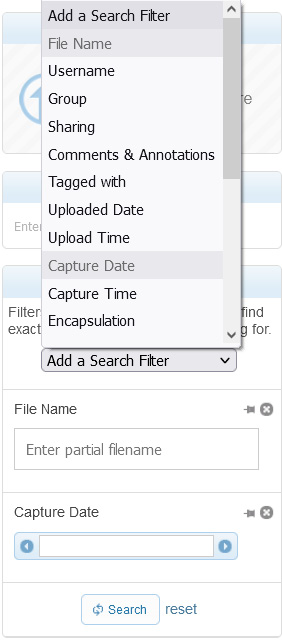
Figure 20.8 – Using an index filter
Once you have selected an option, CS will generate a form below where you can fill in the requested variables.
You can improve the searching process by using the Add Tags feature to a file, to help identify the contents. For example, if you have a capture obtained from Building 4: East Hall, you can add a tag, as follows:
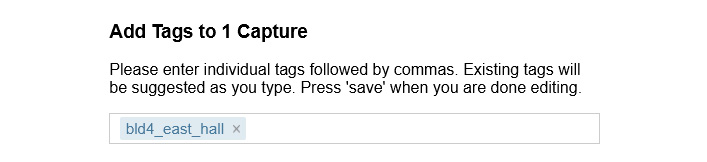
Figure 20.9 – Adding a tag to a file
Over time, there may be many files in your repository. Adding tags helps you narrow your search.
When you are done with a file, you can select the Delete menu choice, which will permanently remove the file(s).
Next, we'll explore other tasks that you can do with your captures, including setting sharing permissions and adding to your collections.
Sharing captures in CS
CS provides a way to securely share your captures and allow packet analysis from a wide array of devices. When you want to share a file, select Sharing, which will open a window as shown here:
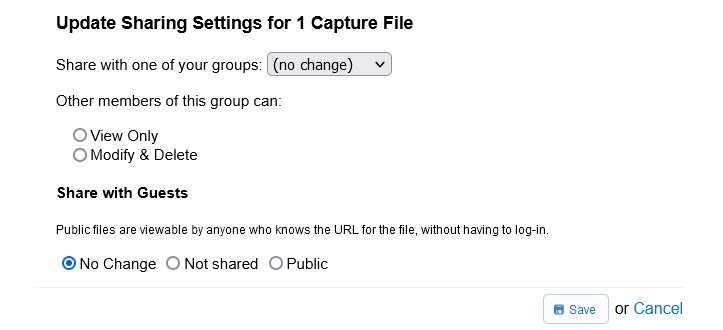
Figure 20.10 – Updating sharing settings
You can share with one of your groups and define what they can do once they access the file using either View Only or Modify & Delete. You can also set Share with Guests to one of the following options: No Change, Not shared, or Public.
In addition to sharing, you can also create capture collections to group and organize similar captures together.
Adding to a collection
Collections are like a folder and provide a handy way to organize similar types of files. To add a file to a collection, select the Collections button. If you do not have any collections, you can create a new collection from the drop-down menu, as shown here:
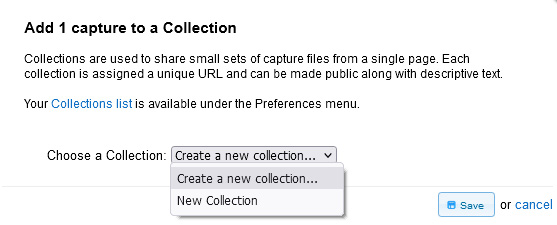
Figure 20.11 – Adding a file to a collection
To begin, drop down the menu choice, select Create a new collection…, and then select Save. This will then open a form where you can enter a name for your collection. In my example, I used the name Basic Analysis. After the name, you can provide a brief description, as shown in the following screenshot:
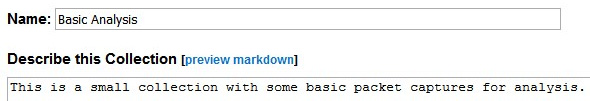
Figure 20.12 – New collection
Below the form is where you can set the access privileges to either Private or Public. In addition, you can select individual file permissions, as shown in the following screenshot:
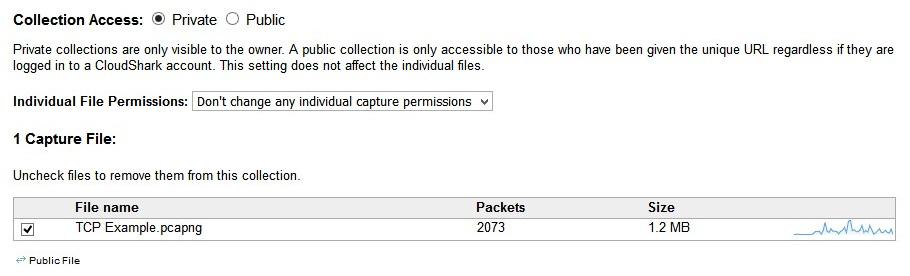
Figure 20.13 – Collection access
When done, select Save to return to Capture Index. Once at Capture Index, you can select a file and either double-click or select the Open Tab menu choice to open the file in the analysis window.
After you create an account, CS provides a way to customize the interface for you and your team. In the next section, we'll discover how to create a custom profile to personalize your workflow.
Creating a profile
Once in CS, you'll find an interface that looks similar to the Wireshark interface. CS is flexible in that you can make some modifications. To show you some of the features, we'll use the HTTP.cap file, located at https://www.cloudshark.org/captures/0012f52602a3.
After you open the file, you can adjust the interface. For example, to give you more room, you can move the packet bytes window to the right so that you can expand the protocol trees, as shown in this screenshot:
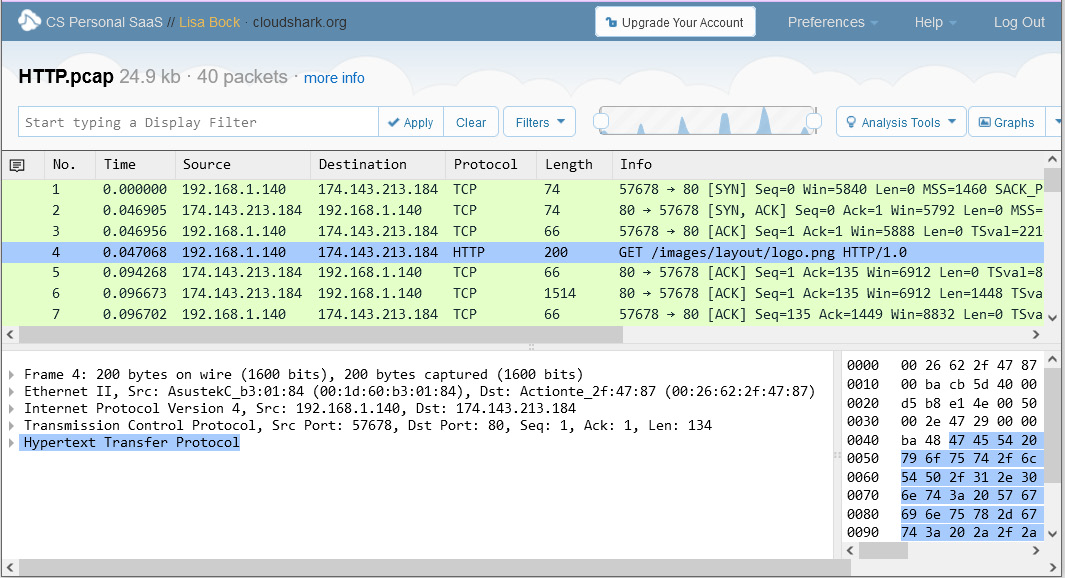
Figure 20.14 – Modified interface
In addition, you can make modifications to customize your workflow by creating a unique profile. Select the Profiles drop-down menu choice, and then select New Profile, which will launch the following window:
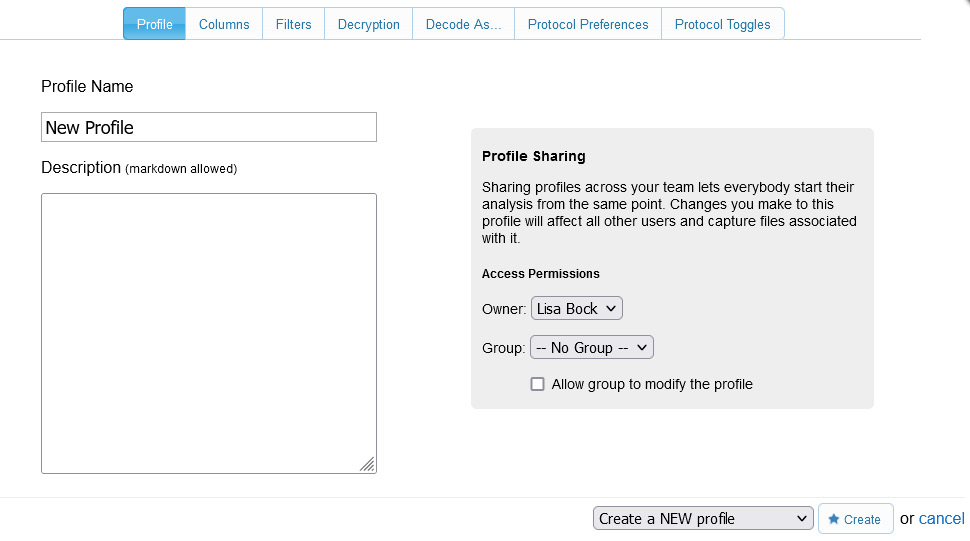
Figure 20.15 – Creating a new profile
Within the interface, you can select one of the tabs that include Columns, Filters, and Protocol Preferences to create your custom profile.
Now that your capture is open and you have modified and customized the interface, you are ready for your analysis. In the next section, we'll evaluate the choices for filtering and graphing traffic.
Outlining the various filters and graphs
Within CS, there are several ways to view your captures. Filters narrow a capture to display only the traffic you want to see, and graphs provide a visual representation of the data.
One common task is to apply a display filter. CS's easy-to-use interface provides a way to narrow your scope. Let's learn more about this in the next section.
Displaying data using filters
Display filters in CS are comparable to the way Wireshark filters data. Filters can be applied to identify packets with specific ports, IP addresses, or protocols by entering a filter in the upper left-hand side of the interface. After you enter a filter, select Apply to run the filter.
In the following screenshot, I used the http filter, which narrowed the capture to show only HTTP traffic:
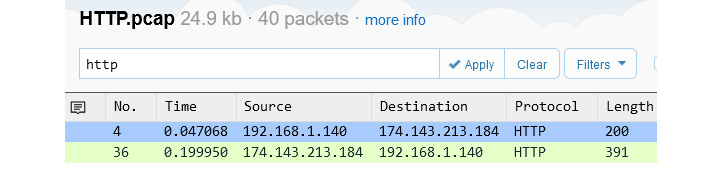
Figure 20.16 – HTTP traffic
When using display filters, the syntax must be correct, or you will see an error. For example, the TCP filter (using capital letters) does not use the correct syntax and will generate an error, as shown here:
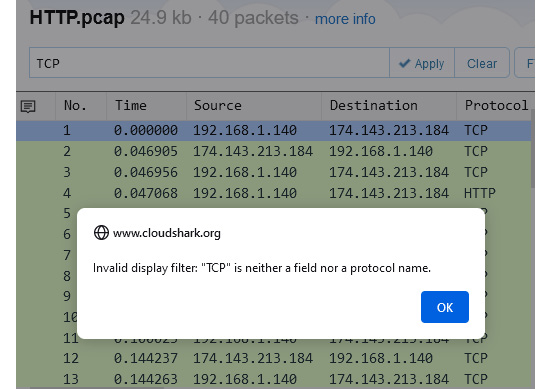
Figure 20.17 – Syntax error
To effectively run this filter, you must enter tcp (using lowercase letters), which is similar to the way Wireshark uses filters.
In addition to the standard filters, you can also create a search by string or hexadecimal (hex) values, as outlined in the following examples:
- To look for a specific image, enter frame contains "adc_pet_dog_336x280" and use quotes around the string value.
- To search for a specific media access control (MAC) address, use frame contains 28:e3:47:8c:02:60.
CS will then search and present the results, if any.
Filters help to narrow the scope. Now, let's take a look at the various graphs you can quickly apply while in CS to help visually represent the data.
Viewing data using graphs
Once in your capture, you may want to create a graph of either all traffic or of the filtered capture. In the upper right-hand corner, there is a drop-down Graphs menu, as shown here:

Figure 20.18 – CS Graphs menu
After you select the type of graph you would like, CS will display the graph. If you would like more interactivity, select Open in new window and then select Open in Editor, found in the upper right-hand corner, as shown in the following screenshot:

Figure 20.19 – Open In Editor option
This will open a window that displays the graph, as shown:
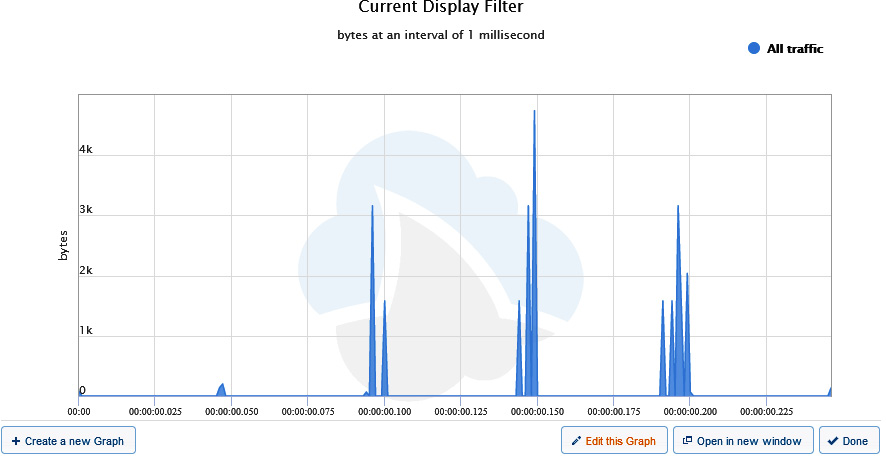
Figure 20.20 – Viewing a CS graph
Along the bottom right-hand side of the graph, select Edit this Graph, which will open a new window, as shown here:
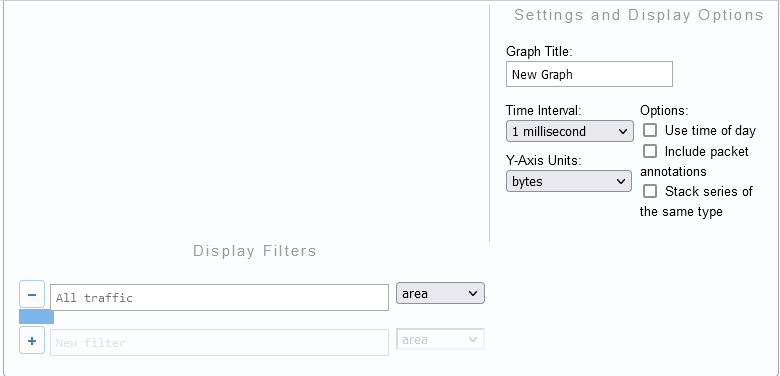
Figure 20.21 – Editing options in a CS graph
Once there, you can add or modify the following options:
- Graph Title: Add a title that is reflective of what the graph represents.
- Time Interval: Set in milliseconds, seconds, or minimum.
- Y-Axis Units: Set by packets, bytes, value, or by packets, bytes, or bits/second.
- Options: To further customize the chart, you can add additional variables that include the following:
- Use time of day
- Include packet annotations
- Stack series of the same type
- Display Filters: This is where you would enter a display filter. You can also select a style for how you want the data to be represented, such as line, column, or spline.
Once you have completed the graph, you can either print the graph or export it as an image in one of the following formats:
- Portable Network Graphics (PNG)
- Joint Photographic Experts Group (JPEG)
- Scalable Vector Graphics (SVG)
In addition to graphs and filters, there are times when you need to perform more advanced analysis. The next section provides an overview of a variety of tools for quickly examining data.
Evaluating the different analysis tools
CS offers a solution to share packet captures with your team. Several analysis tools are available via a web interface. In addition to the graphs in CS, there are many other built-in analysis tools. The drop-down menu for the Analysis Tools is located in the upper right-hand part of the screen, where you will find various menu choices, as shown here:
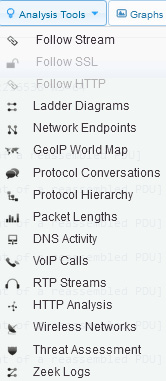
Figure 20.22 – Viewing analysis tools
If any of the options are dimmed, such as Follow SSL and Follow HTTP, as shown in Figure 20.22, that means the tool is not applicable to the current capture.
From the top of the list, you will find many tools to use in your analysis. Let's begin with viewing conversations, ladder diagrams, and filtering the stream.
Following the stream and viewing conversations
Within Wireshark, we have many tools under the Statistics menu that help us make sense of a packet capture. While CS doesn't have as many features, you'll see that you can do a preliminary evaluation on the fly with the built-in analysis tools.
The following list outlines the first few selections in the Analysis Tools menu choice:
- Follow Stream, Follow SSL, and Follow HTTP: Similar to the Follow the Stream function in Wireshark, these provide a way to see the details of a single conversation between two endpoints.
- Ladder Diagrams: These are similar to flow graphs in Wireshark, showing endpoints communicating back and forth, as illustrated in the following screenshot:

Figure 20.23 – Ladder diagram
- Network Endpoints: This will provide a list of endpoints. While in the window, you can filter by the type of endpoint you would like to see, such as eth, ipv4, ipv6, tcp, or udp, as shown in the following screenshot:
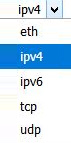
Figure 20.24 – Endpoints
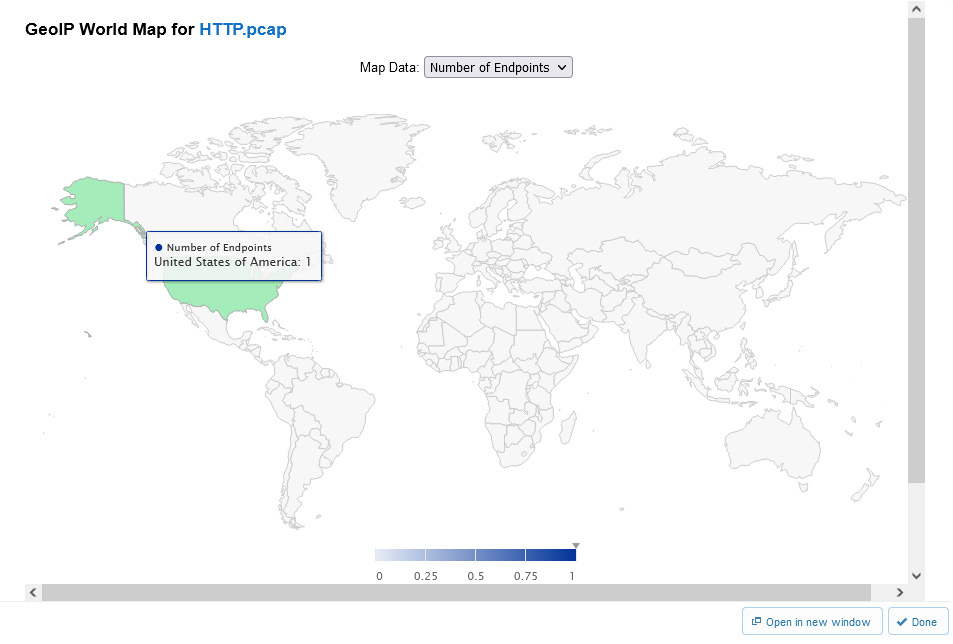
Figure 20.25 – GeoIP World Map
- Protocol Conversations: This will provide a list of conversations, similar to Wireshark. While in the window, you can filter by the type of conversation you would like to see, such as eth, ipv4, ipv6, tcp, or udp.
CS is populated with many tools that you can use to analyze data. The next section shows how we can take a look at the details of a VoIP call, graph packet lengths, and Domain Name System (DNS) activity.
Viewing packet lengths and VoIP activity
Some of the analysis tools may not make sense when you look at them; however, they do provide value while troubleshooting, so it's worth running a few of the graphs to see the results.
The next grouping of analysis tools includes the following options:
- Packet Lengths: This provides an interactive graph of packet lengths and other information such as Average, Min, Max, and Rate, as shown in the following screenshot:
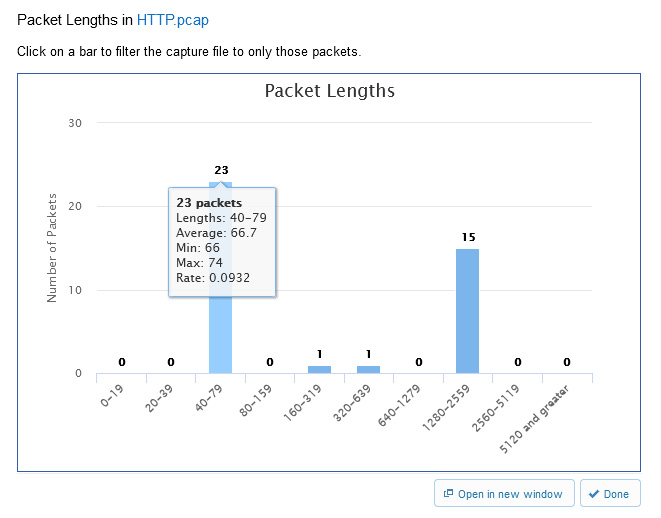
Figure 20.26 – Packet Lengths
- DNS Activity: This provides a count of DNS queries, responses, and Resource Record (RR) types.
- VoIP Calls: This provides a list of any VoIP calls found in the file. In addition, there is also a sortable summary of the following elements: Call, Start Time, Stop Time, Initial Speaker, From, To, Protocol, and Packets, as shown here:
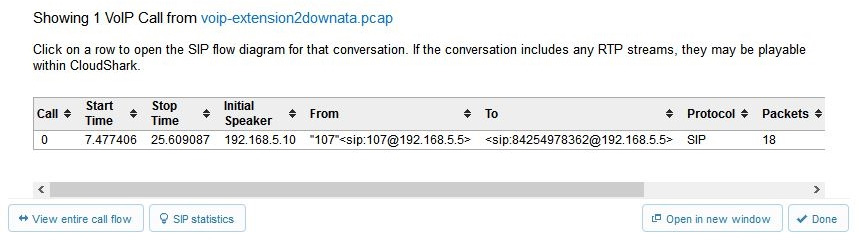
Figure 20.27 – CS VoIP calls
Another grouping of tools can dissect HTTP traffic and help identify wireless network issues.
Exploring HTTP analysis and wireless traffic
When either troubleshooting HTTP or wireless networks, CS analysis tools include the following options:
- HTTP Analysis: This will list all URLs requested in the capture file, along with a count of the requests.
- Wireless Networks: This provides a list of any wireless networks found in the file, along with a sortable summary of the following: basic service set identifier (BSSID), SSID, vendor, Signal_dBm, channel, and security.
CS has many tools that are similar to those found in Wireshark. However, this last grouping offers the unique ability to quickly assess a packet capture for potential malicious activity.
Monitoring possible threats
CS has two tools that allow you to determine if there is any suspicious activity within the capture, as follows:
- Threat Assessments: This is a more advanced option that will scan the capture for potentially malicious traffic within the file. If none is found, the report will come back with the notification: all clear!
- Zeek Logs: Zeek is an open source network analyzer used to monitor traffic for unusual or suspicious activity.
These tools will aid the analyst when assessing threats on the network. To see an example of a capture that contains malicious activity, go to https://www.cloudshark.org/captures/f35aa6fcd160. Select Analysis Tools | Threat Assessment, and CS will display the following output:
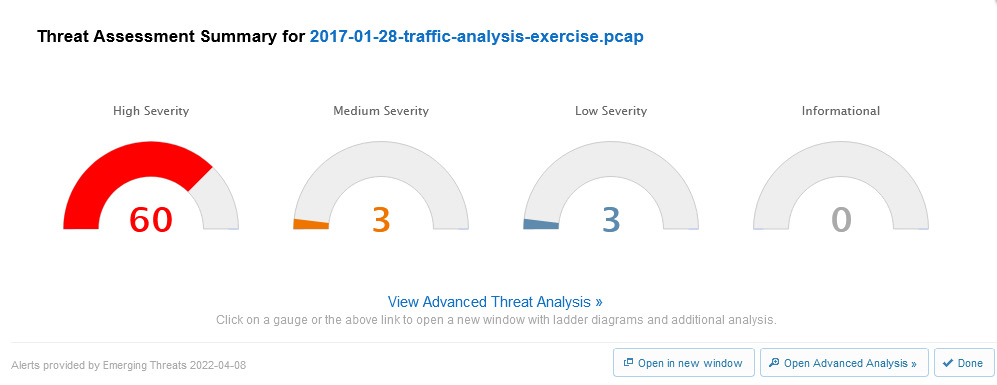
Figure 20.28 – Viewing a threat assessment report
By running a quick report, you can immediately see that there is a High Severity threat assessment level. Select View Advanced Threat Analysis, found in the middle of the screen, which will open another window, as shown here:
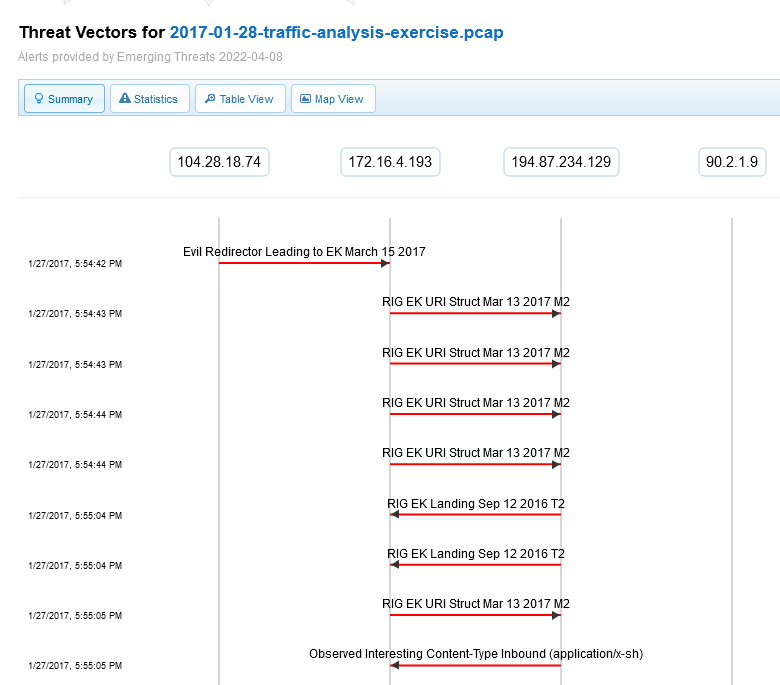
Figure 20.29 – Examining the advanced threat analysis
In addition, you can run a report on Zeek Logs found within the capture. Select Analysis Tools | Zeek Logs, and CS will bring up a summary of the log information found in the file, as shown here:
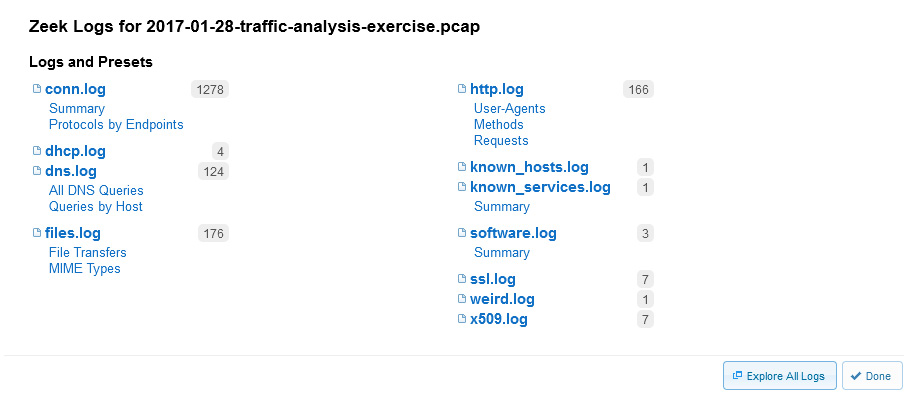
Figure 20.30 – Zeek Logs
Once in the summary, you can select Explore All Logs, as shown in the lower right-hand corner of Figure 20.30, to discover more details.
Now that you have seen the many ways in which you can analyze data using CS, let's take a look at where you can get packet captures to strengthen your analysis skills.
Locating sample captures
While learning about packet analysis, it's important to study a variety of captures until you are proficient at knowing what to look for in a file. This may take a while, but it will be well worth the effort.
First, let's see how PacketLife.net provides a handy way to open and examine a packet capture, right in CS.
Examining captures
When working with packet captures, you may want to learn about an unfamiliar protocol with your team. Today there are many places to obtain packet captures; one site I visit often is https://packetlife.net/.
Once at PacketLife.net, navigate to http://packetlife.net/captures/, where you can search for captures. For example, I found snmp-ipv4.pcap, as shown in the following screenshot:
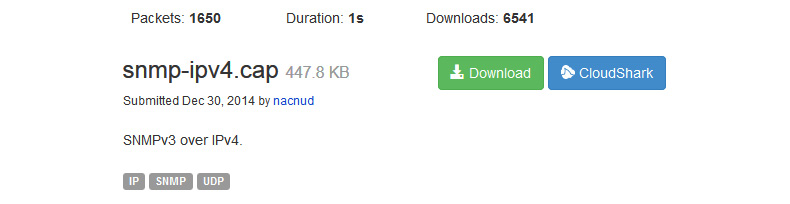
Figure 20.31 – Packet capture found at PacketLife.net
After you have found a packet capture, you can open it directly in CS, as shown here:
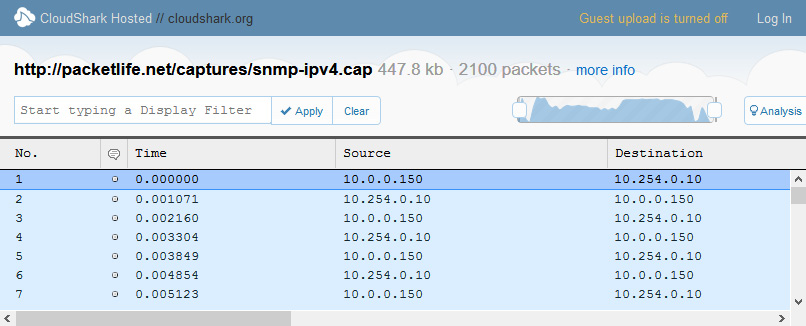
Figure 20.32 – Packet capture opened in CS
While in CS, you can use a variety of built-in tools to study the capture, or you can download the file and open it in Wireshark, for better visualization or a more advanced analysis of the data.
To continue with building your skills in packet analysis, I have listed a few more sites where you can find a variety of captures.
Finding more captures
Here are a few websites that can give you a variety of real network traffic:
- To see a general list of unsorted packet captures, visit https://wiki.wireshark.org/SampleCaptures.
- For a small sampling of captures that are ideal for training purposes, visit http://tcpreplay.appneta.com/wiki/captures.html.
- NETRESEC, located at https://www.netresec.com/?page=PcapFiles, has a nice sampling of public repositories and their respective URLs.
- Chris Sanders is an author who has several capture files available on his GitHub page. Learn more here: https://chrissanders.org/packet-captures/.
This is only a partial list of where you can get samples to hone your skills. As you become more involved in analyzing traffic, you will most likely find many more online repositories with sample captures. Visit them, download the captures, and continue to improve your packet analysis skills.
Summary
In this chapter, we took a look at CS, a tool that allows you to view and analyze packet captures in a browser. We learned some of the ways CS provides the ability to examine captures, many of which are similar to Wireshark. We started by discovering CS and learned ways to modify the preferences, work with captures, and create customized profiles. We then evaluated ways to filter a capture to show only a specific type of traffic, as well as creating a variety of graphs.
In addition, we learned that CS has a rich variety of analysis tools. Tools include Follow Stream, Network Endpoints, GeoIP World Map, Packet Lengths, DNS Activity, VoIP Calls, and Wireless Networks, with methods to assess threats. We discovered that, in general, there are many resources for packet captures that you can visit and download a capture file to study and improve your packet analysis skills. We then took a look at PacketLife.net, which has an online repository of capture files for download, or an option to open them and analyze them in CS. Finally, we reviewed a few of the locations you can search for packet captures, to further your skills in packet analysis with Wireshark.
Questions
Now, it's time to check your knowledge. Select the best response to the following questions and then check your answers, which can be found in the Assessment appendix:
- In Preferences, _____ is where you can customize your column headers. You can use the default layout, remove any of the visible fields as shown, or drag additional columns to where you would like them.
- Account
- Uploads
- Decode Window
- Capture Index
- In addition to the standard filters, you can also search for a specific image by using a _____ value.
- Decode
- String
- Hex
- Craft
- _____ are similar to flow graphs in Wireshark, which show endpoints communicating back and forth.
- Ladder diagrams
- Step charts
- VoIP ladders
- Time intervals
- At the bottom right of a Network Endpoints report, you will see a button to select _____, which will visually show from where packets originate.
- Step Charts
- Craft
- Time Interval
- GeoIP World Map
- In CS, a _____ is a more advanced option that will scan a capture for potentially malicious traffic within the capture.
- Malicious conversation
- Malicious endpoint
- Threat assessment
- Threat map
- Built within the CS analysis tools is _____, which is an open source network analyzer used to monitor traffic for unusual or suspicious activity.
- HTTP Analysis
- Step Charts
- Zeek
- Decode.io
- In CS, you can make modifications to customize your workflow by creating a unique _____.
- Profile
- Step chart
- Threat map
- Decode window
Further reading
Refer to the following links for more information:
- Visit https://www.qacafe.com/support/cloudshark/user-guide/capture-file-index/#searching-the-capture-file-index to learn more about running a DeepSearch on a capture file.
- For the original malware analysis file, visit https://www.malware-traffic-analysis.net/2017/01/28/index.html. Once there, you will find more information on this packet capture of a Windows host infected with malware.