
Chapter 6: Personalizing the Interface
Everyone likes to arrange their desks in their own way. Working with Wireshark is no different, as you can personalize the settings to suit your needs. In this chapter, we'll dive into the Wireshark interface and look at ways to enhance the appearance and layout, as well as create custom configuration profiles. You'll gain a better appreciation of how you can design the interface to meet your specifications and evaluate ways to manipulate columns, change the font, and fine-tune color choices.
So that you get a better understanding of how to document capture information in Wireshark, we'll review tips on how to add comments. You'll discover how to comment on a single packet or an entire capture. Finally, we'll step through the process of building and modifying a complex filter during packet analysis. We'll finish by learning how to create a button on the toolbar as a shortcut for commonly used filters in Wireshark.
This chapter will cover the following:
- Personalizing the layout
- Creating a tailored configuration profile
- Adjusting columns, font, and color
- Adding comments
Personalizing the layout
Although Wireshark is functional in default mode, it's easy to modify appearance and layout to optimize your workflow. In addition to personalizing layout and general appearance, you can modify many other components. For example, you can change the language, customize the number of icons, recent filters, and folders, and define what you want to appear in the status bar. Let's start with how you can customize the appearance.
Altering the appearance
In Wireshark, you can tailor the general appearance in the following ways:
- Identify the default location to open files.
- List how many display filters to show.
- Define how you want the main toolbar to appear.
To view all the choices where you can make and modify your selections, go to Edit and then Preferences, which will bring up a dialog box. Once there, expand Appearance, as shown in the following screenshot:

Figure 6.1 – The Wireshark Preferences dialog box – Appearance
At the top of the dialog box, we can see the Remember main window size and placement option. If selected, this will retain the window size and placement after you shut down Wireshark. To see how this works, do the following:
- Reduce the main window to one-quarter size, position the app on the top left-hand side of your screen, and then select File | Quit.
- Launch Wireshark, and the window will appear in the same location and size.
The next selection, Open files in, allows you to point to a location when accessing files. Here, you will find two choices:
- The most recently used folder is the default. This option will save files in the last folder you used.
- This folder will allow you to choose another folder when saving files. To modify, select Browse... and then drill down to the location of a specific folder.
Show up to allows you to modify how many files or filters are preserved. The choices are outlined as follows:
- filter entries will indicate how many capture filter entries to display.
- recent files will indicate how many recent files to keep visible when you go to File | Open Recent.
When working with captures, Wireshark can help remind you to save your file by selecting Confirm unsaved capture files. If checked, Wireshark will display a prompt before closing the app, starting a new capture, or opening another file, as shown here:

Figure 6.2 – A prompt before closing
The next option, Main toolbar style, will allow you to alter the appearance of the main toolbar, which is across the top, underneath the menu choices. You can choose to display as Icons only, Text only, as well as Icons & Text, as shown here:

Figure 6.3 – Main toolbar – Icons and text
The next selections will enable you to modify how the title across the top of the screen appears. The choices include the following:
- Window title: This option will allow you to append a label at the end of the title and includes options such as %F (file path) and %P (profile).
- Prepend window title: This option will allow you to insert a label at the beginning of the title.
I have included both options, so the title appears as [Lisa WS]dhcp.cap[Lisa], as shown in Figure 6.3.
Note
For Window title, I used the %P (profile) selection.
The last option is Language. When using Wireshark, the default is Use system setting when displaying capture information. However, the developers have added a powerful feature – the ability to select from a variety of languages, including Chinese, English, French, German, Italian, Japanese, and Polish.
Now that we have set up our workspace, let's evaluate ways to modify the layout.
Changing the layout
As covered in the Exploring the View menu section in Chapter 4, Exploring the Wireshark Interface, you can select which of the panels you want to appear, as follows:
- Packet List
- Packet Details
- Packet Bytes
- Packet Diagram
Once you launch Wireshark, the default setting is the three panes – Packet List, Packet Details, and Packet Bytes stacked one above the other.
However, it's easy to rearrange the layout in one of six other layouts. To make changes to the layout, go to Edit | Preferences, which will bring up a dialog box. Once there, expand Appearance, and then select Layout, as shown here:

Figure 6.4 – The Wireshark Preferences dialog box – Layout
For example, if you have selected the settings shown in the preceding screenshot, your layout will appear as follows:
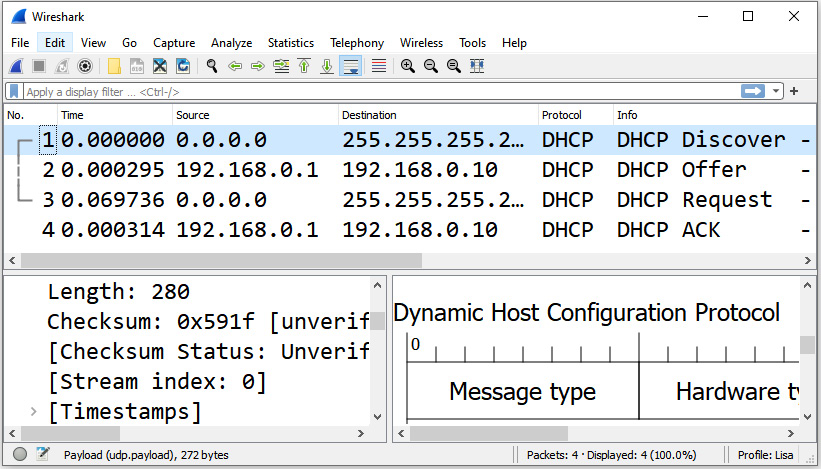
Figure 6.5 – Wireshark with a modified layout
In addition, you have choices to modify additional selections, for either the packet list or status bar settings. Let's start with how we can enhance the view of the packet list settings.
Adjusting the packet list settings
Within this section, Wireshark provides additional options to visualize the packet list.
The Show packet separator option will insert a fine white line in between each frame in the packet list.
If you select Show column definition in column context menu, when you right-click on any of the column headers, Wireshark will describe each of the column values, as shown here:
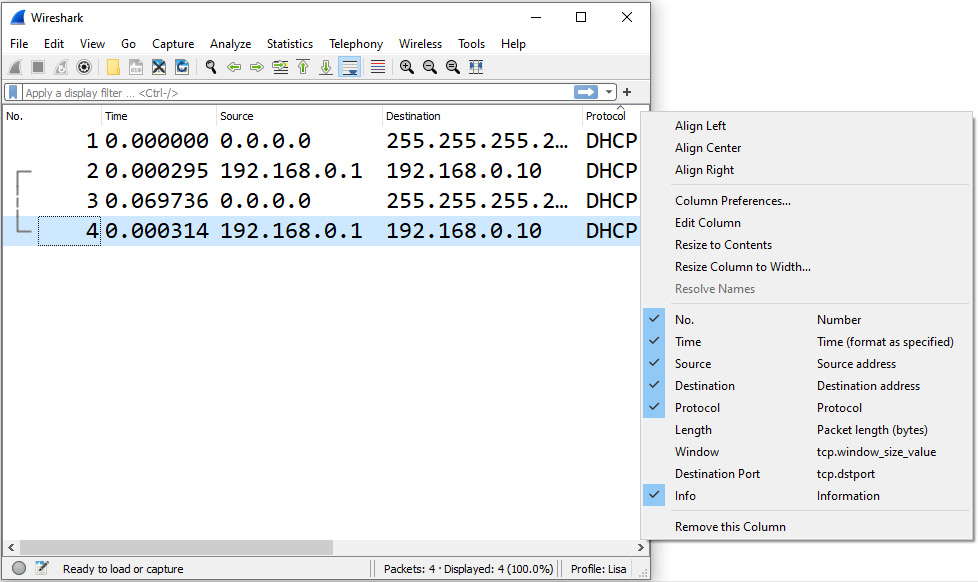
Figure 6.6 – Show column definition in column context menu
When you select Enable mouse-over colorization, this will highlight the selected packet in a light blue color, as shown in frame 4 in the preceding screenshot.
In addition, we can modify the status bar, which is found at the bottom of the Wireshark interface.
Adding status bar settings
Here, you can choose to select Show selected packet number and Show file load time.
Once selected, this information will be displayed in the lower-right-hand corner of the status bar, as shown here:

Figure 6.7 – The status bar
The last option, Restore Defaults, will reset any options that you have selected to the default state.
Next, we'll examine ways to generate a custom configuration profile to provide a unique set of settings that are specific to our needs.
Creating a tailored configuration profile
A configuration profile is a set of preferences and configurations. Once you launch Wireshark, at the lower right-hand corner of the interface, you will see Profile: Default, as shown in Figure 6.7.
In Wireshark, users can create their own custom configuration profiles, which can include personalized preferences, coloring rules, font styles, and buttons.
To create a custom profile, go to Edit | Configuration Profiles. Once the dialog box is open, you will see that Wireshark has a default configuration called Default. In addition, you will see three Global configurations, Bluetooth, Classic, and No Reassembly, as shown in italics in the following screenshot:
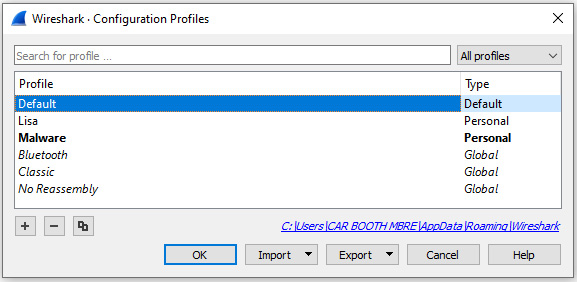
Figure 6.8 – The Configuration Profiles dialog box
In addition, I have created two personal profiles, Lisa and Malware. In the next section, we'll see how easy it is to create a new profile.
Customizing a profile
Once you have determined that it will be beneficial to create a custom profile, you can begin the process by going to Edit | Configuration Profiles. Once there, select the + sign and assign the profile a name. For example, I created a profile named Malware, as shown in Figure 6.8. Once you add the profile, close the dialog box, and then you can modify the profile.
You can make several changes to suit your needs, such as the following:
- Modify the layout by going to View and unchecking Packet Bytes.
- Go to Edit | Preferences and make changes such as font color and size, or even disable or change some of the column headers.
Once done, Wireshark will save any changes in the custom profile.
In my Malware profile, I wanted to modify the settings so that I can hunt for an Ettercap signature. Ettercap is a tool that is used to launch man-in-the-middle attacks on a LAN. I want to be able to quickly identify the e77e Ettercap signature, which identifies Ettercap as it searches for other poisoners on a LAN.
Note
The Ettercap signature e77e translates to ette (short for Ettercap) in leetspeak. You can check this by visiting https://www.dcode.fr/leet-speak-1337.
To customize my profile, I adjusted the columns and removed the Packet Bytes lower panel. Finally, I added an ette button (which we'll learn how to create in the Crafting buttons section). Once selected, the button will apply and run the icmp.ident == 0xe77e display filter.
The results are shown in the top right-hand corner of the following screenshot:

Figure 6.9 – The Malware profile
Using my Malware profile, I can easily check for Ettercap poisoners by hitting my button, which will then show any packets in the capture that have that signature.
If you want to change the profile, click on the lower right-hand corner and select the profile you want to use, as shown in the following screenshot:
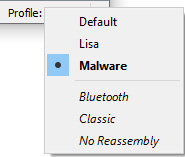
Figure 6.10 – Modifying the profile
In addition, if you want to manage the profiles, right-click on the Profile label. Wireshark will bring up a dialog box, where you can then select Manage Profiles…, as shown in the following screenshot:
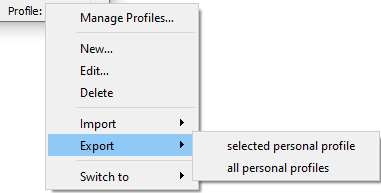
Figure 6.11 – Manage Profiles
Along with being able to manage and modify the profiles, Wireshark allows you to import and export profiles, so you can easily share them with your team. Simply right-click on either choice to make your selection.
You can import profile(s) from the following:
- from zip file
- from directory
You can export the following profile(s):
- selected personal profile
- all personal profiles
Many times while conducting packet analysis, there is a need to refine our view by filtering traffic. If you have created a filter that you find you will need to run often, then you can create a handy toolbar button, as outlined in the next section.
Crafting buttons
A display filter allows you to show only specific traffic. Many times, we'll use a simple filter, such as a dns (Domain Name System) or http (Hypertext Transfer Protocol). However, there are times where you may need to create a more complex filter, such as when comparing a specific protocol field against a value using logical operators.
While working with Wireshark, you may have created a complex filter by using shortcuts.
Note
We'll learn more about shortcuts in the Discovering shortcuts and handy filters section in Chapter 7, Using Display and Capture Filters.
For example, you created a display filter to show only the Transmission Control Protocol Synchronization (TCP SYN) flag and not the Acknowledgement (ACK) flag:
(tcp.flags.syn == 1 ) && !(tcp.flags.ack == 1)
Once you have created an expression and it is visible in the display filter, you can effortlessly create a button. In the right-hand corner, right after the Display Filter, hit the + (plus) sign, and Wireshark will display a drop-down dialog box, as shown in the following screenshot:

Figure 6.12 – Creating a filter button
Once the dialog box is open, you can enter an appropriate label and add a comment for the filter button. Wireshark will automatically enter the display filter for the button to run when clicked. When done, select OK, and the new button will appear on the toolbar.
After working with Wireshark and adding buttons, you may want to remove some to clean up the toolbar. The following list shows the steps to edit filter buttons:
- Go to Edit and then Preferences, where you will see Filter Buttons, as shown in the following screenshot:

Figure 6.13 – The Wireshark Preferences dialog box – Filter Buttons
When selected, you will see whatever buttons are currently on your toolbar.
- To add a filter button, select the + (plus) sign in the lower left-hand corner. Add what you want for Button Label, which is not case-sensitive.
- Next, add a Filter Expression option, which must adhere to the expression and display filter rules.
If you want to remove any filter buttons, highlight the button you want to remove and select the – (minus) sign in the lower left-hand corner.
You can now see the power of creating a customized profile to personalize your workspace. Now, let's investigate how you can add or remove columns, and adjust font and color to suit your needs.
Adjusting columns, font, and colors
While working with a packet capture, most users are comfortable with the default settings used in the interface. However, you can adjust font styles and size to personalize the look and feel of your workspace. In addition, you can also modify the colors that Wireshark uses for the various packet identifiers and display filters.
Once you are in the interface, you will see the column headers that are along the top of the screen. While you are working on a capture, you might not ever manipulate the columns. However, you can add, delete, align, and customize the columns at any time.
Wireshark makes it easy to add and modify columns, as we'll see in the next section.
Adding, editing, and deleting columns
In Wireshark, you can do more than simply expand or shrink the column headers while in the interface.
To improve how you visualize columns, go to Edit | Preferences, and then Columns, as shown in the following screenshot:

Figure 6.14 – The Wireshark Preferences dialog box – Columns
Once selected, you will see a list of columns. Some are present by default, and others are ones you may have added. You can select the checkbox to make the column visible, as well as add or remove columns.
Along the top of the dialog box, you will see the following selections:
- Displayed: When checked, the selected column will be displayed on the interface.
- Title: This is the name of the column header. Wireshark will automatically create a name if you right-click and add a column. However, you can change the title name to personalize the header.
- Type: This lists the type of value that is in the column. Within the drop-down menu, there are many pre-loaded choices, as shown in Figure 6.14, where I have dropped down the Type selection for the IP Nested ICMP header.
- Fields: This identifies the field where the column value originated from. In the preceding screenshot, there is a column header called IP Nested ICMP. In the Fields column, we can see ip.id (Internet Protocol Identification). That is because the column header was generated by right-clicking on the Identification (ID ) field in an IP header and selecting Apply as Column. Wireshark populated the value as ip.id and created a custom column type.
- Field Occurrence: This is only used on a custom column definition. In Figure 6.14, you can see that there are values of 1 and 2 in the Field Occurrence column. When selected, the column headers will appear in this order:
- IP Main ICMP will appear first.
- IP Nested ICMP will appear second.
To add a column, select the + (plus) sign. Identify the title by typing in an appropriate label where it says New Column, and then identify the type by using the drop-down menu and selecting a type. You can also remove any unwanted columns by highlighting the column and hitting the - (minus) sign.
In addition, once in the interface, you can align the columns by right-clicking and selecting the way you want your columns to align, either left, center, or right, as shown here:

Figure 6.15 – Aligning columns
Most other column headers are fairly straightforward in how they are used. However, the one you may not be familiar with or use very often is Field Occurrence. Let's explore this concept next.
Using a field occurrence
When an Internet Control Message Protocol (ICMP) error message is sent, the ICMP packet will include the following:
- The IP header for the error message.
- The first 8 bytes (64 bits) of the original datagram that caused the error. This is sometimes referred to as a nested ICMP packet.
To see an example of an error, go to CloudShark to obtain a copy of ICMPv4_Destination_unreachable, found at https://www.cloudshark.org/captures/155db9732c91, and then open the capture in Wireshark.
Note
We'll learn more about ICMP in Chapter 12, Discovering ICMP.
When using Field Occurrence, we can see the ID field of the first (main) IP header along with the ID field of the nested IP header. This will allow us to easily see the difference between the two, as shown in the following screenshot:
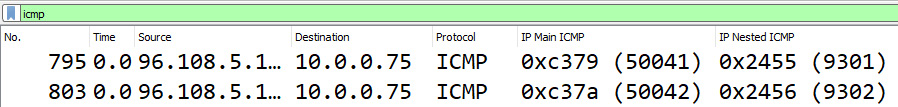
Figure 6.16 — Using the field occurrence option
To create the custom column headers, let's start by creating a new profile.
Go to Edit | Configuration Profiles:
- Once there, select the + sign and name the new profile ICMP.
- Close the dialog box.
- Make any desired profile modifications, such as changing the font or modifying the panel layout.
Now that we have a new profile, we will create the field occurrence option.
Go to Edit | Preferences, and then Columns. Uncheck Length and Info, as shown in the following screenshot:
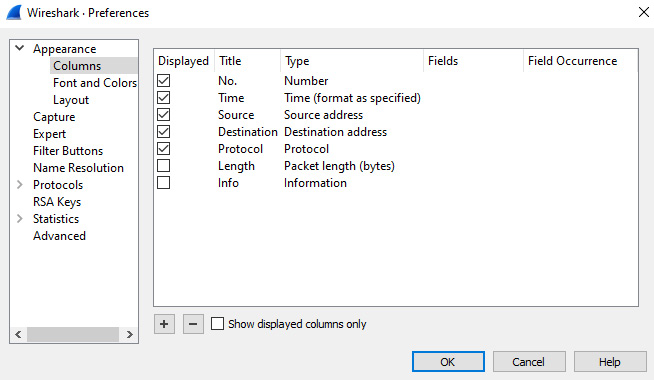
Figure 6.17 — Viewing the Columns dialog box in Preferences
Next, we will add two new column headers.
Select the + (plus) sign and then modify the settings for the first newly created column header as follows:
- Displayed: Checked
- Title: IP Main ICMP
- Type: Custom
- Fields: ip.id
- Field Occurrence: 1
Select the + (plus) sign and then modify the settings for the second newly created column header as follows:
- Displayed: Checked
- Title: IP Nested ICMP
- Type: Custom
- Fields: ip.id
- Field Occurrence: 2
The result is shown in Figure 6.16, where, right after the Protocol column header, you will see IP Main ICMP, followed by IP Nested ICMP.
As we can see, Wireshark is very versatile in modifying columns to adjust your view. Next, let's take a look at an overlooked feature in Wireshark, which is the ability to adjust the font and change the default colors.
Refining the font and colors
In the main window, you may feel the text is too small, as the Default profile uses the Consolas 10 style as the font and size. It's easy to change the font and colors, make the text bold or italic, and change the font size and style.
Go to Edit | Preferences and select Font and Colors, as shown in the following screenshot:
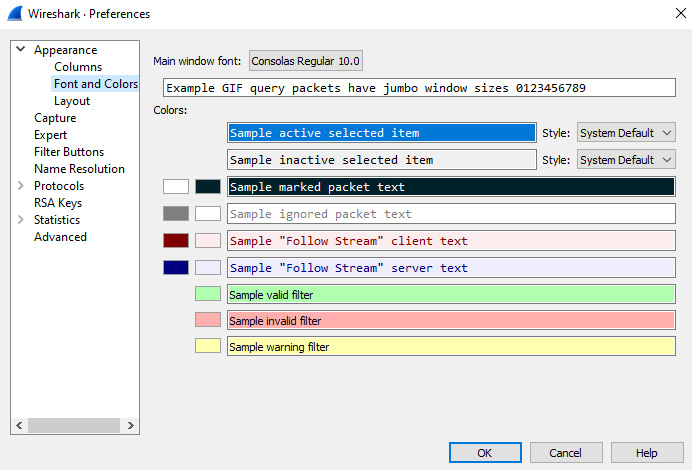
Figure 6.18 – The Wireshark Preferences dialog box – Font and Colors
Along the top, if you select Main window font, Wireshark will display a dialog box that will allow you to make changes to the font, as shown here:

Figure 6.19 – Main window font
Below Main window font, you'll see defaults for the way Wireshark colorizes the text and background for active and inactive items, along with marked and ignored packets. After that, you will see the defaults for the client and server text when you right-click on a packet and select Follow the TCP Stream, as shown here:
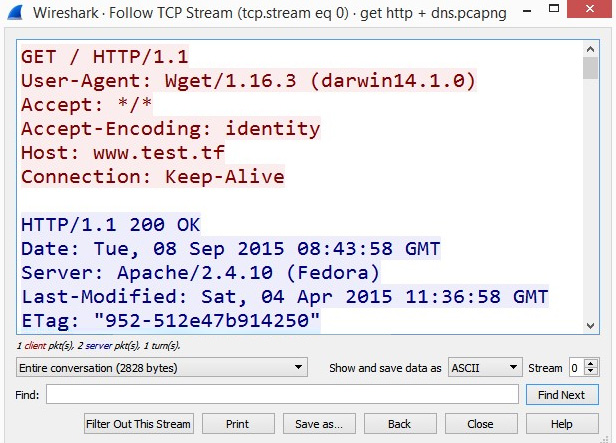
Figure 6.20 – Follow the TCP Stream
The colors help identify whether the client or the server is talking. When you follow the TCP stream, the default value for the client text is red, but this value can be changed.
The last three samples listed refer to the colors when creating a filter. The syntax checker within Wireshark checks the filter as you are entering text. When creating a filter, the following are default values:
- A valid filter turns the background green.
- An invalid filter turns the background red.
- A warning filter turns the background yellow.
As with all the other choices, you can change these values as well.
In Wireshark, we can indicate information about a particular packet or capture a file in the form of comments, as we'll see in the next section.
Adding comments
While conducting packet analysis, there may be issues that you will want to highlight and identify so that you can reference them at a later date. For example, you might want to make a note on a single packet or an entire capture for future reference.
All of this is possible in Wireshark, as you can write a note in the capture outlining the key issues that were found. Once documented, you or your team can reference the comments at a later date.
Note
While commenting is optional, it is always good practice to document to help preserve the details of your findings.
Let's start with how we can add file comments.
Attaching comments to files
Adding a comment to a packet capture is a very handy tool. When adding a comment, you can view it later to refresh your memory on key issues related to that packet capture. For example, you may have identified possible illegal or malicious activity, such as cryptocurrency mining, and you can list the details right in the capture file.
There are a few ways to add a comment to the file. Some examples are as follows:
- Go to the status bar and select the icon that looks like a pencil and paper, which is found to the immediate right of the expert system icon, as shown on the left-hand side of Figure 6.7.
- Go to Statistics and then Capture File Properties, where you can add comments in the lower pane of the dialog box. Once done, you should select Save Comment.
Adding a comment to the file can help remind you or your team of what was significant about the capture. However, it's also possible to add a comment to a single packet, as discussed in the next section.
Entering packet comments
To add a comment to a single packet, select the packet and then go to Edit | Packet Comments | Add New Comment. A dialog box will be displayed, where you can enter your comment. Once you have entered your comment and saved the file, Wireshark will append a note with bright green coloring on the top of the frame, in the Packet Details panel, as shown in the following screenshot:

Figure 6.21 – Packet comments in the Packet Details panel
Once you have added comments to either the entire capture or a single packet, you'll want to save them and then, at some point, go back in and reference the notes. The following section reviews how we can take a look at the comments and how to preserve our remarks.
Viewing and saving comments
Comments can be a powerful tool, as you can use them in many ways to preserve what you felt was significant in the capture. Even after several years have passed, I still find the comments valuable, as they help me to remember my train of thought when I analyzed a packet capture. However, in order for the comments to be of value, you must save them. Let's discuss how this is achieved.
Once you have created a comment, you will see an asterisk by the title across the top of the Wireshark interface, as shown here:
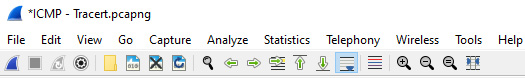
Figure 6.22 — An asterisk indicating that there are file comments
The asterisk will remain until you save the file. Keep in mind that to preserve the comments, you must save the file in PCAP Next Generation (.pcapng) format.
If you or your team has taken the effort to make a comment, then it's well worth your time to read them. You can view either packet or capture file comments in a few ways:
- To see all packets that have comments, use the pkt_comment display filter.
- To see all the comments for the entire capture, go to Statistics | Capture File Properties and view the comments found in the lower pane.
You can also view packet comments by going to Expert Information, which is found by selecting the colored circle in the lower left-hand corner of the interface. Once the dialog box opens, expand the Comment section to see any comments, as shown in the following screenshot:

Figure 6.23 – A packet comment in the Expert Information panel
By now, you can appreciate the many ways in which you can personalize the interface and document your work while analyzing packet captures.
Summary
Whether you are a power user or a casual analyst, it only takes a few minor tweaks to personalize Wireshark so that you can complete tasks more efficiently. In this chapter, we examined the many ways to customize the Wireshark interface to fit your workflow. We covered how to modify choices such as recent filters and folders, along with the layout and general appearance. We discovered how easy it is to create tailored profiles to include preferences, coloring rules, and font styles. We then learned how to create a filter button on the toolbar for commonly used filters in Wireshark.
Furthermore, we discovered how to modify, add, or remove columns and column headers. We examined ways to fine-tune the font to make packets easier to read. We also reviewed how we can change the default colors for the various identifiers, such as the text color for marked packets. Finally, we illustrated the ability to add comments to a single packet or the entire capture to communicate issues to team members.
In the next chapter, we will take a closer look at using display and capture filters, as well as learn about some tricks and specific rules for using filters. We will then learn about using capture filters, including default capture filters, and how you can build your own. Finally, we will discover how to use shortcuts to create filters and review some commonly used filters to better manage your workflow.
Questions
Now, it's time to check your knowledge. Select the best response and then check your answers, which can be found in the Assessment appendix:
- Normally, when you open Wireshark, the configuration profile will be set as the _____ profile:
- Marquee
- Bluetooth
- Classic
- Default
- You can set Wireshark to open files from a specific location. Go to ____, then Preferences, and then select the file location under ____:
- Tools | Folder
- Edit | Appearance
- View | Appearance
- View | Folder
- The default value for the client text for Follow the TCP Stream is _____, but this value can be changed:
- black
- blue
- red
- cyan
- When working with Wireshark, you can easily create and add a button to automatically run a custom filter when selected. To remove a button, go to _____, then _____, and select Filter Buttons, and remove any buttons that you no longer need:
- Edit | Preferences
- View | Appearance
- View | Buttons
- Tools | Buttons
- When you want to add a comment to a packet, select the packet, go to ___, and then go to Packet Comments:
- Tools
- Edit
- View
- Analyze
- A configuration _____ is a set of preferences and configurations specific to your needs:
- button
- profile
- tool
- analyze
- When creating a filter, the default value for an invalid filter is to turn the filter background _____:
- green
- blue
- red
- yellow