
Chapter 4: Exploring the Wireshark Interface
When you launch Wireshark for the first time, it's sometimes puzzling having to navigate the interface until you are familiar with all of the elements. Once you have a grasp of all the components, toolbars, and menu choices, you can capture and analyze traffic more efficiently. In this chapter, we'll start by exploring the Wireshark interface and reviewing all of the essentials of the welcome screen, including the sparklines, capture filters, and interfaces.
Although Wireshark currently has over 10 menu choices, in most cases, you'll find that there are a few that are more commonly accessed. So that you are more confident when moving about the interface, we'll examine the File menu, where you can open a file, save, print, and export a capture. We'll also investigate the Edit menu, where you can mark packets, set time references, and add comments. Finally, we'll take a look at the View menu so that you can learn how to customize the look and feel of the Wireshark interface.
In this chapter, we will cover the following topics:
- Opening the Wireshark welcome screen
- Exploring the File menu
- Discovering the Edit menu options
- Exploring the View menu
Opening the Wireshark welcome screen
Once you launch Wireshark, you'll find the menu choices across the top of the Wireshark welcome screen. If you don't have a capture file loaded, you will see that all of the menu choices are available. However, the icons might be dimmed, as shown in the following screenshot:
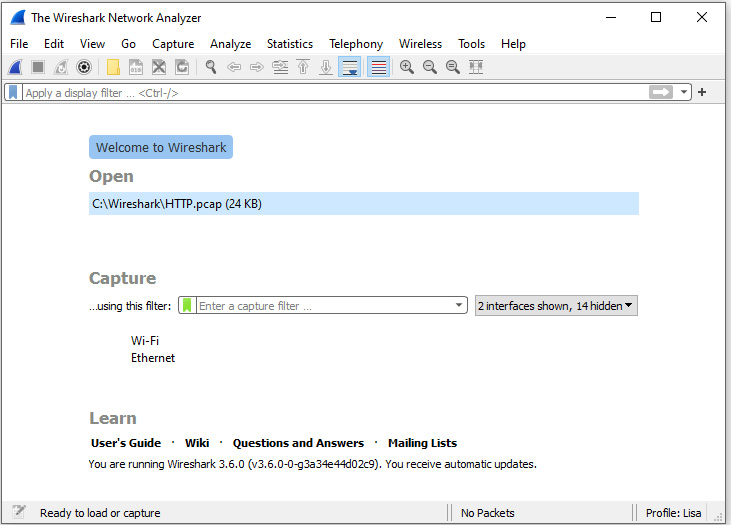
Figure 4.1 – The Wireshark welcome screen
The icons will become active once you have a file open or are actively capturing packets.
Once in the welcome screen, you'll most likely either launch a file or begin capturing traffic. So, let's start with the many options that are available when opening a packet capture.
Selecting a file
Beneath the icons and the display filter, you'll see a banner that reads Welcome to Wireshark. Underneath the banner, you will see the Open label, which will identify any previously opened packet captures that are available.
If you right-click on a file, you have the following options: Show in Folder, Copy file path, or Remove from list.
Note
In some cases, you might not have any files listed. In that case, the Show in Folder, Copy file path, or Remove from list options won't be available.
For example, while in a Windows operating system (OS), if you select Show in Folder, as shown in the following screenshot, this will launch the file explorer:
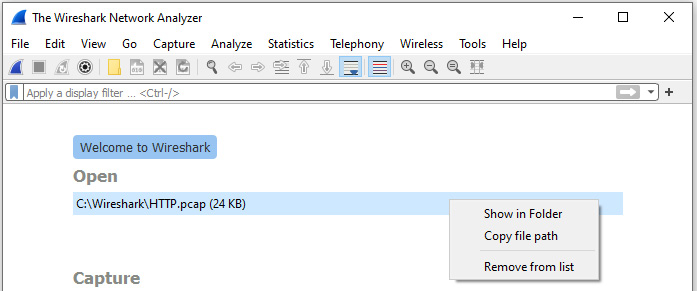
Figure 4.2 – Right-click and Show in Folder
At that point, you can then select a file, drag it onto the Wireshark screen, and the file will open.
Once you begin capturing packets, you might have a dozen or so files in the Open file area. Although the files are shortcuts for ease of access, they could be distracting. If you want to remove the files, navigate to the File | Open Recent | Clear Menu menu, as shown in the following screenshot:
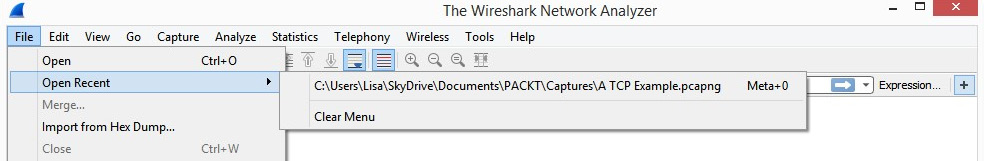
Figure 4.3 – The Clear Menu choice
Next, let's take a look at the options for gathering network traffic.
Capturing traffic
When you're ready to capture traffic, you'll want to properly set up Wireshark. You can find the Capture label in the middle of the screen. Below that, you'll see …using this filter:. Once there, you can apply a capture filter in the space provided.
Note
A capture filter allows you to filter specific traffic during a capture. If you do use a capture filter, be aware that it will limit what you capture to only what you have filtered on, and you could miss the traffic that can help with your analysis.
On the right-hand side of the capture filter, you will see a drop-down menu that reads All interfaces shown. If you want to remove any of the classes of interfaces (such as Wired, Bluetooth, or Virtual), you can select one from the drop-down menu, as shown in the following screenshot:
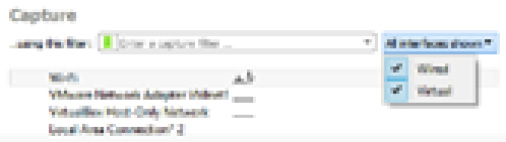
Figure 4.4 – The display interface(s)
Beneath the capture filter area, you'll see a list of available interfaces, and you can quickly begin capturing traffic by selecting an active sparkline.
Once you have either opened a packet capture or run a capture for analysis, you will most likely use one of the many menu choices. The following section covers what is possible in the File menu.
Exploring the File menu
When working with the Wireshark interface, File is the go-to menu because it has all of the tasks commonly associated with working with a file, as shown in the following screenshot:
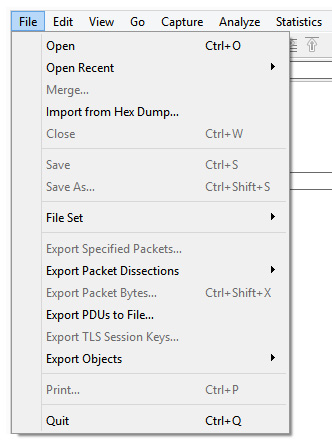
Figure 4.5 – The File menu
In this section, we'll walk through the many options found in the File menu. Let's begin with the ways to locate and open a file, save a capture, and compare options that are available when you close a file.
Opening a file, closing, and saving
The first section in the File menu offers many choices for locating and opening files so that you can begin your analysis. While looking at the menu choices, you will see a light gray line that separates grouped objects. The first grouping is related to opening and closing a file, and it includes the following choices:
- Open will launch a dialog box that will allow you to select any supported file.
- Open Recent will list any recently accessed files.
- Merge… will allow you to merge a file with the capture you have open. When merging, it's important that the time values are synchronized, as that is what Wireshark uses to merge the two files.
- Import from Hex Dump… is convenient when someone has sent you a hex dump from another device for analysis. The import dialog box will step you through the process of selecting the appropriate choices when importing the file.
- Close will close the current capture. If it is a new capture or you have added comments, Wireshark will ask you whether you'd like to save the file.
The next grouping consists of tasks that are related to saving a file:
- Save allows you to save the current file. This is useful if you have added comments or modified the file and want to preserve the changes.
- Save As… allows you to save the file as something other than the default extension, .pcapng. Once in the dialog box, you can select from the many different file formats that Wireshark has available.
The File Set option offers the ability to work with a set of files. For example, if you're doing a firewall ruleset and you're going through a whole month of files, you can work through the list one by one. When this option is selected, you can right-click and your choices will be List Files, Next File, and Previous File.
The following File menu section examines the many ways to export parts of a capture.
Exporting packets, bytes, and objects
Instead of saving an entire file, you might want to only save a portion of the file or even just the objects found within the file. Within this section, you'll find several export options.
The first option is Export Specified Packets. Once the dialog box is open, you can include only displayed packets, a range of packets, and marked packets, as follows:
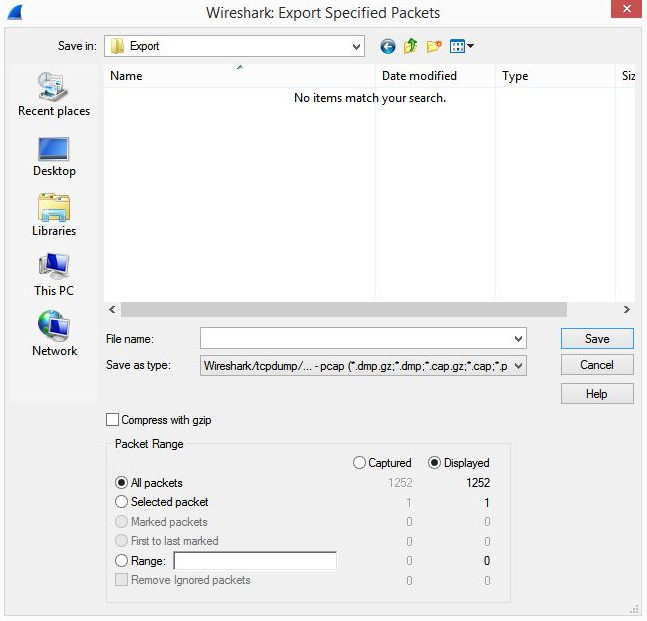
Figure 4.6 – The Export Specified Packets dialog box
Another submenu choice is Export Packet Dissections, which offers many choices to export, as shown in the following screenshot, including Comma-Separated Values (CSV), plain text, and JavaScript Object Notation (JSON):
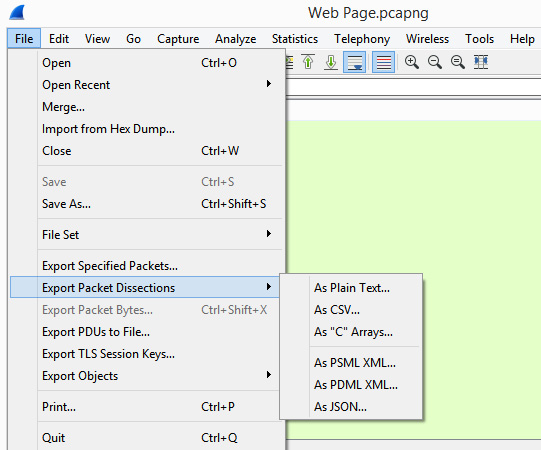
Figure 4.7 – The Export Packet Dissections menu
The next three submenu items offer more ways to export components and include the following:
- Export Packet Bytes…: This feature exports the packet bytes into C arrays so that you can import the stream into a C program.
- Export PDUs to File…: This menu choice offers many selections to export. However, this feature may not show a usable output and may only work with specific applications.
- Export TLS Session Keys…: If there are session keys within the file, select this option to export the keys that can be used to decrypt the data. Wireshark will display a popup if there are no Transport Layer Security (TLS) keys to save.
- Export Objects: This menu choice allows you to export various objects found within the file, such as Hypertext Transport Protocol (HTTP) objects.
Of all the options, Export Objects can provide a way in which to visualize the various objects found within the data stream, such as files, images, and executables. Let's explore this option next.
Exporting objects
The Export Objects submenu choice identifies any objects found within the file and allows you to save and examine the objects. Once in the submenu choice, right-click to see the selection, as shown in the following screenshot:

Figure 4.8 – The Export Objects selections
To see an example of what you can export, navigate to https://www.cloudshark.org/captures/0012f52602a3.
Once you're on CloudShark, select Export | Download File from the menu found on the right-hand side of the screen. Then, open the packet capture file, http://packetlife.net/captures/HTTP.cap, in Wireshark. Once it has been downloaded, save it as HTTP.pcap.
Once open, select Export Objects | HTTP, which will display the list of objects found, as follows:
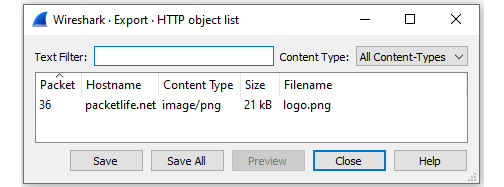
Figure 4.9 – The Export Objects | HTTP dialog box
Within this window, you can select Save, Save All, or even Preview. If there are multiple objects in the capture, you can use the Text Filter function to drill down to a particular object.
I selected Save and then navigated to a temporary folder, Export. For the filename, I selected logo.png, as follows:
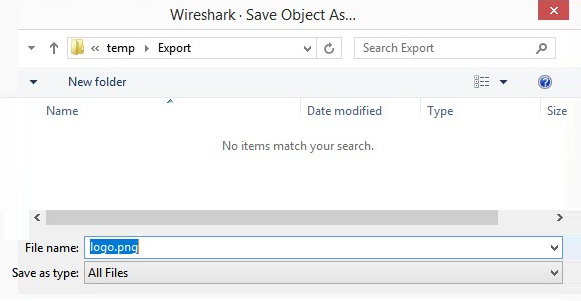
Figure 4.10 – The Export Objects | Save As dialog box
When you are done exporting, navigate to the folder and open the image. You should see the PacketLife.net logo.
If there are other objects within the file, you can save them in a similar manner. Alternatively, you can select Save All, which will save all objects within the capture.
As you can see, there are many ways to export components in Wireshark. In the lower part of the File menu, there are options to Print and Quit, which we'll evaluate next.
Printing packets and closing Wireshark
While examining packets, Wireshark offers many ways in which to print different sections of the capture. Using the HTTP.cap file, select Print, and you will see the following:
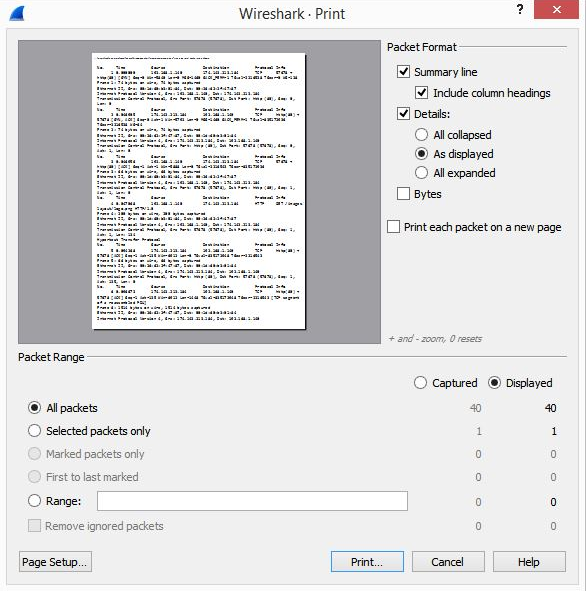
Figure 4.11 – The File | Print option
Once there, you can choose to print all of the packets, selected packets only, or a range of packets to a Portable Document Format (PDF), which you can then include in a report.
After completing your analysis, you'll want to quit the application. If you select Quit, and you have a new capture, Wireshark will ask you whether you'd like to save the file.
After running a capture or opening a file, you'll want to begin your analysis. In the following section, we will cover the Edit menu, where you can discover the many possibilities that are available when working with a packet capture.
Discovering the Edit menu
The Edit menu allows you to find and mark packets, set a time reference, copy, provide detailed information for creating a configuration profile, or modify your preferences. The following is a screenshot of the Edit menu:
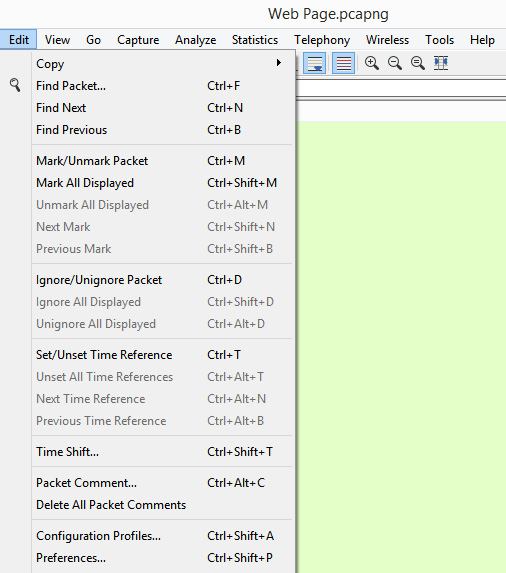
Figure 4.12 – The Edit menu
Within the Edit menu, there are numerous options. The following discussion outlines ways in which to copy various items and find packets within Wireshark.
Copying items and finding packets
In this section, we'll learn how Wireshark makes it easy to copy several objects within the interface. In addition, we'll discover how we can locate a specific packet or a string value within the capture.
Let's begin by covering the many options within the Copy submenu.
Outlining copy options
While analyzing packets, you might see an item or value you would like to copy. The Edit | Copy menu choice has many submenus to further define options, as follows:
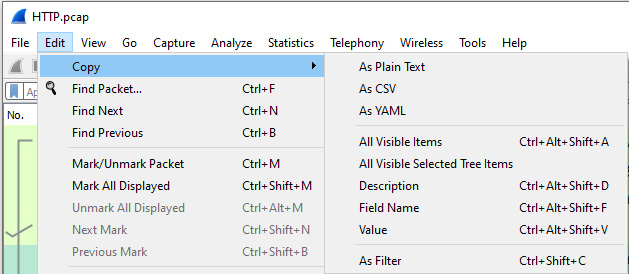
Figure 4.13 – The Copy options
Using the HTTP.cap file, we'll walk through some of the results when selecting the different copy options:
- As Plain Text: Selecting this option will copy the details of the frame in plain text. To view this option, go to frame five (5) and then select As Plain Text. It will appear as follows:
No. Time Source Destination Protocol Info
5 0.094268 174.143.213.184 192.168.1.140 TCP80 →
57678 [ACK] Seq=1 Ack=135 Win=6912 Len=0 Tsval=835172948 Tsecr=2216543
- As CSV: The CSV format is useful if you need to import the data in a spreadsheet. This format will present the information with each value separated by a comma. To view this option, go to frame five (5) and select As CSV. This will copy the details of the frame, as follows:
"No.","Time","Source","Destination","Protocol","Info"
"5","0.094268","174.143.213.184","192.168.1.140","TCP","80 → 57678 [ACK] Seq=1 Ack=135 Win=6912 Len=0 TSval=835172948 TSecr=2216543"
- As YAML: The YAML Ain't Markup Language (YAML) presents the information as a YAML binary dump. In addition to the details of the packet, you will see the details of the file path.
- All Visible Items: This will copy all elements of the selected frame.
- All Visible Selected Tree Items: This will copy all elements of the selected tree items. For example, if we go to frame five (5) and select the TCP header, this option will copy any of the tree items shown:
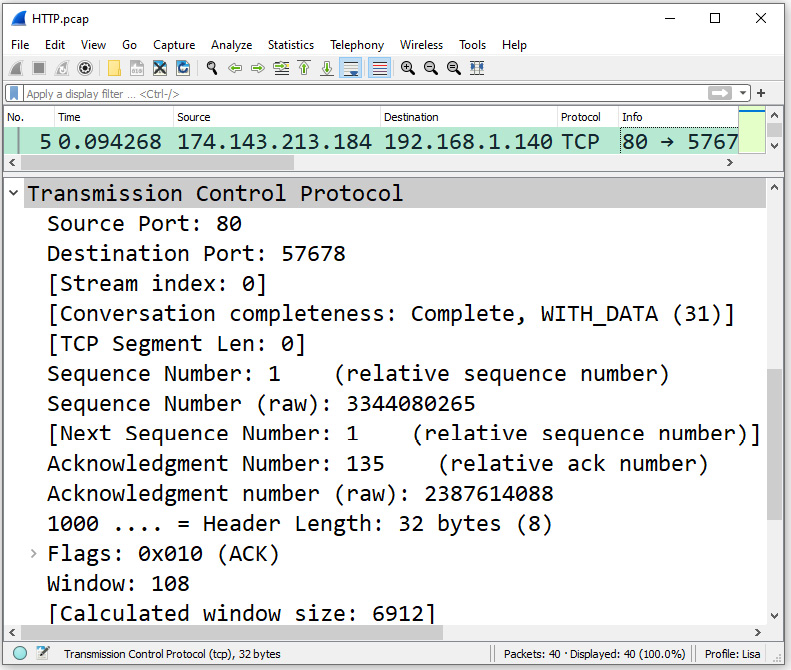
Figure 4.14 – The expanded TCP header
However, when using this option, it will not copy any tree items that are not expanded. For example, you will not see the details of the TCP Flags, as the tree has not been expanded.
- Description: This will copy the selected value. For example, go to frame five (5), expand the IP header, and select the source IP address. Select Edit | Copy | Description, which will copy the following: Source Address: 174.143.213.184.
- Field Name: This copies the selected field name. For example, go to frame five (5), expand the IP header, and copy the Field Name option of the source IP address. This will copy the following: ip.src.
- Value: This will copy the selected field value. Go to frame five (5), expand the IP header, and select the source IP address. This will copy the IPv4 address: 174.143.213.184.
- As Filter: This will create a filter based on the IPv4 address you selected or any other value. Following this, you can paste the filter in the display filter area, press Enter, and Wireshark will run the filter.
After the Copy submenu choice, the next grouping offers ways to find packets.
Locating packets
While conducting an analysis, you might need to find specific packets. The following is a list of choices that can help you to navigate a packet capture:
- Find Packet…: This is where you can search for specific packets and even find string values within a packet capture.
- Find Next: If Wireshark finds what you are looking for, Find Next will go to the next instance.
- Find Previous: If Wireshark finds what you are looking for, Find Previous will go back to the previous packet.
While working with packets, you might find and mark packets that are interesting so that you can return to them at a later date. In addition to this, you might want to ignore specific packets.
Marking or ignoring packets
Marking packets while in Wireshark is easily achieved. Once you have selected a packet, right-click, and Wireshark will mark the packet with a black background and white text, as follows:
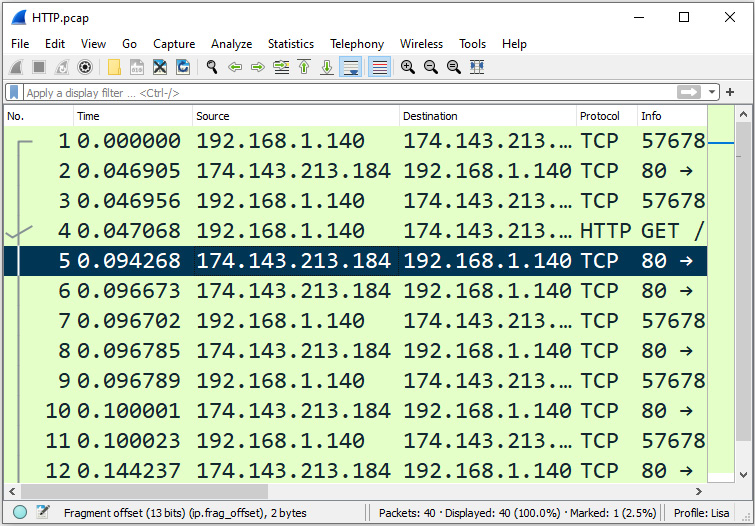
Figure 4.15 – Marking a packet
The following is a list of options that you can use when marking packets:
- Mark/Unmark Packet: This allows you to mark a specified packet or packets, which turns the packet(s) black for easy visual reference.
- Mark All Displayed: This marks all displayed packets. For example, if you use a display filter, Wireshark will only mark the packets that are displayed.
- Unmark All Displayed: If all displayed packets are already marked, then this will unmark all displayed packets.
- Next Mark: When the packets are marked, this option allows you to move to the next marked packet.
- Previous Mark: When the packets are marked, this option allows you to navigate back to the previously marked packet.
In addition to marking packets to identify items of interest, you might want to ignore specific packets. The following list describes how you can select specific packets to ignore while doing your analysis:
- Ignore/Unignore Packet: This allows you to select a packet, and once selected, it will be as if the packet never existed. The packet won't show up in statistics or a flow graph; it's simply ignored. Once selected, the packet line will have a reference that reads <Ignored>, as follows:
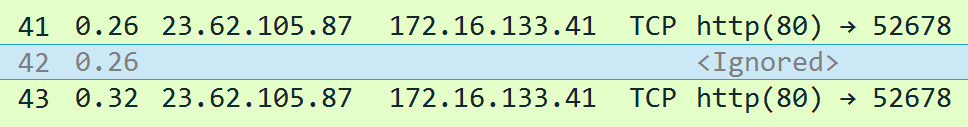
Figure 4.16 – Using the Ignore Packet option
- Ignore All Displayed: This ignores all displayed packets, meaning if you use a display filter, Wireshark will only ignore the displayed packets.
- Unignore All Displayed: If the displayed packets are ignored, when selected, Wireshark will unignore all displayed packets.
While some packets might be ignored as they hold no value in the analysis, you might want to use other methods to determine delays, as we'll explore next.
Setting a time reference
In your analysis, you might have a group of packets where you want to see exactly how long the delay was within those packets. In Wireshark, you can set a time reference on the packet where you think the trouble began and watch the time values to see gaps in the transmission. Wireshark provides a variety of ways to set a time reference and then offers ways to navigate through the references. Options include the following:
- Set/Unset Time Reference: This allows you to set/unset a time reference.
- Unset All Time References: This will unset all time references.
- Next Time Reference: Once a reference has been set, this allows you to navigate to the next time reference.
- Previous Time Reference: Once a reference has been set, this allows you to navigate to the previous time reference.
If you need to adjust the time reference, you can use the Time Shift option.
Shifting time
If, during your analysis, you need to merge two captures that each used a different file format, you might want to use Time Shift. For example, if one file used the Network Time Protocol (NTP) and the other file used the Precision Timing Protocol (PTP), this option will help to sync up the files.
Once you select this option, it will launch a dialog box where you can set your values, as shown in the following screenshot:
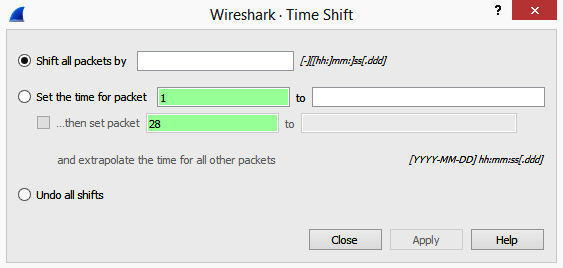
Figure 4.17 – The Time Shift option
The last option gives you the ability to undo all shifts if you get unexpected results.
Now that we understand how we can reference or shift time in Wireshark, let's take a look at ways in which to personalize your work area.
Personalizing your work area
While working with a capture, you can record your changes by using comments or modifying the look and feel of your workspace.
When working with comments, the following choices are available:
- Packet Comments: This allows you to include comments within a single packet.
- Delete all Packet Comments: This removes all comments.
In addition, you can fine-tune the interface in the following ways:
- Configuration Profile: This allows you to create a customized profile that is specific to your workflow. This is a powerful feature, as you can create several profiles so that they can be used for specific applications or clients.
- Preferences: This is where you can adjust the font and color or even the layout. We'll cover this in more detail in Chapter 6, Personalizing the Interface.
Although the Edit menu is widely used, let's take a look at the View menu so that you can see the many ways in which to modify the look and feel of your capture during analysis.
Exploring the View menu
The View menu is where you can alter the appearance of the captured packets, and it includes ways to colorize packets, expand subtrees, or show a packet in a separate window.
Let's start with ways to adjust the toolbars and panels and how to go into full screen mode. If you would like to follow along, use the HTTP.pcap file.
Enhancing the interface
In Wireshark, there are several ways to alter and enhance the interface, including how we view the toolbars and what panels we would like to be visible. We'll start at the top with the toolbars.
The toolbar section represents a grouping where similar items are combined in many menus. Once you are in this section, you will see a list of three toolbars that are currently available, as follows:
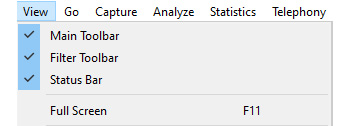
Figure 4.18 – The View menu toolbars and Full Screen options
If you see a checkmark, as shown in the preceding screenshot, that indicates the toolbar is visible. The toolbars are explained as follows:
- Main Toolbar: This holds all of the commonly accessed icons, as follows:
Figure 4.19 – The main toolbar
- Filter Toolbar: This is where you will find the display filter.
- Status Bar: This toolbar is found at the bottom of the Wireshark screen and lists information specific to the active file. Information includes what filter has been applied, how many packets have been captured and how many are displayed, along with what profile has been applied, as shown in the following screenshot:
Figure 4.20 – The status bar
- The next menu choice is Full Screen, which will cause Wireshark to fill the current window.
Once you get used to the toolbars, you will see that they provide a handy way to help you navigate the interface. Now, let's take a look at the next grouping, which is the panel view, so you can modify what is visible on the screen. A checkmark indicates the panel is visible. If you do not want a panel to be visible, uncheck the panel and it will be hidden from view:
- Packet List: This is a list of all of the captured packets, where each line represents a single packet.
- Packet Details: This displays the details of a single packet.
- Packet Bytes: This is a hexadecimal representation of a single packet.
- Packet Diagram: This panel will show each packet with a diagram of each of the headers, as follows:
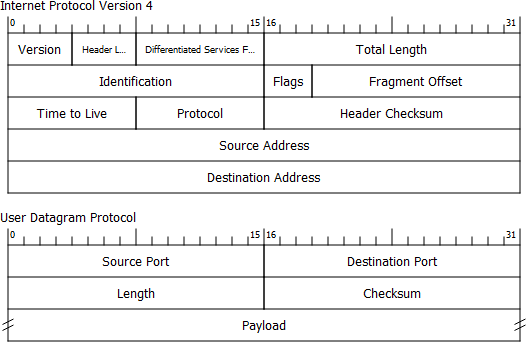
Figure 4.21 – A packet diagram view
The next section outlines the options for displaying time values in Wireshark, along with how to provide name resolution.
Formatting time and name resolution
The Time Display Format and Name Resolution menu choices both have several options within their submenus. We'll start with the Time Display Format option, which provides several ways to view the time values in Wireshark.
Displaying time
Once you expand the Time Display Format menu choice, you will see several options regarding how you want your time displayed. The options include Date and Time of Day; Year, Day of Year, and Time of Day; and Time of Day and Seconds Since 1970-01-01.
When carrying out an analysis, most likely, you will use a format that allows you to visualize any gaps in transmission. In that case, the following options are used:
- Seconds Since Beginning of Capture: This will show you how many seconds have passed since the capture was started.
- Seconds Since Previously Captured Packet: This will show you how many seconds have passed since the previously captured packet.
- Seconds Since Previously Displayed Packet: This is used when you apply a display filter, as it will show you how many seconds have passed since the previously displayed packet, which will more accurately show gaps in time.
- Other options include the Coordinated Universal Time (UTC) formats, as follows:
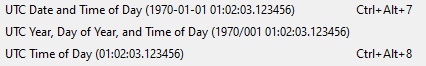
Figure 4.22 – The UTC display options
Time precision is also a consideration. When selecting a format, you have a choice of how many decimal places are displayed. There are several formatting options, as shown:
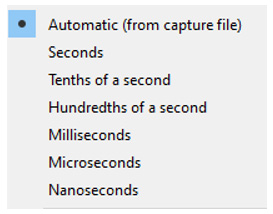
Figure 4.23 – The time precision options
Most of the time, it is best to use Automatic, which is the default, and that will be the best precision that the OS can provide.
The last option is Display Seconds With Hours and Minutes, which, when set, will appear as follows:
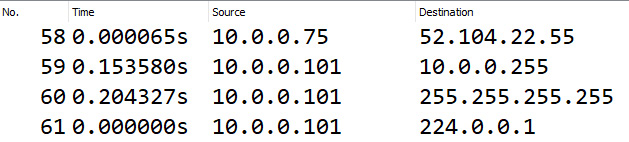
Figure 4.24 – Display Seconds With Hours and Minutes
The whole concept of time is important in packet analysis. Now you understand how you can easily modify the way time is represented. Name Resolution is another menu choice that has several selections. The following section will outline the options available to resolve names and the rationale behind why you would select each one.
Resolving names
Under the Name Resolution menu, you can resolve physical, network, and transport addresses. In most cases, Wireshark can resolve physical and transport addresses without any problem, as they both come from a file found in the local Wireshark folder.
To resolve physical addresses, Wireshark looks at the first six digits of a MAC address, which is the Organizational Unique Identifier (OUI). The resolution comes from the manuf.txt file, as shown here:
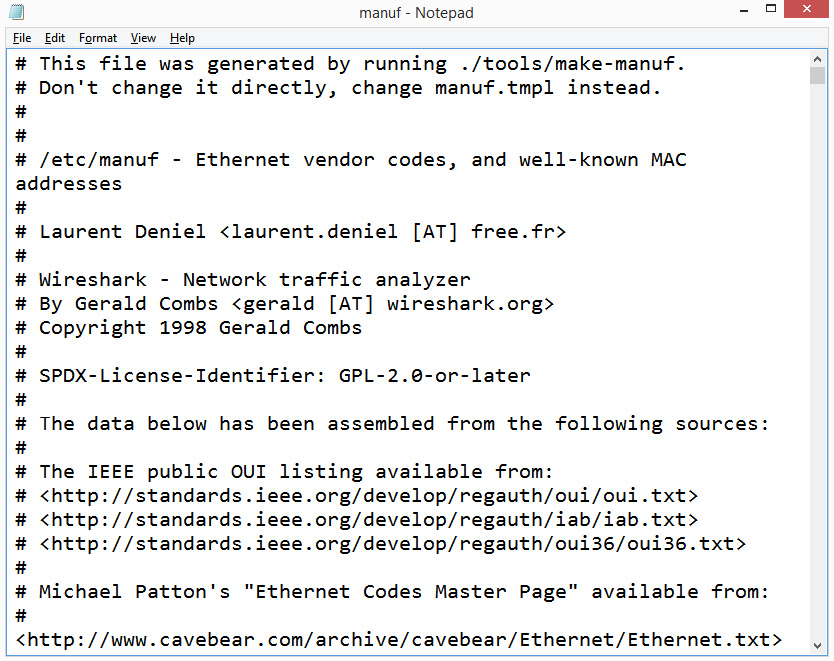
Figure 4.25 – The manuf file listing NIC card vendors
To resolve the transport address (or port number), Wireshark consults the services.txt file, which holds a list of services and the associated port number. For example, the Simple Mail Transport Protocol (SMTP) service uses port 25. When Wireshark identifies that port 25 is in use, it will display SMTP as the service, as long as you have requested name resolution.
The file uses the Internet Assigned Numbers Authority (IANA) port-number file for consistency and can be found in the Wireshark folder, as shown in the following screenshot:
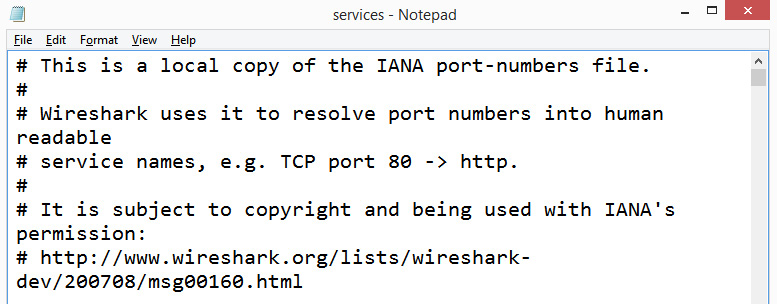
Figure 4.26 – The services file listing ports and associated services
The Resolve Network Addresses option will resolve a hostname to an IP address. Normally, this option is not checked because, if it is, Wireshark will ask the OS to contact the DNS server(s) to implement the resolution. This activity will then create a lot of additional network traffic.
If necessary, it is possible to change either the manuf or services files. In addition, you can also select Edit Resolved Names, which will bring up a Name Resolution Preferences toolbar where you can edit or add a name.
When working with a capture, there are ways to enhance your view, as we will learn in the next section.
Modifying the display
To see the details of your capture, there are a few enhancements that include the ability to zoom in, expand the subtrees, and colorize the conversation:
- Zoom: This allows you to zoom in, zoom out, or return to normal size.
- Subtrees: Within a packet capture, Wireshark will collapse the details of a protocol header. When you expand the subtree, you can see the details of the protocol. As shown in the following screenshot, the expanded UDP subtree provides a detailed view of all of the field values in the UDP header:
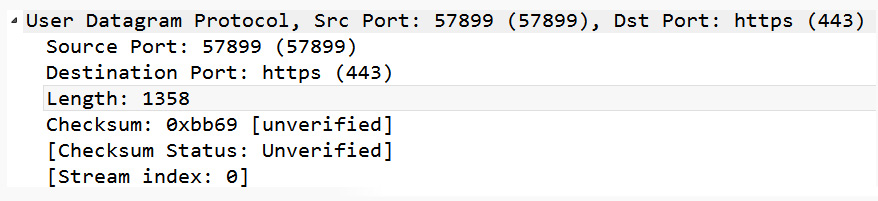
Figure 4.27 – A UDP header with an expanded subtree
Once done, you can collapse the subtree. In addition, you can also expand and/or collapse all subtrees.
To improve visibility and or highlight specific conversations, you can also use color.
Colorizing packets
Within Wireshark, there are several ways to use color. Coloring formats include the following:
- Colorize Packet List: This is a shortcut to turn the coloring rules on or off. Additionally, you can find an icon on the main toolbar underneath the Telephony menu, as follows:
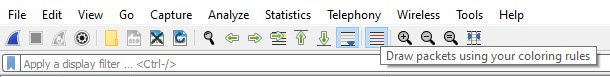
Figure 4.28 – The Colorize Packets icon
- Coloring Rules: This opens a dialog box where you can modify the coloring rules or create a new coloring rule.
- Colorize Conversation: This will colorize a conversation between two endpoints. You will have a choice as to what you would like to colorize, such as Ethernet, IPv4, or UDP—along with providing a choice of colors from which you can select, as shown in the following screenshot:
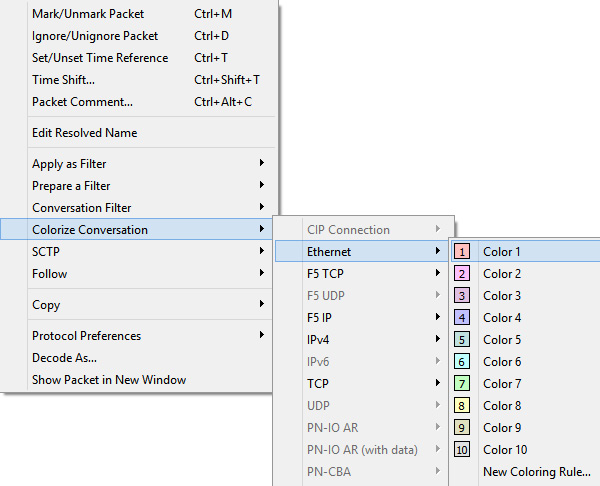
Figure 4.29 – Colorize Conversation
The last grouping of menu choices provides ways to refresh the view to reload, resize, show the packet in a new window, or view the internals.
Refreshing the view
Wireshark doesn't limit the way you can view the data in the interface. In fact, in this last section, we'll see the many options that allow you to view the captured packets:
- Resize Layout: This option, when selected, will resize the visible panels so that they have a uniform appearance.
- Resize Columns: In the same way that you can resize the columns in Excel to automatically fit the contents (AutoFit), this option will adjust the columns so that the contents fit. When using IPv4, the columns could adjust nicely, but using IPv6 takes up much more space and might not give you an optimal view.
If you are a developer, the next section outlines what is available behind the scenes to allow Wireshark to dissect and display the various protocols.
Using developer tools
The Internals menu choice provides advanced options that include the following submenu choices:
- Conversation Hash Tables: This shows the address and port combinations that identify each conversation. Select a single packet, and then click on this option to bring up the information, as shown in the following screenshot:
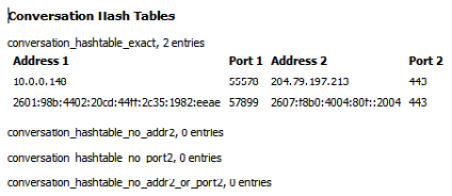
Figure 4.30 – The Conversation Hash Tables information
- Dissector Tables: This provides tables of subdissectors for each of the supported protocols, as shown in the following example:
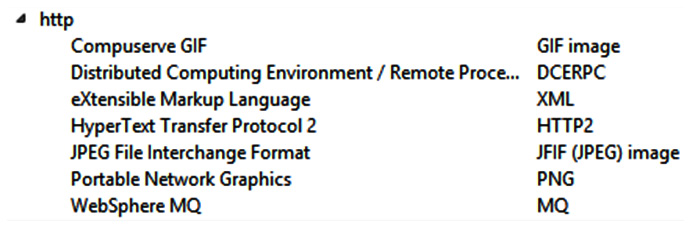
Figure 4.31 – The Dissector Table showing HTTP subdissectors
Within the table, you will also find the full name as well as the short name of the subdissector. For example, within the list of HTTP subdissectors, the short name for JPEG File Interchange Format (JPEG file in HTTP) is JFIF (JPEG) image.
- Supported Protocols: This will bring up an extensive list of all currently supported protocols and the protocol fields, along with the suggested filter and a brief description.
The last few options will either freshen the view or reload the capture.
Reloading the packets
When using Wireshark, there is no shortage of ways to present the data. Some additional view options include the following:
- Show Packet in New window: Often, you might want a single packet in its own window as a popup. This option might be ideal for training purposes when you want to show the details of a single packet.
- Reload: This option will reload the capture, which will freshen the capture file. This is helpful if you have marked packets and have already manipulated the file, and you want a fresh start with the file.
The Reload as File Format/Capture option will give you a view inside the pcap. Using the HTTP.pcap file, I modified the layout and then selected the option, which displayed this view:
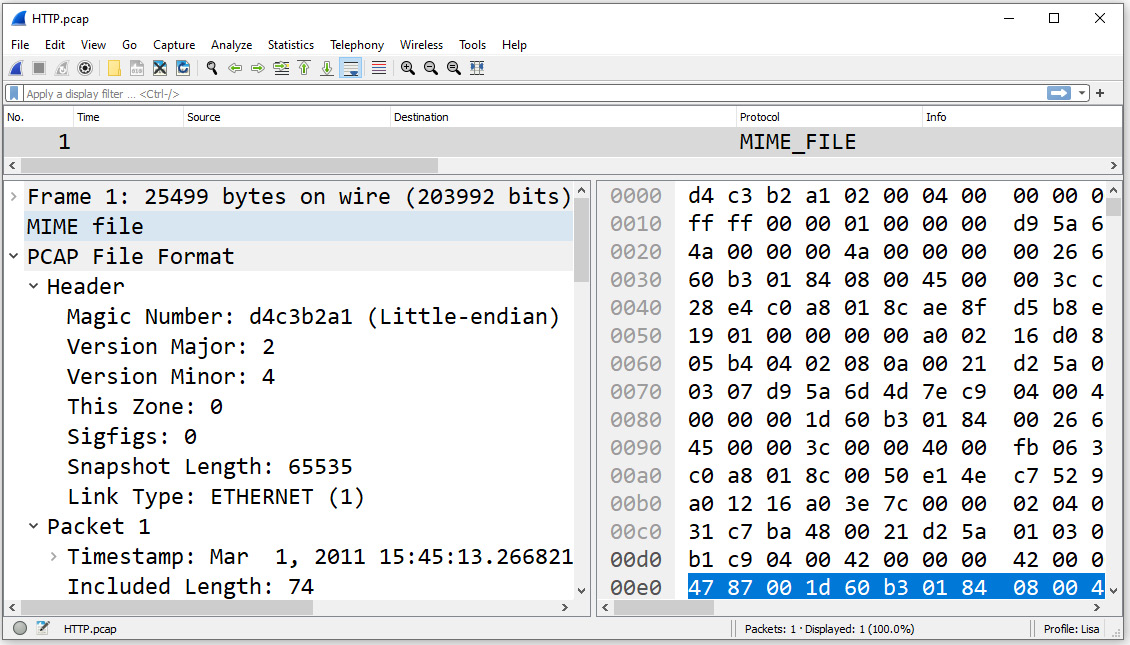
Figure 4.32 – Reloading as File Format/Capture
Whether you are a developer, network administrator, or student, you can appreciate the many flexible ways Wireshark provides to display and format data while working with a packet capture.
Summary
In this chapter, we explored all of the elements of the Wireshark welcome page, to give you a better understanding of what is available, even before opening a packet capture. We also took a closer look at commonly accessed menu choices to make navigating around Wireshark easier. First, we evaluated the File menu, which has all of the tasks commonly associated with working with a file.
Next, we studied the Edit menu, which allows you to find and mark packets, set a time reference, or modify your preferences. We concluded with the View menu, where you can alter the appearance of the captured packets, including how to colorize them, zoom in, or show a packet in a separate window.
In the next chapter, we will learn where and how to tap into a data stream. Because what you see when capturing data will depend on the type of network you are accessing, we will review the different network architectures. Then, when you are ready to capture, we will discover the various capture options, such as using multiple files and directing output. We'll also compare the difference between conversations and endpoints and finish with stressing the importance of baselining the network to help when conducting a troubleshooting exercise.
Questions
Now, it's time to check your knowledge. Select the best response and then check your answers, which can be found in the Assessments appendix:
- Once you begin capturing packets, you might have a dozen or so files in the Open file area. If you want to remove the files, go to the File menu. Then, choose Open Recent and _____ Menu.
- Clear
- Purge
- Delete
- Freshen
- Seconds Since _____ is used when you apply a display filter, as it will show how many seconds have passed since the previously displayed packet, which will more accurately show gaps in time.
- Recently Created Epoch
- Previously Captured Packet
- Beginning of Capture
- Previously Displayed Packet
- ___ is a shortcut to turn the coloring rules on or off. The shortcut is also available on the main toolbar (under the Telephony menu).
- Colorize Conversation
- Coloring Rules
- Stop Color Filters
- Colorize Packet List
- The _____ menu choice in Wireshark allows you to control the look of the displayed packets, including the ability to zoom in, colorize packets, and show a packet in a separate window.
- File
- Edit
- View
- Go
- When working with a packet capture, the _____ menu choice edit allows you to find and mark packets, set a time reference, copy, provide detailed information for creating a configuration profile, or modify your preferences.
- File
- Edit
- View
- Go
- The _____ is found at the bottom of the Wireshark screen. This toolbar is found at the bottom of the Wireshark screen and lists information specific to the active file. Information includes what filter has been applied, how many packets have been captured, and how many are displayed, along with what profile has been applied.
A. Capture Toolbar
B. Main Toolbar
C. Status Bar
D. Filter Toolbar
- At times, you might want a single packet in its own window as a popup. In that case, you should use the _____ option.
- Load Developer View
- Launch Plain Text
- Reload Layout
- Show Packet in New Window