Use the Superstore Sales dataset and follow these steps to build the individual views that will form the basis of the dashboard:
- Create a bar chart showing profit by category. Sort the categories in descending order by the sum of profit.
- Add the Department field to Filters and show a filter. To accomplish this, use the drop-down menu of the Department field in the data pane and select Show Filter.
- Name the sheet Overall Profit by Category:

- Create another, similar view showing profit by item. Sort the items in descending order by the sum of profit.
- You'll notice that there are too many items to see at one time. For your objectives on this dashboard, you can limit the items to only the top 10 least profitable. Add the Item field to the filters shelf, select the Top tab, and adjust the settings to filter By field. Specify the Bottom 10 by Sum(Profit):
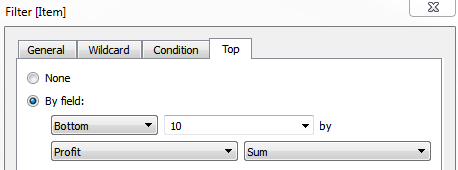
- Rename the sheet as Top 10 Least Profitable Items:

- Create another sheet that displays a filled map of profit by state. You can accomplish this rather quickly by double-clicking the State field in the data window and then dropping Profit on the Color shelf.
- Rename the sheet to Profit by State:

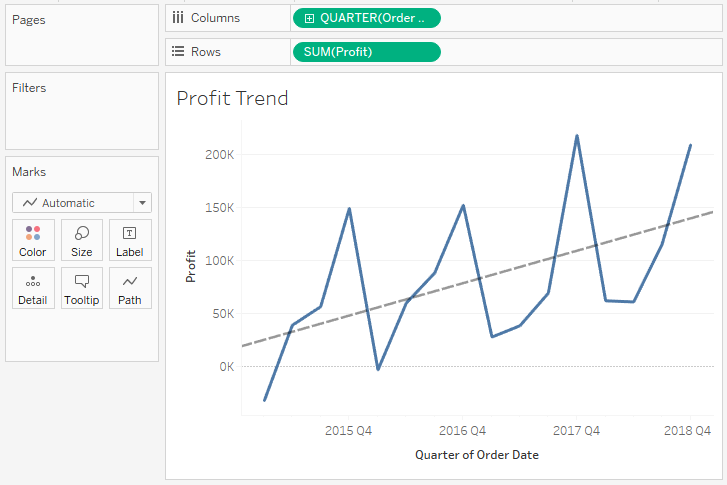
- Create one final sheet to show when profits were made or lost. Ensure that the Order Date field has been added as the Quarter date value and that it is continuous (green).
- Add a linear trend line. To do this, switch to the Analytics tab of the left sidebar and drag Trend Line from Model to the view. Alternatively, right-click a blank area of the canvas of the view and select Trend Lines | Show Trend Lines.
- Rename the sheet to Profit Trend: