
Treemaps use a series of nested rectangles to display parts of the whole, especially within hierarchical relationships. Treemaps are particularly useful when you have hierarchies and dimensions with high cardinality (a high number of distinct values).
Here is an example of a treemap that shows the number of days spent in the hospital by patients. The largest rectangle sections show Department Type. Within those are departments and patients:

To create a treemap, you simply need to place a measure on the Size shelf and a dimension on the Detail shelf. You can add additional dimensions to the level of detail to increase the detail of the view. Tableau will add borders of varying thickness to separate the levels of detail that are created by multiple dimensions. Note that in the preceding view, you can easily see the division of department types, then departments, then doctors, and finally individual patients. You can adjust the border of the lowest level by clicking the Color shelf.
The order of the dimensions on the marks card defines the way the treemap groups the rectangles. Additionally, you can add dimensions to rows or columns to slice the treemap into multiple treemaps. The end result is effectively a bar chart of treemaps:
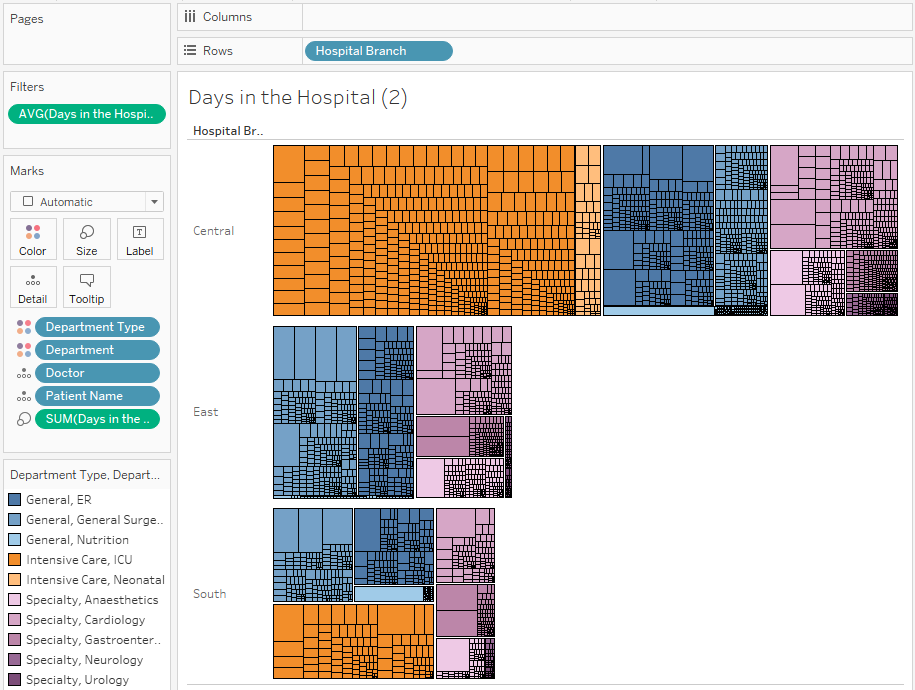
The preceding treemap not only demonstrates the ability to have multiple rows (or columns) of treemaps—it also demonstrates the technique of placing multiple fields on the Color shelf. This can only be done with discrete fields. You can assign two or more colors by holding down the Shift key while dropping the second field on color. Alternatively, the icon or space to the left of each field on the Marks card can be clicked to change which shelf is used for the field:

- Make sure that no continuous fields are used on Rows or Columns
- Use any field as a measure on Size
- Change the mark type based on the desired chart type: square for treemap, circle for packed bubbles, or text for word cloud (with the desired field on Label)