Analyzing trend models

It can be useful to observe Trend Lines, but often we'll want to understand whether the trend model we've selected is statistically meaningful. Fortunately, Tableau gives us some visibility into the trend models and calculations.

Simply hovering over a single trend line will reveal the formula as well as the r-squared and P-value for that trend line:

A P-value is a statistical concept that describes the probability that the results of assuming no relationship between values (random chance) are at least as close as results predicted by the trend model. A P-value of 5% (.05) would indicate a 5% chance of random chance describing the relationship between values at least as well as the trend model. This is why P-values of 5% or less are typically considered to indicate a significant trend model. A P-value higher than 5% often leads statisticians to question the correlation described by the trend model.

Additionally, you can see a much more detailed description of the trend model by selecting Analysis | TrendLines | Describe Trend Model... from the menu or by using the similar menu from a right-click on the view's pane. When you view the trend model, you'll see the Describe Trend Model window:

You can also get a trend model description in the worksheet description, which is available from the Worksheet menu or by pressing Ctrl + E. The worksheet description includes quite a bit of other useful summary information about the current view.

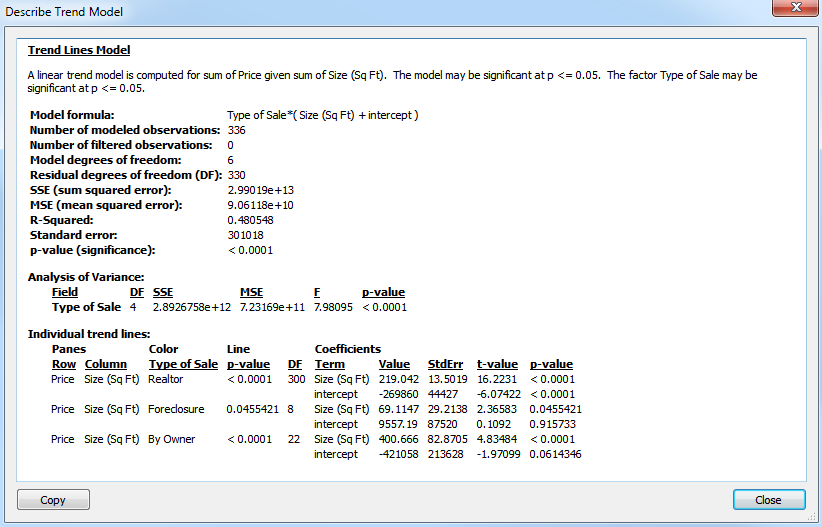
The wealth of statistical information shown in the window includes a description of the trend model, formula, number of observations, and P-value for the model as a whole as well as for each trend line. Note that, in the screenshot shown previously, the Type field was included as a factor that defined three Trend Lines. At times, you may observe that the model as a whole is statistically significant even though one or more Trend Lines may not be:

Additional summary statistical information can be displayed in Tableau Desktop for a given view by showing the Summary. From the menu, select Worksheet | Show Summary. The information displayed in the summary can be expanded using the drop-down menu on the Summary card.

..................Content has been hidden....................

You can't read the all page of ebook, please click here login for view all page.
Reset
18.222.22.145