
CHAPTER 9
Making the Innovation Case

The usual motive for developing a formal business plan is to secure support or funding for a project or venture. However, in practice, business planning serves a much more important function and can help to translate abstract or ambiguous goals into more explicit operational needs and support subsequent decision-making and identify trade-offs. A business plan can help to make the risks and opportunities more explicit, expose any unfounded optimism and self-delusion, and avoid subsequent arguments concerning responsibilities and rewards.
9.1 Developing the Business Plan
No standard business plan exists, but in many cases, venture capitalists will provide a pro forma for their business plan. Typically, a business plan should be relatively concise, say no more than 10–20 pages, begin with an executive summary, and include sections on the product, markets, technology, development, production, marketing, human resources, financial estimates with contingency plans, and the timetable and funding requirements. A typical formal business plan will include the following sections [1]:
- Details of the product or service
- Assessment of the market opportunity
- Identification of target customers
- Barriers to entry and competitor analysis
- Experience, expertise, and commitment of the management team
- Strategy for pricing, distribution, and sales
- Identification and planning for key risks
- Cash-flow calculation, including break-even points and sensitivity
- Financial and other resource requirements of the business
Most business plans submitted to venture capitalists are strong on the technical considerations, often placing too much emphasis on the technology relative to other issues. As Roberts notes, “entrepreneurs propose that they can do it better than anyone else, but may forget to demonstrate that anyone wants it” [2]. He identifies a number of common problems with business plans submitted to venture capitalists: marketing plan, management team, technology plan, and financial plan. The management team will be assessed against their commitment, experience, and expertise, normally in that order. Unfortunately, many potential entrepreneurs place too much emphasis on their expertise, but have insufficient experience in the team, and fail to demonstrate the passion and commitment to the venture.
There are common serious inadequacies in all four of these areas, but the worst are in marketing and finance. Less than half of the plans examined provide a detailed marketing strategy, and just half include any sales plan. Three-quarters of the plans fail to identify or analyze any potential competitors. As a result, most business plans contain only basic financial forecasts, and just 10% conduct any sensitivity analysis on the forecasts. The lack of attention to marketing and competitor analysis is particularly problematic as research indicates that both factors are associated with subsequent success. Table 9.1 summarizes the criteria used by venture capitalists to assess business plans.
TABLE 9.1 Criteria Used by Venture Capitalists to Assess Proposals
Source: Adapted from Knight, R., “Criteria used by venture capitalists.” In T. Khalil and B. Bayraktar, eds, Management of technology III: The key to global competitiveness). 1992, Industrial Engineering & Management Press, Georgia, pp. 574–83.
| Criteria | European (n = 195) | American (n = 100) | Asian (n = 53) |
| Entrepreneur able to evaluate and react to risk | 3.6 | 3.3 | 3.5 |
| Entrepreneur capable of sustained effort | 3.6 | 3.6 | 3.7 |
| Entrepreneur familiar with the market | 3.5 | 3.6 | 3.6 |
| Entrepreneur demonstrated leadership ability* | 3.2 | 3.4 | 3.0 |
| Entrepreneur has relevant track record* | 3.0 | 3.2 | 2.9 |
| Product prototype exists and functions* | 3.0 | 2.4 | 2.9 |
| Product demonstrated market acceptance* | 2.9 | 2.5 | 2.8 |
| Product proprietary or can be protected* | 2.7 | 3.1 | 2.6 |
| Product is “high technology”* | 1.5 | 2.3 | 1.4 |
| Target market has high growth rate* | 3.0 | 3.3 | 3.2 |
| Venture will stimulate an existing market | 2.4 | 2.4 | 2.5 |
| Little threat of competition within 3 years | 2.2 | 2.4 | 2.4 |
| Venture will create a new market* | 1.8 | 1.8 | 2.2 |
| Financial return > 10 times within 10 years* | 2.9 | 3.4 | 2.9 |
| Investment is easily made liquid (e.g., made public or acquired)* | 2.7 | 3.2 | 2.7 |
| Financial return > 10 times within 5 years | 2.1 | 2.3 | 2.1 |
1 = irrelevant, 2 = desirable, 3 = important, 4 = essential.
*Denotes significance at the 0.05 level.
For example, in the early stages, many new ventures rely too much on a few major customers for sales and are, therefore, very vulnerable commercially. As an extreme example, around half of technology ventures rely on a single customer for more than half of their first-year sales. An overdependence on a small number of customers has three major drawbacks:
- Vulnerability to changes in the strategy and health of the dominant customer
- A loss of negotiating power, which may reduce profit margins
- Little incentive to develop marketing and sales functions, which may limit future growth
Therefore, it is essential to develop a better understanding of the market and technological inputs to a business plan. The financial estimates flow from these critical inputs relatively easily, although risk and uncertainty still need to be assessed. This chapter focuses only on the most important, but often poorly executed, aspects of business planning for innovations. We first discuss approaches to forecasting markets and technologies and then identify how a better understanding of the adoption and diffusion of innovations can help us to develop more successful business plans. Finally, we look at how to assess the risks and resources required to finalize a plan. We will return to the development of business plans in Chapter 12, in the specific context of new venture creation. Research Note 9.1 discusses the importance of articulating the early conceptual stages of innovative projects.
9.2 Forecasting Innovation
Forecasting the future has a pretty bad track record, but nevertheless has a central role in business planning for innovation. Case Study 9.1 provides some examples of poor forecasting. In most cases, the outputs, that is, the predictions made, are less valuable than the process of forecasting itself. If conducted in the right spirit, forecasting should provide a framework for gathering and sharing data, debating interpretations, and making assumptions, challenges, and risks more explicit.
The most appropriate choice of forecasting method will depend on the following:
- What we are trying to forecast
- Rate of technological and market change
- Availability and accuracy of information
- The company’s planning horizon
- The resources available for forecasting
In practice, there will be a trade-off between the cost and robustness of a forecast. The more common methods of forecasting such as trend extrapolation and time series are of limited use for new products, because of the lack of past data. However, regression analysis can be used to identify the main factors driving demand for a given product and therefore provide some estimate of future demand, given the data on the underlying drivers, as shown in Table 9.2.
TABLE 9.2 Types, Uses, and Limitations of Different Methods of Forecasting
| Method | Uses | Limitations |
| Trend extrapolation | Short-term, stable environment | Relies on past data and assumes past patterns |
| Product and technology road mapping | Medium-term, stable platform, and clear trajectory | Incremental, fails to identify future uncertainties |
| Regression, econometric models, and simulation | Medium-term, where the relationship between independent and dependent variables understood | Identification and behavior of independent variables limited |
| Customer and marketing methods | Medium-term, product attributes and market segments understood | Sophistication of users, limitation of tools to distinguish noise and information |
| Benchmarking | Medium-term, product and process improvement | Identifying relevant benchmarking candidates |
| Delphi and experts | Long-term, consensus building | Expensive, experts disagree or consensus wrong |
| Scenarios | Long-term, high uncertainty | Time-consuming, unpalatable outcomes |
For example, a regression might express the likely demand for the next generation of digital mobile phones in terms of rate of economic growth, price relative to competing systems, rate of new business formation, and so on. Data are collected for each of the chosen variables and coefficients for each derived from the curve that best describes the past data. Thus, the reliability of the forecast depends a great deal on selecting the right variables in the first place. The advantage of regression is that, unlike simple extrapolation or time-series analysis, the forecast is based on cause-and-effect relations. Econometric models are simply bundles of regression equations, including their interrelationship. However, regression analysis is of little use where future values of an explanatory value are unknown or where the relationship between the explanatory and forecast variables may change.
Leading indicators and analogs can improve the reliability of forecasts and are useful guideposts to future trends in some sectors. In both cases, there is a historical relationship between two trends. For example, new business start-ups might be a leading indicator of the demand for office equipment in 6 months’ time. Similarly, business users of mobile telephones may be an analog for subsequent patterns of domestic use.
Such “normative” techniques are useful for estimating the future demand for existing products, or perhaps alternative technologies or novel niches, but are of limited utility in the case of more radical systems innovation. Exploratory forecasting, in contrast, attempts to explore the range of future possibilities. The most common methods are as follows:
- Customer or market surveys
- Internal analysis, for example, brainstorming
- Delphi or expert opinion
- Scenario development
Customer or Market Surveys
Most companies conduct customer surveys of some sort. In consumer markets, this can be problematic simply because customers are unable to articulate their future needs. For example, Apple’s iPod was not the result of extensive market research or customer demand, but largely because of the vision and commitment of Steve Jobs. In industrial markets, customers tend to be better equipped to communicate their future requirements, and consequently, business-to-business innovations often originate from customers. Companies can also consult their direct sales force, but these may not always be the best guide to future customer requirements. Information is often filtered in terms of existing products and services and biased in terms of current sales performance rather than long-term development potential.
There is no “one best way” to identify novel niches, but rather a range of alternatives. For example, where new products or services are very novel or complex, potential users may not be aware of, or able to articulate, their needs. In such cases, traditional methods of market research are of little use, and there will be a greater burden on developers of radical new products and services to “educate” potential users.
Our own research confirms that different managerial processes, structures, and tools are appropriate for routine and novel development projects [3]. We discuss this in detail in Chapter 9, when we examine new product and service development. For example, in terms of frequency of use, the most common methods used for high-novelty projects are segmentation, prototyping, market experimentation, and industry experts, whereas for the less novel projects, the most common methods are partnering customers, trend extrapolation, and segmentation. The use of market experimentation and industry experts might be expected where market requirements or technologies are uncertain, but the common use of segmentation for such projects is harder to justify. However, in terms of usefulness, there are statistically significant differences in the ratings for segmentation, prototyping, industry experts, market surveys, and latent needs analysis. Segmentation is more effective for routine development projects; and prototyping, industry experts, focus groups, and latent needs analysis are all more effective for novel development projects [4]. Research Note 9.2 identifies the factors that influence the accuracy of predictions of new product sales.
Internal Analysis, for Example, Brainstorming
Structured idea generation, or brainstorming, aims to solve specific problems or to identify new products or services. Typically, a small group of experts are gathered together and allowed to interact. A chairman records all suggestions without comment or criticism. The aim is to identify, but not evaluate, as many opportunities or solutions as possible. Finally, members of the group vote on the different suggestions. The best results are obtained when representatives from different functions are present, but this can be difficult to manage. Brainstorming does not produce a forecast as such, but can provide useful input to other types of forecasting.
We discussed a range of approaches to creative problem-solving and idea generation in Chapter 3. Most of these are relevant here and include ways of [5]:
- Understanding the problem – the active construction by the individual or group through analyzing the task at hand (including outcomes, people, context, and methodological options) to determine whether and when deliberate problem-structuring efforts are needed. This stage includes constructing opportunities, exploring data, and framing problems.
- Generating ideas – to create options in answer to an open-ended problem. This includes generating and focusing phases. During the generating phase of this stage, the person or group produces many options (fluent thinking), a variety of possible options (flexible thinking), novel or unusual options (original thinking), or a number of detailed or refined options (elaborative thinking). The focusing phase provides an opportunity for examining, reviewing, clustering, and selecting promising options.
- Planning for action – is appropriate when a person or group recognizes a number of interesting or promising options that may not necessarily be useful, valuable, or valid. The aim is to make or develop effective choices and to prepare for successful implementation and social acceptance.
External Assessment, for Example, Delphi
The opinion of outside experts, or Delphi method, is useful where there is a great deal of uncertainty or for long-time horizons [6]. Delphi is used where a consensus of expert opinion is required on the timing, probability, and identification of future technological goals or consumer needs and the factors likely to affect their achievement. It is best used in making long-term forecasts and revealing how new technologies and other factors could trigger discontinuities in technological trajectories. The choice of experts and the identification of their level and area of expertise are important; the structuring of the questions is even more important. The relevant experts may include suppliers, dealers, customers, consultants, and academics. Experts in nontechnological fields can be included to ensure that trends in economic, social, and environmental fields are not overlooked.
The Delphi method begins with a postal survey of expert opinion on what the future key issues will be and the likelihood of the developments. The response is then analyzed, and the same sample of experts resurveyed with a new, more focused questionnaire. This procedure is repeated until some convergence of opinion is observed or, conversely, if no consensus is reached. The exercise usually consists of an iterative process of questionnaire and feedback among the respondents; this process finally yields a Delphi forecast of the range of experts’ opinions on the probabilities of certain events occurring by a quoted time. The method seeks to nullify the disadvantage of face-to-face meetings at which there could be deference to authority or reputation, a reluctance to admit error, a desire to conform or differences in persuasive ability. All of these could lead to an inaccurate consensus of opinion. The quality of the forecast is highly dependent on the expertise and caliber of the experts; how the experts are selected and how many should be consulted are important questions to be answered. If international experts are used, the exercise can take a considerable length of time, or the number of iterations may have to be curtailed. Although seeking a consensus may be important, adequate attention should be paid to views that differ radically “from the norm” as there may be important underlying reasons to justify such maverick views. With sufficient design, understanding, and resources, most of the shortcomings of the Delphi technique can be overcome, and it is a popular technique, particularly for national foresight programs.
In Europe, governments and transnational agencies use Delphi studies to help formulate policy, usually under the guise of “Foresight” exercises. In Japan, large companies and the government routinely survey expert opinion in order to reach some consensus in those areas with the greatest potential for long-term development. Used in this way, the Delphi method can, to a large extent, become a self-fulfilling prophecy.
Scenario Development
Scenarios are internally consistent descriptions of alternative possible futures, based upon different assumptions and interpretations of the driving forces of change [7]. Inputs include quantitative data and analysis and qualitative assumptions and assessments, such as societal, technological, economic, environmental, and political drivers. Scenario development is not strictly speaking prediction, as it assumes that the future is uncertain and that the path of current developments can range from the conventional to the revolutionary. It is particularly good at incorporating potential critical events, which might result in divergent paths or branches being pursued.
Scenario development can be normative or explorative. The normative perspective defines a preferred vision of the future and outlines different pathways from the goal to the present. For example, this is commonly used in energy futures and sustainable futures scenarios. The explorative approach defines the drivers of change and creates scenarios from these without explicit goals or agendas.
For scenarios to be effective, they need to inclusive, plausible, and compelling (as opposed to being exclusive, implausible, or obvious), as well as being challenging to the assumptions of the stakeholders. They should make the assumptions and inputs used explicit and form the basis of a process of discussion, debate, policy, strategy, and ultimately action. The output is typically two or three contrasting scenarios, but the process of development and discussion of scenarios is much more valuable.
Scenario development may involve many different forecasting techniques, including computer-based simulation. Typically, it begins with the identification of the critical indicators, which might include use of brainstorming and Delphi techniques. Next, the reasons for the behavior of these indicators is examined, perhaps using regression techniques. The future events that are likely to affect these indicators are identified. These are used to construct the best, worst, and most-likely future scenarios. Finally, the company assesses the impact of each scenario on its business. The goal is to plan for the outcome with the greatest impact or, better still, retain sufficient flexibility to respond to several different scenarios. Scenario development is a key part of the long-term planning process in those sectors characterized by high capital investment, long lead times, and significant environmental uncertainty, such as energy, aerospace, and telecommunications. Case Study 9.2 shows how a large IT company uses scenario planning.
9.3 Estimating the Adoption of Innovations
A better understanding of why and how innovations are adopted (or not) can help us to develop more realistic plans. As the Research Note 9.3 demonstrates, there is a chasm between the development of and successful widespread adoption of an innovation. Conventional marketing approaches are fine for many products and services, but not for innovations. Marketing texts often refer to “early adopters” and “majority adopters” and even go so far as to apply numerical estimates of these, but these simple categories are based on the very early studies of the state-sponsored diffusion of hybrid-seed varieties in farming communities and are far from universally applicable. To better plan for innovations, we need a deeper understanding of what factors promote and constrain adoption and how these influence the rate and level of diffusion within different markets and populations.
There are many barriers to the widespread adoption of innovations, including the following:
- Economic – personal costs versus social benefits, access to information, insufficient incentives
- Behavioral – priorities, motivations, rationality, inertia, propensity for change or risk
- Organizational – goals, routines, power and influence, culture and stakeholders
- Structural – infrastructure, sunk costs, governance
For these reasons, historically, large, complex sociotechnical systems tend to change only incrementally. However, more radical transformations can occur, but these often begin in strategic niches, with different goals, needs, practices, and processes. As these niches demonstrate and develop the innovations, through social experimentation and learning, they may begin to influence or enter the mainstream. This may be through whole new market niches or by forming hybrid markets between the niche and mainstream.
Diffusion usually involves the analysis of the spread of a product or idea in a given social system, whereas technology transfer is usually a point-to-point phenomenon. Technology transfer usually implies putting information to use or, more specifically, moving ideas from the laboratory to the market. The distinction between adoption, implementation, and utilization is less clear. Adoption is generally considered to be the decision to acquire something, whereas implementation and utilization imply some action and adaptation.
The literature on diffusion is vast and highly fragmented. However, a number of different approaches to diffusion research can be identified, each focusing on particular aspects of diffusion and adopting different methodologies. The main contributions have been from economics, marketing, sociology, and anthropology. Economists have developed a number of econometric models on the diffusion of new products and processes in an effort to explain past behavior and to predict future trends. Prediction is a common theme of the marketing literature. Marketing studies have adopted a wide range of different research instruments to examine buyer behavior, but most recent research has focused on social and psychological factors. Development economics and rural sociology have both examined the adoption of agricultural innovations, using statistical analysis of secondary data and collection of primary data from surveys. Much of the anthropological research has been based on case studies of the diffusion of new ideas in tribes, villages, or communities. Most recently, there has been a growing number of multidisciplinary studies that have examined the diffusion of educational, medical, and other policy innovations.
Processes of Diffusion
Research on diffusion attempts to identify what influences the rate and direction of adoption of an innovation. The diffusion of an innovation is typically described by an S-shaped (logistic) curve, as shown in Figure 9.1. Initially, the rate of adoption is low, and adoption is confined to the so-called innovators. Next to adopt are the “early adopters,” then the “late majority,” and finally, the curve tails off as only the “laggards” remain. Such taxonomies are fine with the benefit of hindsight, but provide little guidance for future patterns of adoption [8].
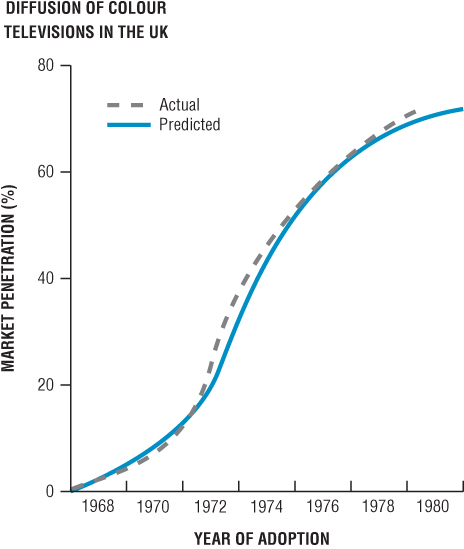
FIGURE 9.1 Typical diffusion S-curve for the adoption of an innovation.
Source: Meade, N. and T. Islam, Modeling and forecasting the diffusion of innovation – A 25 year review, International Journal of Forecasting, 2006. 22(3), 519–545.
Hundreds of marketing studies have attempted to fit the adoption of specific products to the S-curve, ranging from television sets to new drugs. In most cases, mathematical techniques can provide a relatively good fit with historical data, but research has so far failed to identify robust generic models of adoption. In practice, the precise pattern of adoption of an innovation will depend on the interaction of demand-side and supply-side factors:
- Demand-side factors – direct contact with or imitation of prior adopters, adopters with different perceptions of benefits and risk
- Supply-side factors – relative advantage of an innovation, availability of information, barriers to adoption, feedback between developers and users
The epidemic S-curve model is the earliest and is still the most commonly used. It assumes a homogeneous population of potential adopters and that innovations spread by information transmitted by personal contact, observation, and the geographical proximity of existing and potential adopters. This model suggests that the emphasis should be on communication and the provision of clear technical and economic information. However, the epidemic model has been criticized because it assumes that all potential adopters are similar and have the same needs, which is unrealistic.
The Probit model takes a more sophisticated approach to the population of potential adopters. It assumes that potential adopters have different threshold values for costs or benefits and will only adopt beyond some critical or threshold value. In this case, differences in threshold values are used to explain different rates of adoption. This suggests that the more similar potential adopters are, the faster the diffusion.
However, adopters are assumed to be relatively homogeneous, apart from some difference in progressiveness or threshold values. Supply-side models do not consider the possibility that the rationality and the profitability of adopting a particular innovation might be different for different adopters. For example, local “network externalities” such as the availability of trained skilled users, technical assistance and maintenance, or complementary technical or organizational innovations are likely to affect the cost of adoption and use, as distinct from the cost of purchase.
Also, it is unrealistic to assume that adopters will have perfect knowledge of the value of an innovation. Therefore, Bayesian models of diffusion introduce lack of information as a constraint to diffusion. Potential adopters are allowed to hold different beliefs regarding the value of the innovation, which they may revise according to the results of trials to test the innovation. Because these trials are private, imitation cannot take place and other potential adopters cannot learn from the trials. This suggests that better-informed potential adopters may not necessarily adopt an innovation earlier than the less well informed, which was an assumption of earlier models [9].
Slightly more realistic assumptions, such as those of the Bass model, include two different groups of potential adopters: innovators, who are not subject to social emulation; and imitators, for whom the diffusion process takes the epidemic form. This produces a skewed S-curve because of the early adoption by innovators and suggests that different marketing processes are needed for the innovators and subsequent imitators. The Bass model is highly influential in economics and marketing research, and the distinction between the two types of potential adopters is critical in understanding the different mechanisms involved in the two user segments.
Bandwagons may occur where an innovation is adopted because of pressure caused by the sheer number of those who have already adopted an innovation, rather than by individual assessments of the benefits of an innovation. In general, as soon as the number of adopters has reached a certain threshold level, the greater the level of ambiguity of the innovation’s benefits, the greater the subsequent number of adopters. This process allows technically inefficient innovations to be widely adopted or technically efficient innovations to be rejected. Examples include the QWERTY keyboard, originally designed to prevent professional typists from typing too fast and jamming typewriters, and the DOS operating system for personal computers, designed by and for computer enthusiasts.
Bandwagons occur due to a combination of competitive and institutional pressures [10]. Where competitors adopt an innovation, a firm may adopt because of the threat of lost competitiveness, rather than as a result of any rational evaluation of benefits. For example, many firms adopted flexible manufacturing systems (FMS) in the 1980s in response to increased competition, but most failed to achieve significant benefits. The main institutional pressure is the threat of lost legitimacy, for example, being considered by peers or customers as being less progressive or competent [11].
The critical difference between bandwagons and other types of diffusion is that they require only limited information to flow from early to later adopters. Indeed, the more ambiguous the benefits of an innovation, the more significant bandwagons are on rates of adoption. Therefore, the process of diffusion must be managed with as much care as the process of development. In short, better products do not necessarily result in more sales. Not everybody requires a better mousetrap.
Finally, there are more sociological and psychological models of adoption, which are based on interaction and feedback between the developers and potential adopters [12]. These perspectives consider how individual psychological characteristics such as attitude and perception affect adoption. Individual motivations, perceptions, likes, and dislikes determine what information is reacted to and how it is processed. Potential adopters will be guided and prejudiced by experience and will have “cognitive maps,” which filter information and guide behavior. Social context will also influence individual behavior. Social structures and meaning systems are locally constructed and therefore highly context-specific. These can distort the way in which information is interpreted and acted upon. Therefore, the perceived value of an innovation, and hence its subsequent adoption, is not some objective fact, but instead depends on individual psychology and social context. These factors are particularly important in the later stages of diffusion. For example, lifestyle aspirations, such as having more exercise and adopting an healthy diet, have created the opportunity for many new products and services.
Initially, the needs of early adopters or innovators dominate, and therefore, the characteristics of an innovation are most important. Innovations tend to evolve over time through improvements required by these early users, which may reduce the relative cost to later adopters. However, early adopters are almost by definition “atypical,” for example, they tend to have superior technical skills. As a result, the preferences of early adopters can have a disproportionate impact on the subsequent development of an innovation and result in the establishment of inferior technologies or abandonment of superior alternatives. Research Note 9.4 examines the roles of early adopters and opinion leaders in the adoption of innovations.
Factors Influencing Adoption
Numerous variables have been identified as affecting the diffusion and adoption of innovations, but these can be grouped into three clusters: characteristics of the innovation itself, characteristics of individual or organizational adopters, and the characteristics of the environment. Characteristics of an innovation found to influence adoption include relative advantage, compatibility, complexity, observability, and trialability. Individual characteristics include age, education, social status, and attitude to risk. Environmental and institutional characteristics include economic factors such as the market environment and sociological factors such as communications networks. However, while there is a general agreement regarding the relevant variables, there is very little consensus on the relative importance of the different variables and, in some cases, disagreements over the direction of relationships. Case Study 9.3 identifies factors that have promoted and hindered the adoption of the Internet in China.
Characteristics of an Innovation
A number of characteristics of an innovation have been found to affect diffusion and adoption:
- Relative advantage
- Compatibility
- Complexity
- Trialability
- Observability
Relative Advantage
Relative advantage is the degree to which an innovation is perceived as better than the product it supersedes or competing products. Relative advantage is typically measured in narrow economic terms, for example, cost or financial payback, but noneconomic factors such as convenience, satisfaction, and social prestige may be equally important. In theory, the greater the perceived advantage, the faster the rate of adoption.
It is useful to distinguish between the primary and secondary attributes of an innovation. Primary attributes, such as size and cost, are invariant and inherent to a specific innovation irrespective of the adopter. Secondary attributes, such as relative advantage and compatibility, may vary from adopter to adopter, being contingent upon the perceptions and context of adopters. In many cases, a so-called attribute gap will exist. An attribute gap is the discrepancy between a potential user’s perception of an attribute or characteristic of an item of knowledge and how the potential user would prefer to perceive that attribute. The greater the sum of all attribute gaps, the less likely a user is to adopt the knowledge. This suggests that preliminary testing of an innovation is desirable in order to determine whether significant attribute gaps exist. Not all attribute gaps require changes to the innovation itself – a distinction needs to be made between knowledge content and knowledge format. The idea of pretesting information for the purposes of enhancing its value and acceptance is not widely practiced.
Compatibility
Compatibility is the degree to which an innovation is perceived to be consistent with the existing values, experience, and needs of potential adopters. There are two distinct aspects of compatibility: existing skills and practices; values and norms. The extent to which the innovation fits the existing skills, equipment, procedures, and performance criteria of the potential adopter is important and relatively easy to assess.
However, compatibility with existing practices may be less important than the fit with existing values and norms [13]. Significant misalignments between an innovation and an adopting organization will require changes in the innovation or organization or both. In the most successful cases of implementation, mutual adaptation of the innovation and organization occurs [14]. However, few studies distinguish between compatibility with value and norms and compatibility with existing practices. The extent to which the innovation fits the existing skills, equipment, procedures, and performance criteria of the potential adopter is critical. Few innovations initially fit the user environment into which they are introduced. Significant misalignments between the innovation and the adopting organization will require changes in the innovation or organization or, in the most successful cases of implementation, mutual adaptation of both. Initial compatibility with existing practices may be less important, as it may provide limited opportunity for mutual adaptation to occur.
Complexity
Complexity is the degree to which an innovation is perceived as being difficult to understand or use. In general, innovations that are simpler for potential users to understand will be adopted more rapidly than those that require the adopter to develop new skills and knowledge.
However, complexity can also influence the direction of diffusion. Evolutionary models of diffusion focus on the effect of “network externalities,” that is, the interaction of consumption, pecuniary, and technical factors, which shape the diffusion process. For example, within a region, the cost of adoption and use, as distinct from the cost of purchase, may be influenced by: the availability of information about the technology from other users, of trained skilled users, of technical assistance and maintenance, and of complementary innovations, both technical and organizational.
Trialability
Trialability is the degree to which an innovation can be experimented with on a limited basis. An innovation that is trialable represents less uncertainty to potential adopters and allows learning by doing. Innovations that can be trialed will generally be adopted more quickly than those that cannot. The exception is where the undesirable consequences of an innovation appear to outweigh the desirable characteristics. In general, adopters wish to benefit from the functional effects of an innovation, but avoid any dysfunctional effects. However, where it is difficult or impossible to separate the desirable from the undesirable consequences, trialability may reduce the rate of adoption.
Developers of an innovation may have two different motives for involving potential users in the development process. First, to acquire knowledge from the users needed in the development process, to ensure usability, and to add value. Second, to attain user “buy-in,” that is, user acceptance of the innovation and commitment to its use. The second motive is independent of the first, because increasing user acceptance does not necessarily improve the quality of the innovation. Rather, involvement may increase user’s tolerance of any inadequacies. In the case of point-to-point transfer, typically both motives are present.
However, in the case of diffusion, it is not possible to involve all potential users, and therefore, the primary motive is to improve usability rather than attain user buy-in. But even the representation of user needs must be indirect, using surrogates such as specially selected user groups. These groups can be problematic for a number of reasons. First, because they may possess atypically high levels of technical knowledge and therefore are not representative. Second, where the group must represent diverse user needs, such as both experienced and novice users, the group may not work well together. Finally, when user representatives work closely with developers over a long period of time, they may cease to represent users and instead absorb the developer’s viewpoint. Thus, there is no simple relationship between user involvement and user satisfaction. Typically, very low levels of user involvement are associated with user dissatisfaction, but extensive user involvement does not necessarily result in user satisfaction.
Observability
Observability is the degree to which the results of an innovation are visible to others. The easier it is for others to see the benefits of an innovation, the more likely it will be adopted. The simple epidemic model of diffusion assumes that innovations spread as potential adopters come into contact with existing users of an innovation.
Peers who have already adopted an innovation will have what communication researchers call “safety credibility,” because potential adopters seeking their advice will believe they know what it is really like to implement and utilize the innovation. Therefore, early adopters are well positioned to disseminate “vicarious learning” to their colleagues. Vicarious learning is simply learning from the experience of others, rather than direct personal experimental learning. However, the process of vicarious learning is neither inevitable nor efficient because, by definition, it is a decentralized activity. Centralized systems of dissemination tend to be designed and rewarded on the basis of being the source of technical information, rather than for facilitating learning among potential adopters.
Over time, learning and selection processes foster both the evolution of the technologies to be adopted and the characteristics of actual and potential adopters. Thus, an innovation may evolve over time through improvements made by early users, thereby reducing the relative cost to later adopters. In addition, where an innovation requires the development of complementary features, for example, a specific infrastructure, late adopters will benefit. This suggests that instead of a single diffusion curve, a series of diffusion curves will exist for the different environments. However, there is a potential drawback to this model. The short-term preferences of early adopters will have a disproportionate impact on the subsequent development of the innovation and may result in the establishment of inferior technologies and abandonment of superior alternatives. In such cases, interventionalist policies may be necessary to postpone the lock-in phenomenon.
From a policy perspective, high visibility is often critical. However, high visibility, at least initially, may be counter-productive. If users’ expectations about an innovation are unrealistically high and adoption is immediate, subsequent disappointment is likely. Therefore, in some circumstances, it may make sense to delay dissemination or to slow the rate of adoption. However, in general, researchers and disseminators are reluctant to withhold knowledge.
The choice between the different models of diffusion and factors that will most influence adoption will depend on the characteristics of the innovation and nature of potential adopters. The simple epidemic model appears to provide a good fit to the diffusion of new processes, techniques, and procedures, whereas the Bass model appears to best fit the diffusion of consumer products. However, the mathematical structure of the epidemic and Bass models tends to overstate the importance of differences in adopter characteristics and tends to underestimate the effect of macroeconomic and supply-side factors. In general, both these models of diffusion work best where the total potential market is known, that is, for derivatives of existing products and services, rather than totally new innovations.
In the case of systemic or network innovations, a wider range of factors have to be managed to promote adoption and diffusion. In such cases, a wider set of actors and institutions on the supply and demand side are relevant, in what has been called an adoption network [15]. On the supply side, other organizations may provide the infrastructure, support, and complementary products and services, which can promote or prevent adoption and diffusion. For example, the 2-year battle between the new high-definition DVD formats was decided not by price or any technical superiority, but rather because the Blu-ray consortium managed to recruit more film studios to its format than the competing HD-DVD format. As soon as the uncertainty over the future format was resolved, there was a step change increase in the rate of adoption. Case Study 9.4 discusses the role of social media in the adoption of innovations.
On the demand side, the uncertainty of potential adopters and communication with and between them needs to be managed. While early adopters may emphasize technical performance and novelty above other factors, the mainstream mass market is more likely to be concerned with factors such as price, quality, convenience, and support. This transition from the niche market and needs of early adopters, through to the requirements of more mass markets has been referred to as crossing the chasm by Moore [16]. Moore studied the successes and many more failures of Silicon Valley and other high-technology products and argued that the critical success factors for early adopters and mass markets were fundamentally different, and most innovations failed to make this transition. Therefore, the successful launch and diffusion of a systemic or network innovation demands attention to traditional marketing issues such as the timing and positioning of the product or service [17], but also significant effort to demand-side factors such as communication and interactions between potential adopters [18].
The continued improvement in health in the advanced economies over the past 50 years can be attributed in part to the supply of new diagnostic techniques, drugs, and procedures, but also to changes in the demand side, such as increases in education, income, and service infrastructure. However, the focus of innovation (and policy) in health care is too often on the development and commercialization of new pharmaceuticals, but this is only a part of the story. This is a clear case of systemic innovation, in which firm and public R&D are necessary, but not sufficient to promote improved health. The adoption network includes regulatory bodies, national health assessment and reference pricing schemes, regional health agencies, public and private insurers, as well as the more obvious hospitals, doctors, nurses, and patients [19]. However, too often the management and policy for innovation in health are confined to regulation of prices and effects of intellectual property regimes [20]. There is a clear need for new methods of interaction, involvement, and engagement in such cases [21].
Diffusion research and practice have been criticized for an increasingly limited scope and methodology. Rogers identifies a number of shortcomings of research and practice:
- Diffusion has been seen as a linear, unidirectional communication activity in which the active source of research or information attempts to influence the attitudes and/or behaviors of essentially passive receivers. However, in most cases, diffusion is an interactive process of adaptation and adoption.
- Diffusion has been viewed as a one-to-many communication activity, but point-to-point transfer is also important. Both centralized and decentralized systems exist. Decentralized diffusion is a process of convergence as two or more individuals exchange information in order to move toward each other in the meanings they ascribe to certain events.
- Diffusion research has been preoccupied with an action-entered and issue-entered communication activity, such as selling products, actions, or policies. However, diffusion is also a social process, affected by social structure and position and interpersonal networks.
- Diffusion research has used adoption as the dependent variable – the decision to use the innovation, rather than implementation itself – the consequences of the innovation. Most studies have used attitudinal change as the dependent variable, rather than change in overt behavior.
- Diffusion research has suffered from an implicit proinnovation bias, which assumes that an innovation should be adopted by all members of a social system as rapidly as possible. Therefore, the process of adaptation or rejection of an innovation has been overlooked, and there have been relatively few studies of how to prevent the diffusion “bad” innovations.
Research Note 9.5 explores the reasons why some innovations fail to be adopted.
9.4 Assessing Risk, Recognizing Uncertainty
Dealing with risk and uncertainty is central to the assessment of most innovative projects. Risk is usually considered to be possible to estimate, either qualitatively – high, medium, low – or ideally by probability estimates. Uncertainty is by definition unknowable, but nonetheless, the fields and degree of uncertainty should be identified to help to select the most appropriate methods of assessment and plan for contingencies. Traditional approaches to assessing risk focus on the probability of foreseeable risks, rather than true uncertainty, or complete ignorance – what Donald Rumsfeld memorably called the “unknown unknowns” (12 February, US Department of Defense news briefing).
Research on new product development and R&D project management has identified a broad range of strategies for dealing with risk. Both individual characteristics and organizational climate influence perceptions of risk and propensities to avoid, accept, or seek risks. Formal techniques such as failure mode and effects analysis (FMEA), potential problem analysis (PPA), and fault tree analysis (FTA) have a role, but the broader signals and support from the organizational climate are more important than the specific tools or methods used. For example, too many organizations emphasize project management in order to contain internal risks in the organization, but as a result fail to identify or exploit opportunities to take acceptable risks and to innovate [22].
There are many approaches to risk assessment, but the most common issues to be managed include the following:
- Probabilistic estimates of technical and commercial success
- Psychological (cognitive) and sociological perceptions of risk
- Political and policy influences, such as the “precautionary principle”
Risk as Probability
Research indicates that 30–45% of all projects fail to be completed, and over half of the projects overrun their budgets or schedules by up 200%. Figure 9.2 presents the results of a survey of R&D managers. While most appear to be relatively confident when predicting technical issues such as the development time and costs, a much smaller proportion are confident when forecasting commercial aspects of the projects.
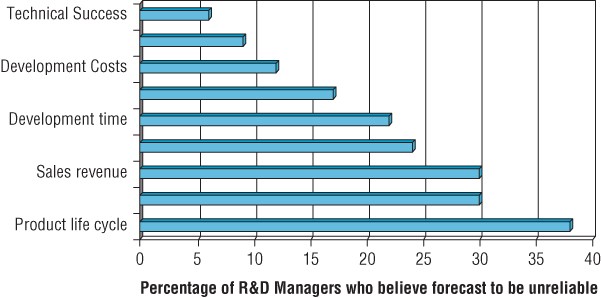
FIGURE 9.2 Uncertainty in project planning.
Source: Based on data from Freeman, C. and L. Soete, The economics of innovation, 1997, MIT Press, Cambridge, MA.
We examined how commonly different approaches to project assessment were used in practice. We surveyed 50 projects in 25 companies and assessed how often different criteria were used and how useful they were thought to be. Table 9.3 summarizes some of the results. Clearly, probabilistic estimates of technical and commercial success are near universal and considered to be of critical importance in all types of project assessment. These are usually combined with some form of financial assessment and fit with the company strategy and capabilities.
TABLE 9.3 Use and Usefulness of Criteria Project Screening and Selection
Source: Adapted from Tidd, J. and K. Bodley, Effect of novelty on new product development processes and tools. R&D Management, 2002. 32(2), 127–38.
| High Novelty | Low Novelty | |||
| Usage (%) | Usefulness | Usage (%) | Usefulness | |
| Probability of technical success | 100 | 4.37 | 100 | 4.32 |
| Probability of commercial success | 100 | 4.68 | 95 | 4.50 |
| Market share* | 100 | 3.63 | 84 | 4.00 |
| Core competencies* | 95 | 3.61 | 79 | 3.00 |
| Degree of internal commitment | 89 | 3.82 | 79 | 3.67 |
| Market size | 89 | 3.76 | 84 | 3.94 |
| Competition | 89 | 3.76 | 84 | 3.81 |
| NPV/IRR | 79 | 3.47 | 68 | 3.92 |
| Payback period/break-even* | 79 | 3.20 | 58 | 4.27 |
Usefulness score: 5 = critical; 0 = irrelevant.
*denotes difference in usefulness rating is statistically significant at 5% level.
Given the complexities involved, the outcomes of investments in innovation are uncertain, so that the forecasts (of costs, prices, sales volume, etc.) that underlie project and program evaluations can be unreliable. According to Joseph Bower, management finds it easier, when appraising investment proposals, to make more accurate forecasts of reductions in production cost than of expansion in sales, while their ability to forecast the financial consequences of new product introductions is very limited indeed [23]. This last conclusion is confirmed by the study by Edwin Mansfield and his colleagues of project selection in large US firms [24]. By comparing project forecasts with outcomes, Mansfield showed that managers find it difficult to pick technological and commercial winners:
- Probability of technical success of projects (Pt) = 0.80
- Subsequent probability of commercial success (Pc) = 0.20
- Combined probability for all stages: 0.8 × 0.2 = 0.16
He also found that managers and technical managers cannot accurately predict the development costs, time periods, markets, and profits of R&D projects. On average, costs were greatly underestimated, and time periods overestimated by 140–280% in incremental product improvements and by 350–600% in major new products. Other studies have found the following:
- About half of the business R&D expenditures are on failed R&D projects. The higher rate of success in expenditures than in projects reflects the weeding out of unsuccessful projects at their early stages and before large-scale commercial commitments are made to them [25].
- R&D scientists and engineers are often deliberately overoptimistic in their estimates, in order to give the illusion of a high rate of return to accountants and managers [26].
Trying to get involved in the right projects is worth an effort, both to avoid wasting time and resources in meaningless activities and to improve the chances of success. Project appraisal and evaluation aim to:
- Profile and gain an overall understanding of potential projects.
- Prioritize a given set of projects, and where necessary, reject projects.
- Monitor projects, for example, by following up the criteria chosen when the project was selected.
- Where necessary, terminate a project.
- Evaluate the results of completed projects.
- Review successful and unsuccessful projects to gain insights and improve future project management, that is, learning.
Project evaluation usually assumes that there is a choice of projects to pursue, but where there is no choice project evaluation is still important to help to assess the opportunity costs and what might be expected from pursuing a project. Different situations and contexts demand different approaches to project evaluation. We argued earlier that complexity and uncertainty are two of the most important dimensions for assessing projects. Different types of project will demand specific techniques or at least different criteria for assessment.
A large number of techniques have been developed over the years and are still being developed and used today. Most of these can be described by means of some common elements that form the core of any project evaluation technique:
- Inputs into the assessment include likely costs and benefits in financial terms, probability of technical and market success, market attractiveness, and the strategic importance to the organization.
- Weighting gives certain data more relevance than other (e.g., of market inputs compared with technical factors), in order to reflect the company’s strategy or the company’s particular views. The data is then processed to arrive at the outcomes.
- Balancing a range of projects, as the relative value of a project with respect to other projects is an important factor in situations of competition for limited resources. Portfolio management techniques are specifically devoted to deal with this factor.
Economic and cost–benefit approaches are usually based on a combination of expected utility or Bayesian assumptions. Expected utility theory can take into account probabilistic estimates and subjective preferences, and therefore it deals well with risk aversion, but in practice, utility curves are almost impossible to construct, and individual preferences are different and highly subjective. Bayesian probability is excellent at incorporating the effects of new information, as we discussed earlier under the diffusion of innovations, but is very sensitive to the choice of relevant inputs and the weights attached to these.
As a result, no technique should be allowed to determine outcomes, as these decisions are a management responsibility. Many techniques used today are totally or partially software based, which have some additional benefits in automating the process. In any case, the most important issue, for any method, is the managers’ interpretation.
There is no single “best” technique. The extent to which different techniques for project evaluation can be used will depend upon the nature of the project, the information availability, the company’s culture, and several other factors. This is clear from the variety of techniques that are theoretically available and the extent to which they have been used in practice. In any case, no matter which technique is selected by a company, it should be implemented, and probably adapted, according to the particular needs of that organization. Most of the techniques in practical use incorporate a mixture of financial assessment and human judgment.
Perceptions of Risk
Probability estimates are only the starting point of risk assessment. Such relatively objective criteria are usually significantly moderated by psychological (cognitive) perceptions and bias, or overwhelmed altogether by sociological factors, such as peer pressure and cultural context. Studies suggest that different people (and animals) have different perceptions and tolerances for risk-taking. For example, a study comparing the behaviors of chimpanzees and bonobo apes found that the chimps were more prepared to gamble and take risks [27]. At first sight, this appears to support the personality explanation for risk-taking, but actually the two types of apes share more than 99% of their DNA. A more likely explanation is the very different environments in which they have evolved: in the chimp environment, food is scarce and uncertain, but in the bonobo habitats, food is plentiful. We are not suggesting that entrepreneurs are chimp-like, or accountants are ape-like, but rather that experience and context have a profound influence on the assessment of, and appetite for, risk.
At the individual, cognitive level, risk assessment is characterized by overconfidence, loss aversion, and bias [28]. Overconfidence in our ability to make accurate assessments is a common failing and results in unrealistic assumptions and uncritical assessment. Loss aversion is well documented in psychology and essentially means that we tend to prefer to avoid loss rather than to risk gain. Finally, cognitive bias is widespread and has profound implications for the identification and assessment of risk. Cognitive bias results in us seeking and overemphasizing evidence that supports our beliefs and reinforces our bias, but, at the same time, leads us to avoid and undervalue any information that contradicts our view [29]. Therefore, we need to be aware of and challenge our own biases and encourage others to debate and critique our data, methods, and decisions.
Studies of research and development confirm that measures of cognitive ability are associated with project performance. In particular, differences in reflection, reasoning, interpretation, and sense making influence the quality of problem formulation, evaluation and solution, and therefore, ultimately, the performance of research and development. A common weakness is the oversimplification of problems characterized by complexity or uncertainty and the simplification of problem framing and evaluation of alternatives [30]. This includes adopting a single prior hypothesis, selective use of information that supports this, and devaluing alternatives, and illusion of control and predictability. Similarly, marketing managers are likely to share similar cognitive maps and make the same assumptions concerning the relative importance of different factors contributing to new product success, such as the degree of customer orientation versus competitor orientation, and the implications of relationship between these factors, such as the degree of inter-functional coordination [31]. So the evidence indicates the importance of cognitive processes at the senior management, functional, group, and individual levels of an organization. More generally, problems of limited cognition include [32] the following:
- Reasoning by analogy, which oversimplifies complex problems
- Adopting a single, prior hypothesis bias, even where information and trails suggest that this is wrong
- Limited problem set, the repeated use of a narrow problem-solving strategy
- Single outcome calculation, which focuses on a simple single goal and a course of action to achieve it, and denying value trade-offs
- Illusion of control and predictability, based on an overconfidence in the chosen strategy, a partial understanding of the problem and limited appreciation of the uncertainty of the environment
- Devaluation of alternatives, emphasizing negative aspects of alternatives
At the group or social level, other factors also influence our perception and response to risk. How managers assess and manage risk is also a social and political process. It is influenced by prior experience of risk, perceptions of capability, status and authority, and the confidence and ability to communicate with relevant people at the appropriate times [33]. In the context of managing innovation, risk is less about personal propensity for risk-taking or rational assessments of probability and more about the interaction of experience, authority, and context. In practice, managers deal with risk in different ways in different situations. General strategies include delaying or delegating decisions or sharing risk and responsibilities. Generally, when mangers are performing well, and achieving their targets, they have less incentive to take risks. Conversely, when under pressure to perform, managers will often accept higher risks, unless these threaten survival.
In most organizations, risk has become a negative term, something that should be minimized or avoided, and implies hazard or failure. This view, particularly common in the policy domain, is enshrined in the “precautionary principle” and the many regulatory regimes it has spawned, which, as the title suggests, wherever possible, promotes the avoidance of risk-taking [34].
However, this interpretation perverts the nature of risk and opportunity, which are central to successful innovation, and promotes inaction and the status quo, rather than improvement or change. The term “risk” is derived from the Latin “to dare,” but has become associated with hazard or danger. We must also consider the “risk” of success or risks associated with not changing [35]. Berglund provides a good working definition of risk in the context of innovation, as “the pursuit of perceived opportunities under conditions of uncertainty” [36].
In a corporate context, he identifies three aspects of risk that need to be managed:
- Compliance with formal project and process requirements, rather than innovation outcomes
- Internal control and autonomy and influence and use of external expertise
- Flexibility of the business model and experimentation with alternative configurations and organization
In any large organization, there will be formal process and project requirements. However, these may conflict with the goals of innovation. Risk-taking requires a degree of tolerance of uncertainty and ambiguity in the workplace. In the high risk-taking climate, bold new initiatives can be taken even when the outcomes are unknown. People feel that they can “take a gamble” on some of their ideas. People will often “go out on a limb” and be first to put an idea forward. In a risk-avoiding climate, there is a cautious, hesitant mentality. People try to be on the “safe side.” They decide “to sleep on the matter.” They set up committees, and they cover themselves in many ways before making a decision. When risk-taking is too low, employees offer few new ideas or few ideas that are well outside of what is considered safe or ordinary. In risk-avoiding organizations, people complain about boring, low-energy jobs and are frustrated by a long, tedious process used to get ideas to action. These conditions can be caused by the organization not valuing new ideas or having an evaluation system that is bureaucratic, or people being punished for “drawing outside the lines.” It can be remedied by developing a company plan that would speed “ideas to action.” When risk-taking is too high, you will see that people are confused. There are many ideas floating around, but few are sanctioned. People are frustrated because nothing is getting done. There are many loners doing their own thing in the organization and no evidence of teamwork. These conditions can be caused by individuals not feeling they need a consensus or buy-in from others on their team in their department or organization. A remedy might include some team building and improving the reward system to encourage cooperation rather than individualism or competition [5].
A recent study of organizational innovation and performance confirms the need for this delicate balance between risk and stability. Risk-taking is associated with a higher relative novelty of innovation (how different it was to what the organization had done before), and absolute novelty (how different it was to what any organization had done before), and that both types of novelty are correlated with financial and customer benefits [37]. However, the same study concludes that “incremental, safe, widespread innovations may be better for internal considerations, but novel, disruptive innovations may be better for market considerations … absolute novelty benefits customers and quality of life, relative innovation benefits employee relations (but) risk is detrimental to employee relations.” In fact, many of the critical risks that need to be identified and managed are internal to organizations, rather than the more obviously anticipated external risks such as markets, competition, and regulation [38]. For example, at 3M, 100 years of successful innovation was almost reversed following a change of CEO and an emphasis on Six-Sigma quality processes, rather than maintaining an innovative climate and products.
The inherent uncertainty in some projects limits the ability of managers to predict the outcomes and benefits of projects. In such cases, changes to project plans and goals are commonplace, being driven by external factors, such as technological breakthroughs, or changes in markets, as well as internal factors, such as changes in organizational goals. Together, the impact of changes to project plans and goals can overwhelm the benefits of formal project planning and management, as shown in Table 9.4 [22].
TABLE 9.4 Management of Conventional and Risky Projects
| Conventional project management | Management of risky projects |
| Modest uncertainty | Major technical and market uncertainties |
| Emphasis on detailed planning | Emphasis on opportunistic risk-taking |
| Negotiation and compromise | Autonomous behavior |
| Corporate interests and rules | Individualistic and ad hoc |
| Homogeneous culture and experience | Heterogeneous backgrounds |
This is consistent with the real options approach to investing in risky projects, because investments are sequential, and managers have some influence on the timing, resourcing, and continuation or abandonment of projects at different stages. By investing relatively small amounts in a wide range of projects, a greater range of opportunities can be explored. Once uncertainty has been reduced, only the most promising projects should be allowed to continue. For a given level of investment, this real options approach should increase the value of the project portfolio. However, because decisions and the options they create interact, a decision regarding one project can affect the option value of another project [39,40]. Nonetheless, the real options perspective remains a useful way of conceptualizing risk, particularly at the portfolio level. The goal is not to calculate or optimize, but rather to help to identify risks and payoffs, key uncertainties, decision points, and future opportunities that might be created [41]. Combined with other methods, such as decision trees, a real options approach can be particularly effective where high volatility demands flexibility, placing a premium on the certainty of information and timing of decisions.
9.5 Anticipating the Resources
Given their mathematical skills, one might have expected R&D managers to be enthusiastic users of quantitative methods for allocating resources to innovative activities. The evidence suggests otherwise: practicing R&D managers have been skeptical for a long time, as demonstrated by Case Study 9.5. An exhaustive report by practicing European managers on R&D project evaluation classifies and assesses more than 100 methods of evaluation and presents 21 case studies on their use [42]. However, it concludes that no method can guarantee success, that no single approach to pre-evaluation meets all circumstances, and that – whichever method is used – the most important outcome of a properly structured evaluation is improved communication. These conclusions reflect three of the characteristics of corporate investments in innovative activities:
- They are uncertain, so that success cannot be assured.
- They involve different stages that have different outputs that require different methods of evaluation.
- Many of the variables in an evaluation cannot be reduced to a reliable set of figures to be plugged into a formula, but depend on expert judgments: hence, the importance of communication, especially between the corporate functions concerned with R&D and related innovative activities, on the one hand, and with the allocation of financial resources, on the other.
Financial Assessment of Projects
As we showed earlier, financial methods are still the most commonly used method of assessing innovative projects, but usually in combination with other, often more qualitative approaches. The financial methods range from simple calculation of payback period or return on investment, to more complex assessments of net present value (NPV) through discounted cash flow (DCF).
Project appraisal by means of DCF is based on the concept that money today is worth more than money in the future. This is not because of the effect of inflation, but reflects the difference in potential investment earnings, that is, the opportunity cost of the capital invested.
The NPV of a project is calculated using:
where:
- Pt = Forecast cash flow in time period t
- T = Project life
- i = Expected rate of return on securities equivalent in risk to project being evaluated
- C = Cost of project at time t = 0.
In practice, rather than use this formula, it is easy to create standard NPV templates in a spreadsheet package such as Excel.
How to Evaluate Learning?
However, the potential benefits of innovative activities are twofold. First, extra profits are derived from increased sales and/or higher prices for superior products and from lower costs and/or increased sales from superior production processes. Conventional project appraisal methods can be used to compare the value of these benefits against their cost. Second, accumulated firm-specific knowledge (“learning,” “intangible assets”) that may be useful for the development of future innovations (e.g., new uses for solar batteries, carbon fiber, robots, word processing). This type of benefit is relatively more important in R&D projects that are more long-term, fundamental, and speculative.
Conventional techniques cannot be used to assess this second type of benefit, because it is an “option”—in other words, it creates the opportunity for the firm to invest in a potentially profitable investment, but the realization of the benefits still depends on a decision to commit further resources. Conventional project appraisal techniques cannot evaluate options, as shown in Research Note 9.6.
The inherent uncertainty in most R&D projects limits the ability of managers to predict the outcomes and benefits of projects. Research suggests that changes to R&D plans and goals are common, being driven by external factors, such as technological breakthroughs, as well as internal factors, such as changes in the project goals. Together, the impact of changes to project plans and goals overwhelms the effects of the quality of formal project planning and management [22]. This reality is consistent with the real options approach to investing in R&D, because investments are sequential, and managers have some influence on the timing, resourcing, and continuation or abandonment of projects at different stages. By investing relatively small amounts in a wide range of projects, a greater range of technological opportunities can be explored. Once uncertainty has been reduced, only the most promising projects are allowed to continue. For a given level of R&D investment, this real options approach should increase the value of the project portfolio. However, because options interact, a decision regarding one project can affect the option value of another project (unlike NPV calculations, which rarely include interaction effects). Therefore, the creation of further options through R&D projects may not increase the overall option value of the R&D portfolio, and conversely, the interaction of options arising from different projects can give rise to a nonlinear increase in the combined option value [39].
However, in almost all cases, it is impossible to calculate the value of R&D using real options, because unlike financial options, it is difficult to predict technological breakthroughs, estimate future sales from products flowing from the R&D (or project payoff), or identify and model project-specific risks and the time-varying volatilities of the processes and eventual values [40]. Nonetheless, the real options perspective remains a useful way of conceptualizing R&D investment, particularly at the portfolio level. It can help to make more explicit and to identify future growth options created by R&D, even when these are not related to the (current) goals of the R&D. Combined with decision trees, a real options approach can help to identify risks and payoffs, key uncertainties, decision points, and future branches (options) [41]. It is particularly effective where high volatility demands flexibility, placing a premium on the certainty of information and timing of decisions, as shown in Research Note 9.7.
In other words, the successful allocation of resources to innovation depends less on robustness of decision-making techniques than on the organizational processes in which they are embedded. According to Mitchell and Hamilton [43], there are three (overlapping) categories of innovation that large firms must finance. Each category has different objectives and criteria for selection, the implications of which are set out in Table 9.5.
TABLE 9.5 Resource Allocation for Different Types of Innovative Project
| Objective | Technical Activity | Evaluation Criteria (% of all R&D) | Decision Takers | Market Analysis | Nature of Risk | Higher Volatility | Longer Time Horizons | Nature of External Alliances |
| Knowledge building | Basic research, monitoring | Overhead cost allocation (2–10%) | R&D | None | Small = cost of R&D | Reflects wide potential | Increases search potential | Research grant |
| Strategic positioning | Focused applied research, exploratory development | “Options” evaluation (10–25%) | Chief executive R&D division | Broad | Small = cost of R&D | Reflects wide potential | Increases search potential | R&D contract, equity |
| Business Investment | Development and production engineering | “Net present value” analysis (70–99%) | Division | Specific | Large = total cost of launching | Uncertainty reduces net present value | Reduces present value | Joint venture Majority control |
- Knowledge building This is the early-stage and relatively inexpensive research for nurturing and maintaining expertise in fields that could lead to future opportunities or threats. It is often treated as a necessary overhead expense and sometimes viewed with suspicion (and even incomprehension) by senior management obsessed with short-term financial returns and exploiting existing markets, rather than creating new ones.
With knowledge-building projects, the central question for the company is: “What are the potential costs and risks of not mastering or entering the field?” Thus, no successful large firm in manufacture can neglect to explore the implications of development in IT, even if IT is not a potential core competence. And no successful firm in pharmaceuticals could avoid exploring recent developments in biotechnology. Decisions about such projects should be taken solely by technical staff on the basis of technical judgments and especially those staff concerned with the longer term. Market analysis should not play any role. Outside financial linkages are likely to be with academic and other specialist groups and to take the form of a grant. - Strategic positioning These activities are in between knowledge building and business investment, and an important – and often neglected – link between them. They involve applied R&D and feasibility demonstration, in order to reduce technical uncertainties, and to build in-house competence, so that the company is capable of transforming technical competence into profitable investment. For this type of R&D, the appropriate question is: “Is the project likely to create an option for a profitable investment at a later date?” Comparisons are sometimes made with financial stock options, where (for a relatively small sum) a firm can purchase the option to buy a stock at a specified price, before a specified date – in anticipation of increase in its value in future.
Decisions about this category of project should involve divisions, R&D directors, and the chief executive, precisely because – as their description implies – these projects will help determine the strategic options open to the company at a later date. At this stage, market analysis should be broad (e.g., where could genetic engineering create new markets for vegetables in a food company?). A variety of evaluation methods may be used (e.g., the product–technology matrix), but they will be more judgmental than rigorously quantitative. Costs will be higher than those of knowledge building, but much lower than those of full-scale business investment. As with knowledge-building projects, both high volatility in predictions and expectations and long-time horizons are not unwelcome signs of unacceptably high risk, but welcome signs are rich possibilities and sufficient time to explore them. Outside linkages require tighter management than those related to knowledge building, probably through a contract or equity participation.
- Business investment This is the development, production, and marketing of new and better products, processes, and services. It involves relatively large-scale expenditures, evaluated with conventional financial tools such as net present value. In such projects, the appropriate question is: “What are the potential costs and benefits in continuing with the project?” Decisions should be taken at the level of the division bearing the costs and expecting the benefits. Success depends on meeting the precise requirements of specific groups of users and therefore depends on careful and targeted marketing. Financial commitments are high, so that volatility in technological and market conditions is unwelcome, since it increases risk. Long-time horizons are also financially unwelcome, since they increase the financial burden. Given the size and complexity of development and commercialization, external linkages need to be tightly controlled through majority ownership or a joint venture. Given the scale of resources involved, careful and close monitoring of progress against expectations is essential. For such projects, most firms rely on financial methods to evaluate their project portfolio – around 77% of firms according to a recent survey. However, the same survey revealed that only 36% of the best-performing firms rely on financial methods, compared to 39% that use strategic methods [37]. An explanation for the relatively poor performance of financial methods is that the sophistication of the models often far exceeds the quality of the data inputs, particularly at the early stages of a project’s life.
Checklists are a commonly used example of a simple qualitative technique. A checklist is simply a list of factors that are considered important in making a decision in a specific case. These criteria include technical and commercial details, legal and financial factors, company targets, and company strategy. Most useful criteria are essentially independent of the business field and the business strategy, but the precise criteria and their weights will differ in specific applications.
The requirements for the use of this technique are minimal, and the effort involved in using it is normally low. Another advantage of the technique is that it is very easily adaptable to the company’s way of doing things. However, checklists can be a starting point for more sophisticated methods where the basic information can be used for better focus. One simple and useful example is a SWOT analysis, where projects are assessed for their strengths, weaknesses, opportunities, and threats.
Therefore, this technique can be developed further, and the analysis interaction and feedback can be easily managed using simple information technology. Ways to make the technique more sophisticated include the following:
- To include some quantitative factors among the whole list of factors
- To assign different weights to different factors
- To develop a systematic way of arriving to an overall opinion on the project, such as a score or index
A simple checklist could be one made up of a range of factors that have been formed to affect the success of a project and that need to be considered at the outset. In the evaluation procedure, a project is evaluated against each of these factors using a linear scale, usually 1 to 5 or 1 to 10. The factors can be weighted to indicate their relative importance to the organization.
The value in this technique lies in its simplicity, but by the appropriate choice of factors, it is possible to ensure that the questions address, and are answered by, all functional areas. When used effectively, this guarantees a useful discussion, an identification and clarification of areas of disagreement, and a stronger commitment, by all involved, to the ultimate outcome. Table 9.6 shows an example of a checklist, developed by the Industrial Research Institute, which can be adapted to almost any type of project.
TABLE 9.6 List of Potential Factors for Project Evaluation
| Score (1–5) | Weight (%) | S × W | |
| Corporate objectives | |||
|
Fits into the overall objectives and strategy Corporate image |
|||
| Marketing and distribution | |||
|
Size of potential market Capability to market product Market trend and growth Customer acceptance Relationship with existing markets Market share Market risk during development period Pricing trend, proprietary problem, and so on Complete product line Quality improvement Timing of introduction of new product Expected product sales life |
|||
| Manufacturing | |||
|
Cost savings Capability of manufacturing product Facility and equipment requirements Availability of raw material Manufacturing safety |
|||
| Research and development | |||
|
Likelihood of technical success Cost Development time Capability of available skills Availability of R&D resources Availability of R&D facilities Patent status Compatibility with other projects |
|||
| Regulatory and legal factors | |||
|
Potential product liability Regulatory clearance |
|||
| Financial | |||
|
Profitability Capital investment required Annual (or unit) cost Rate of return on investment Unit price Payout period Utilization of assets, cost reduction, and cash flow |
As with all techniques, there is a danger that project appraisal becomes a routine that a project has to suffer, rather than an aid to designing and selecting appropriate projects, as argued in Research Note 9.8. If this happens, people may fail to apply the techniques with the rigor and honesty required and can waste time and energy trying to “cheat” the system. Care needs to be taken to communicate the reasons behind the methods and criteria used, and where necessary, these should be adapted to different types of project and to changes in the environment [44].
Portfolio methods try to deal with the issue of reviewing across a set of projects and look for a balance of economic and nonfinancial risk/reward factors. A typical example is to construct some form of matrix measuring risk versus reward, for example, on a “costs of doing the project” versus expected returns, as shown in Figure 9.3.
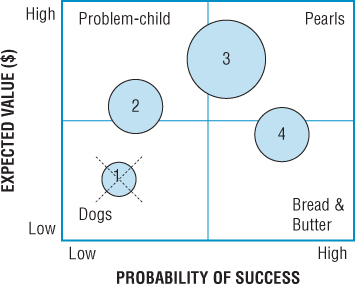
FIGURE 9.3 An example of a matrix-based portfolio.
Rather than reviewing projects just on these two criteria, it is possible to construct multiple charts to develop an overall picture, for example, comparing the relative familiarity of the market or technology – this would highlight the balance between projects that are in unexplored territory as opposed to those in familiar technical or market areas (and thus with a lower risk). Other possible axes include ease of entry versus market attractiveness (size or growth rate), the competitive position of the organization in the project area versus the attractiveness of the market or the expected time to reach the market versus the attractiveness of the market. Research Note 9.9 provides more information on matrix approaches to project portfolio assessment.
A useful variant on this set of portfolio methods is the “bubble chart” in which the different projects are plotted but represented by “bubbles” – circles whose diameter varies with the size of the project (e.g., in terms of costs). This approach gives a quick visual overview of the balance of different-sized projects against risk and reward criteria. Case Study 9.6 gives an example. However, it is important to recognize that even advanced and powerful screening tools will only work if the corporate will is present to implement the recommended decisions, for example, Cooper and Kleinschmidt found that the majority of firms studied (885) poorly performed at this stage and often failed to kill off weak concepts [45].
How Practicing Managers Cope
These two sets of difficulties – in evaluating the potential contributions of technological investments to firm-specific intangible assets and in dealing with uncertainty – are reflected in how successful managers allocate resources to technological activities. In particular, they:
- Encourage incrementalism – step-by-step modification of objectives and resources, in the light of new evidence.
- Use simple rules models for allocating resources, so that the implications of changes can be easily understood.
- Make explicit from the outset criteria for stopping the project or program.
- Use sensitivity analysis to explore if the outcome of the project is “robust” (unchanging) to a range of different assumptions (e.g., “What if the project costs twice as much, and takes twice as long, as the present estimates?”).
- Seek the reduction of key uncertainties (technical and – if possible – market) before any irreversible commitment to full-scale – and costly – commercialization.
- Recognize that different types of innovation should be evaluated by different criteria.
View 9.1 provides insights from a director of R&D on how, in practice, firms assess and value different types of research and development project.
Summary
The process of innovation is much more complex than technology responding to market signals. Effective business planning under conditions of uncertainty demands a thorough understanding and management of the dynamics of innovation, including conception, development, adoption, and diffusion.
The adoption and diffusion of an innovation depend on the characteristics of the innovation, the nature of potential adopters, and the process of communication. The relative advantage, compatibility, complexity, trialability, and observability of an innovation all affect the rate of diffusion. The skills, psychology, social context, and infrastructure of adopters also affect adoption. Epidemic models assume that innovations spread by communication between adopters, but bandwagons do not require this. Instead, early adopters influence the development of an innovation, but subsequent adopters may be more influenced by competitive and peer pressures. Forecasting the development and adoption of innovations is difficult, but participative methods such as Delphi and scenario planning are highly relevant to innovation and sustainability. In such cases, the process of forecasting, including consultation and debate, is probably more important than the precise outcomes of the exercise.
- A business plan, however informal, helps to articulate, share, and debate the key assumptions, aims, and resources of a new venture. It can also be useful to attract support and resources.
- Forecasting methods assist in the identification and assessment of market opportunities and potential competition, ranging from simple market research through to scenario planning.
- It is critical not to ignore risks and uncertainty, but instead to identify the types, sources, and ways to avoid, transfer, mitigate, or accept such risks.
- Financial planning is essential, especially analysis of cash flow, but is not sufficient. In addition, more qualitative methods of assessing innovation projects are necessary.
Chapter 9: Concept Check Questions
- The choice of forecasting method should NOT depend on:
- Which characteristics are NOT necessarily positively associated with the rapid diffusion and widespread adoption of an innovation?
- To be effective, scenario planning must satisfy a number of conditions. Which of the following is NOT essential?
- The design of a Delphi study for forecasting the future should follow all but which of the following guidelines?
- Which of these is an assumption of the Bass model of diffusion?
Further Reading
The challenges of forecasting the future development, adoption, and diffusion of innovations are dealt with by many authors in the innovation field. Everett Roger’s classic text, The diffusion of innovations, first published in 1962, remains the best overview of this subject, the most recent and updated edition being published in 2003 (Simon and Schuster). More up-to-date accounts can be found in Determinants of innovative behaviour, edited by Cees van Beers, Alfred Kleinknecht, Roland Ortt, and Robert Verburg (Palgrave, 2008), and our own Gaining momentum: Managing the diffusion of innovations, edited by Joe Tidd (Imperial College Press, 2010). The chapter by Paul Stoneman and Giuliana Battisti in the Handbook of the economics of innovation, volume 2, on the “Diffusion of new technology” provides a solid introduction (edited by Bronwyn H. Hall and Nathan Rosenberg, Elsevier, 2010).
In Democratizing innovation (MIT Press, 2005, and free online), Eric von Hippel builds on his earlier concept of “lead users” in innovation and argues that innovation is becoming more democratic, with users increasingly being capable of developing their own new products and services. He believes that such user innovation has a positive impact on social welfare as innovating users – both individuals and firms – often freely share their innovations with others, creating user-innovation communities and a rich intellectual commons. Examples provided range from surgical equipment to surfboards to software security. A broader review of user innovation is provided by the special issue of the International Journal of Innovation Management, 12(3), 2008, edited by Steve Flowers and Flis Henwood, and the extended edited book, which followed Perspectives on user innovation (Imperial College Press, 2010).
Most treatments of forecasting are too technical, from finance or economics. A notable exception is the entertaining and insightful Superforecasting: The art and science of prediction by Philip Tetlock and Dan Gardner (Random House, 2016). Clayton Christensen’s (with S.D. Anthony and E.A. Roth) Seeing what’s next: Using the theories of innovation to predict industry change (Harvard Business School Press, 2005) is a useful review of methods for forecasting radical and potentially disruptive innovations. A special issue of the journal Long range planning, 37(2), 2004, is devoted to forecasting and provides a good overview of current thinking. Scenario planning by Gill Ringland (John Wiley & Sons, Ltd, 2nd edition, 2006) and Scenario planning: The link between future and strategy by Mats Lindgren (Palgrave Macmillan, 2002) are both detailed and practical guides to conducting scenario planning, which is probably one of the most relevant methods for understanding innovation planning. There was a special issue of the journal Technological forecasting and social change, 79(1), January 2012, on “Scenario method: Current developments in theory and practice,” and another special issue of the same journal on “Delphi technique: Past, present, and future prospects,” 78(9), November 2011. For a comprehensive overview of international research and practice, refer to The handbook of technology foresight, edited by Luke Georghiou (Edward Elgar, 2008).
Case Studies
Additional case studies are available on the companion website, including the following:
- The Plaswood Recycling case, which provides a good example of how to assess a new business concept.
- The Better Place case demonstrates the challenges of adoption and diffusion and some of the issues in managing a large-scale start-up venture.
References
- 1. Kaplan, J.M. and A.C. Warren, Patterns of Entrepreneurship. 2009, John Wiley & Sons, Inc., New York. Third edition.
- 2. Roberts, E.B., Entrepreneurs in High Technology: Lessons from MIT and Beyond. 1991, Oxford University Press, Oxford.
- 3. Tidd, J. and K. Bodley, Effect of novelty on new product development processes and tools. R&D Management, 2002. 32(2), 127–38.
- 4. Rogers, E.M., Diffusion of Innovations. 2003, Free Press, New York; Tidd, J., Gaining momentum: Managing the diffusion of innovations. 2010, Imperial College Press, London.
- 5. Isaksen, S. and J. Tidd, Meeting the innovation challenge: Leadership for transformation and growth. 2006, John Wiley & Sons, Ltd, Chichester.
- 6. Nowack, M., J. Endrikat, and E. Guenther, Review of Delphi-based scenario studies: Quality and design considerations, Technological Forecasting and Social Change, 2011. 78(9), 1603–15; Landeta, J., Current validity of the Delphi method in social sciences. Technological Forecasting and Social Change, 2006. 73(5), 467–82; Fuller, T. and L. Warren, Entrepreneurship as foresight: A complex social network perspective on organisational foresight. Futures, 2006. 38(8), 956–71; Gupta, U.G. and R.E. Clarke, Theory and applications of the Delphi technique: A bibliography (1975–1994). Technological Forecasting and Social Change, 1996. 53(2), 185–212.
- 7. Rhisiart, M., R. Miller, and S. Brooks, Learning to use the future: developing foresight capabilities through scenario processes, Technological Forecasting and Social Change, 2015. 101(10), 124–33; Ringland, G., Scenario Planning, second edition. 2006, John Wiley & Sons, Ltd, Chichester; Chermack, T.J., Studying scenario planning: theory, research suggestions, and hypotheses. Technological Forecasting and Social Change, 2005. 72(1), 59–73; Burt, G. and K. van der Heijden, First steps: Towards purposeful activities in scenario thinking and future studies. Futures, 2003. 35(10), 1011–26.
- 8. Guseo, R. and M. Guidolin, Heterogeneity in diffusion of innovations modelling: A few fundamental types, Technological Forecasting and Social Change, 2015. 90(1), 514–24; Geroski, P.A., Models of technology diffusion. Research Policy, 2000. 29, 603–25.
- 9. Griffiths, T.L. and J.B. Tenebaum, Optimal predications in everyday cognition. Psychological Science, 2006. 45, 56–63; Lissom, F. and J.S. Metcalfe, “Diffusion of innovation ancient and modern: A review of the main themes.” In M. Dodgson and P.L. Rothwell, eds, The handbook of industrial innovation, 1994, Edward Elgar, Cheltenham, pp. 106–41.
- 10. Abrahamson, E. and L. Plosenkopf, Institutional and competitive band-wagons: Using mathematical modelling as a tool to explore innovation diffusion. Academy of Management Journal, 1993. 18(3), 487–517.
- 11. Tidd, J., Flexible Manufacturing Technologies and International Competitiveness. 1991, Pinter, London.
- 12. Williams, F. and D.V. Gibson, Technology Transfer: A Communications Perspective. 1990, Sage, London.
- 13. Leonard-Barton, D. and D.K. Sinha, Developer–user interaction and user satisfaction in internal technology transfer. Academy of Management Journal, 1993. 36(5), 1125–39.
- 14. Leonard-Barton, D., “Implementing new production technologies: Exercises in corporate learning.” In M.A. von Glinow and S.A. Mohmian, eds, Managing complexity in high technology organizations. 1990, Cambridge University Press, Cambridge, pp. 160–187.
- 15. Chakravorti, B., The Slow Pace of Fast Change: Bringing Innovation to Market in a Connected World. 2003, Harvard Business School Press, Boston, MA; The new rules for bringing innovations to market. Harvard Business Review, 2004. 82(3), 58–67; The role of adoption networks in the success of innovations. Technology in Society, 2004. 26, 469–82.
- 16. Moore, G., Crossing the chasm: Marketing and selling technology products to mainstream customers. 1991, HarperBusiness, New York; Inside the tornado: Marketing strategies from Silicon Valley’s cutting edge. 1998, John Wiley & Sons, Ltd, Chichester.
- 17. Lee, Y. and G.C. O’Connor, New product launch strategy for network effects products. Journal of the Academy of Marketing Science, 2003. 31(3), 241–55.
- 18. Shi, X. and K. Fernandes, Exploring the role of innovativeness and opinion leadership in diffusion, International Journal of Innovation Management, 2014. 18(4), 1450029; Van den Bulte, C. and G.L. Lilien, Medical innovation revisited: Social contagion versus marketing effort. The American Journal of Sociology, 2001. 106(5), 1409–35; Van den Bulte, C. and S. Stremersch, Social contagion and income heterogeneity in new product diffusion. Marketing Science, 2004. 23(4), 530–44.
- 19. Atun, R.A., I. Gurol-Urganci, and D. Sheridan, Uptake and diffusion of pharmaceutical innovations in health systems. International Journal of Innovation Management, 2007. 11(2), 299–322.
- 20. Tidd, J., Innovation management in the pharmaceutical industry: A case of restricted vision? Innovation in Pharmaceutical Technology, 2006. 16–19.
- 21. Flowers, S., Special issue on user-centered innovation. International Journal of Innovation Management, 2008. 12(3).
- 22. Dvir, D. and T. Lechler, Plans are nothing, changing plans is everything: The impact of changes on project success. Research Policy, 2004. 33, 1–15.
- 23. Bower, J., Managing the Resource Allocation Process. 1986, Harvard Business School, Boston, MA.
- 24. Mansfield, E., et al., Research and innovation in the modern corporation. 1972, Macmillan, London.
- 25. Booz Allen Hamilton, New product management in the 1980s. 1982, New York.
- 26. Freeman, C. and L. Soete, The economics of industrial innovation, third edition. 1997, Pinter, London.
- 27. Heilbronner, S.R., et al., A fruit in the hand or two in the bush? Divergent risk preferences in chimpanzees and bonobos. Biology Letters, 2008. 4(3) 246–9.
- 28. Westland, J.C., Global Innovation Management: A Strategic Approach. 2008, Palgrave Macmillan, Basingstoke.
- 29. Gardner, D., Risk: The Science and Politics of Fear. 2008, Virgin Books, London.
- 30. Tenkasi, R.V., The dynamics of cognitive oversimplification processes in R&D environments: An empirical assessment of some consequences. International Journal of Technology Management, 2000. 20, 782–98.
- 31. Tyler, B.B. and D.R. Gnyawali, Mapping managers’ market orientations regarding new product success. Journal of Product Innovation Management, 2002. 259–76.
- 32. Walsh, J.P., Managerial and organizational cognition: Notes from a field trip. Organization Science, 1995. 6(1), 1–41.
- 33. Genus, A. and A.M. Coles, Firm strategies for risk management in innovation. International Journal of Innovation Management, 2006. 10(2), 113–26.
- 34. Fischoff, B., Risk perception and communication unplugged: Twenty years of progress. Risk Analysis, 1995. 15(2), 137–45; Renn, O., Three decades of risk research: Accomplishments and new challenges. Journal of Risk Research, 1998. 1(1), 49–72; Stirling, A., Risk at a turning point? Journal of Risk Research, 1998. 1(2), 97–110.
- 35. Sunstein, C.R., Laws of Fear: Beyond the Precautionary Principle. 2005, Cambridge University Press, Cambridge; Morris, J., Rethinking risk and the precautionary principle. 2000, Butterworth Heinemann, London.
- 36. Berglund, H., Risk conception and risk management in corporate innovation. International Journal of Innovation Management, 2007. 11(4), 497–514.
- 37. Totterdell, P., et al., An investigation of the contents and consequences of major organizational innovations. International Journal of Innovation Management, 2002. 6(4), 343–68.
- 38. Keizer, J.A., J.P. Vos, and J.I.M. Halman, Risks in new product development: Devising a reference tool. R&D Management, 2005. 35(3), 297–306.
- 39. McGrath, R.G. and A. Nerkar, Real options reasoning and a new look at the R&D investment strategies of pharmaceutical firms. Strategic Management Journal, 2004. 25, 1–21.
- 40. Paxon, D.A., Introduction to real R&D options. R&D Management, 2001. 31(2), 109–13.
- 41. Loch, C.H. and K. Bode-Greual, Evaluating growth options as sources of value for pharmaceutical research projects. R&D Management, 2001. 31(2), 231–45.
- 42. EIRMA, Evaluation of R&D projects. 1995, European Industrial Research Management Association, Paris.
- 43. Mitchell, G. and W. Hamilton, Managing R&D as a strategic option. Research-Technology Management, 1988. 31, 15–22.
- 44. Laslo, Z. and A.I. Goldberg, Resource allocation under uncertainty in a multi-project matrix environment: Is organizational conflict inevitable? International Journal of Project Management, 2008. 26(4).
- 45. Kleinknecht, A. and G. van der Panne, Predicting new product sales: The post-launch performance of 215 innovators, International Journal of Innovation, 2012. 16(2), 1250011; Cooper, R. and E. Kleinschmidt, New products: The key factors in success. 1990, Chicago: American Marketing Association.