
CHAPTER 10
Creating New Products and Services

In this chapter, we focus on the more specific issue of developing new products and services. We begin by introducing the most common processes for development, the stage-gate and development funnel. We then review the generic factors that influence product and service success and failure. The central part of this chapter looks at how the market and technological context influence the process of development and commercialization, for example, how the development of radical is different from more common line extensions. Finally, we explore the similarities and differences between developing new products and services. In the most advanced service economies such as the United States and the United Kingdom, services create up to three-quarters of the wealth and 85% of employment, and yet most of what we know about managing innovation comes from research and experience in manufactured products.
10.1 Processes for New Product Development
We discussed the broader organizational factors to support innovation in Chapter 3, but here we explore the more specific needs of new product and service development. Successful product and service development require much more than the application of a set of tools and techniques, and in addition requires an appropriate organization to support innovation and an explicit process to manage development. In this section, we examine the critical role of an organization, and the various options available in the case of new product and service development. The purpose of this section is not, however, to provide a more general overview of the theory and practice of organizational behavior and development, and we assume that you are familiar with the basics of this field.
One of the key challenges facing the organization of new product and process development is that most organizations have not evolved or been designed to do this, but are structured for a different purpose, usually to serve some operational need. In most organizations, new product or service development is a rather unusual and infrequent requirement, so the first decision is what sort of team to put together to do this.
Essentially the choice is between functional teams, cross-functional project teams, or some form of matrix between the two. For example, the team might be within a single function or department such as research, marketing, or design. Alternatively, a special cross-functional team might be established, including representative from many (but not all) functional groups. In a matrix organization, a dedicated team is not formed, but rather members remain in their functional or departmental groups, but are designated to a project group. Studies of new product development suggest four main types of team structure:
- Functional structure – a traditional hierarchical structure where communication between functional areas is largely handled by function managers and according to standard and codified procedures.
- Lightweight product manager structure – again a traditional hierarchical structure but where a project manager provides an overarching coordinating structure to the inter-functional work.
- Heavyweight product manager structure – essentially a matrix structure led by a product (project) manager with extensive influence over the functional personnel involved but also in strategic directions of the contributing areas critical to the project. By its nature, this structure carries considerable organizational authority.
- Project execution teams – A full-time project team where functional staff leave their areas to work on the project, under the project leader direction.
Project management structure is strongly correlated with product success, and of the available options the functional structures are the weakest. Associated with these different structures are different roles for team members and particularly for project managers. For example, the “heavyweight project manager” has to play several different roles, which include extensive interpreting and communication between functions and players. Similarly, team members have multiple responsibilities. This implies the need for considerable efforts at team building and development, for example, to equip the team with the skills to explore problems, to resolve the inevitable conflicts that will emerge during the project, and to manage relationships inside and outside the project. Research Note 10.1 reviews the effectiveness of cross-functional teams for different types of development projects.
The process of new product or service development – moving from idea through to successful products, services, or processes – is a gradual process of reducing uncertainty through a series of problem-solving stages, moving through the phases of scanning and selecting and into implementation – linking market- and technology-related streams along the way.
At the outset anything is possible, but increasing commitment of resources during the life of the project makes it increasingly difficult to change the direction. Managing new product or service development is a fine balancing act, between the costs of continuing with projects, which may not eventually succeed (and which represent opportunity costs in terms of other possibilities) – and the danger of closing down too soon and eliminating potentially fruitful options. With shorter life cycles and demand for greater product variety, pressure is also placed upon the development process to work with a wider portfolio of new product opportunities and to manage the risks associated with progressing more projects through development to launch.
These decisions can be made on an ad hoc basis, but experience and research suggest some form of structured development system, with clear decision points and agreed rules on which to base go/no-go decisions, is a more effective approach. Attention needs to focus on reconfiguring internal mechanisms for integrating and optimizing the process such as concurrent engineering, cross-functional working, advanced tools, early involvement, and so on. To deal with this attention has focused on systematic screening, monitoring, and progression frameworks such as Cooper’s “stage-gate” approach, as shown in Figure 10.1 [1].
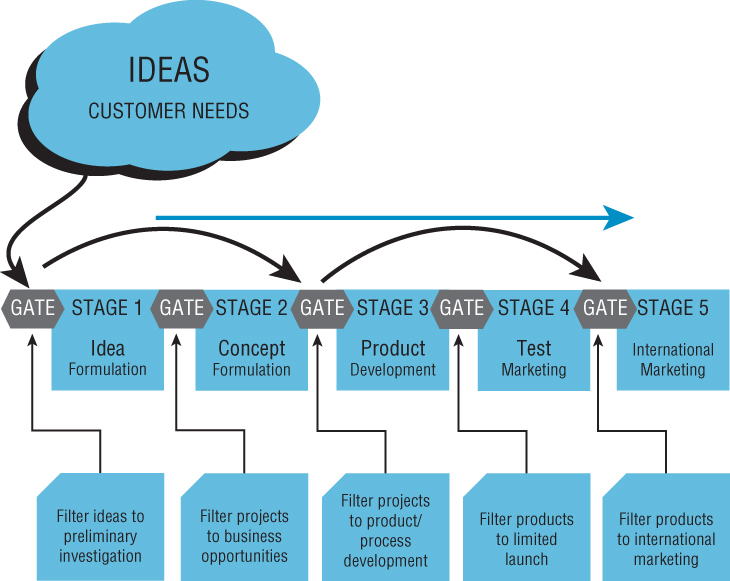
FIGURE 10.1 Stage-gate process for new product development.
As Cooper suggests, successful product development needs to operate some form of structured, staging process. As projects move through the development process, there are a number of discrete stages, each with different decision criteria or “gates,” which they must pass. Many variations to this basic idea exist (e.g., “fuzzy gates”), but the important point is to ensure that there is a structure in place that reviews both technical and marketing data at each stage. A common variation is the “development funnel,” which takes into account the reduction in uncertainty as the process progresses, and the influence of real resource constraints, as illustrated by Figure 10.2.
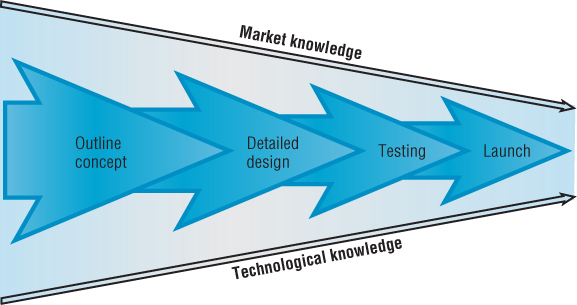
FIGURE 10.2 Development funnel model for new product development.
There are numerous other models in the literature, incorporating various stages ranging from 3 to 13. Such models are essentially linear and unidirectional, beginning with concept development and ending with commercialization.
Models of this type suggest a simple, linear process of development and elimination. However, in practice, the development of new products and services is inherently a complex and iterative process, and this makes it difficult to model for practical purposes. For ease of discussion and analysis, we will adopt a simplified four-stage model, which we believe is sufficient to discriminate between the various factors that must be managed at different stages [2]:
- Concept generation – identifying the opportunities for new products and services.
- Project assessment and selection – screening and choosing projects that satisfy certain criteria.
- Product development – translating the selected concepts into a physical product (we’ll discuss services later).
- Product commercialization – testing, launching, and marketing the new product.
Concept Generation
Much of the marketing and product development literatures concentrate on monitoring market trends and customer needs to identify new product concepts. However, there is a well-established debate in the literature about the relative merits of “market-pull” versus “technology-push” strategies for new product development. A review of the relevant research suggests that the best strategy to adopt is dependent on the relative novelty of the new product. For incremental adaptations or product line extensions, “market pull” is likely to be the preferred route, as customers are familiar with the product type and will be able to express preferences easily. However, there are many “needs” that the customer may be unaware of, or unable to articulate; and in these cases, the balance shifts to a “technology-push” strategy. Nevertheless, in most cases, customers do not buy a technology, they buy products for the benefits that they can receive from them; the “technology push” must provide a solution for their needs. Thus, some customer or market analysis is also important for more novel technology. We discussed the issue of concept development in detail in Chapter 9. This stage is sometimes referred to as the “fuzzy front end” because it often lacks structure and order, but a number of tools are available to help systematically identify new product concepts, and these are described below. The research note on concept change for radical products illustrates this. Research Note 10.2 discusses the role of customer inputs to concept development.
Project Selection
This stage includes the screening and selection of product concepts prior to subsequent progress through to the development phase. Two costs of failing to select the “best” project set are the actual cost of resources spent on poor projects and the opportunity costs of marginal projects, which may have succeeded with additional resources.
There are two levels of filtering. The first is the aggregate product plan, in which the new product development portfolio is determined. The aggregate product plan attempts to integrate the various potential projects to ensure the collective set of development projects will meet the goals and objectives of the firm and help to build the capabilities needed. The first step is to ensure that the resources are applied to the appropriate types and mix of projects. The second step is to develop a capacity plan to balance resource and demand. The final step is to analyze the effect of the proposed projects on capabilities, to ensure this is built up to meet future demands.
The second lower level filters are concerned with specific product concepts. The two most common processes at this level are the development funnel and the stage-gate system. The development funnel is a means to identify, screen, review, and converge development projects as they move from idea to commercialization. It provides a framework in which to review alternatives based on a series of explicit criteria for decision making. Similarly, the stage-gate system provides a formal framework for filtering projects based on explicit criteria. The main difference is that where the development funnel assumes resource constraints, the stage-gate system does not. We discussed these in detail in Chapter 9.
Product Development
This stage includes all the activities necessary to take the chosen concept and deliver a product for commercialization. It is at the working level, where the product is actually developed and produced, that the individual R&D staff, designers, engineers, and marketing staff must work together to solve specific issues and to make decisions on the details (see Research Note 10.3 for the critical role of cross-functional teams in product development). Whenever a problem appears, a gap between the current design and the requirement, the development team must take action to close it. The way in which this is achieved determines the speed and effectiveness of the problem-solving process. In many cases, this problem-solving routine involves iterative design–test–build cycles, which make use of a number of tools. Research Note 10.3 discusses how cross-functional teams are used in practice.
Product Commercialization and Review
In many cases, the process of new product development blurs into the process of commercialization. For example, customer codevelopment, test marketing, and use of alpha, beta, and gamma test sites yield data on customer requirements and any problems encountered in use, but also help to obtain customer buy-in and prime the market. It is not the purpose of this section to examine the relative efficacy of different marketing strategies, but rather to identify those factors that influence directly the process of new product development. We are primarily interested in what criteria firms use to evaluate the success of new products, and how these criteria might differ between low and high novelty projects. In the former case, we would expect more formal and narrow financial or market measures; but in the latter case, we find a broader range of criteria are used to reflect the potential for organizational learning and future new product options.
Lean and Agile Product Development
One of the strong drivers for improving product and service development processes is the need for speed. Concerns of this kind have led to a significant expansion in the use of approaches originally developed in the field of software engineering to improve product development success. They have been increasingly applied to other development projects for new products, services, and even process reengineering. At its heart is an approach that emphasizes focused high intensity team work (often called a “scrum”), stretching goals and rapid cycles of prototyping, testing, and learning. Where conventional project management techniques set a goal and then break down the various tasks needed to complete it into key activities and allocate resources to them agile methods are more open-ended, allowing considerable creativity and flexibility in the execution of activities which will move nearer to the stretch target.
The basic framework in an agile approach involves setting up a core self-managed team, drawing on different functions and with a clear and stretching target. The team use various creativity tools (such as brainstorming and design thinking) to generate a list of key features that they think will be of value to the end user. Two key roles operate – a team leader who represents the end user’s point of view and ranks these features from that perspective, and a process facilitator whose role is to help manage the support and psychological safety aspects of the team.
Once the stretch goal (vision) is broken down into a ranked list of contributing projects the team work on short problem-solving cycles (“sprints”) around these issues. Typically, there is a short review meeting at the start of each day to explore progress, challenge, and strengthen ideas and develop experiments that they then test out during the day. The results of those experiments provide feedback and data to fuel the next day’s review meeting and drive the sprint forward. Experiments may be of a technical nature – for example, writing code or developing a working prototype – or they may be market tests, trying out the ideas with potential end users. In both cases, the idea is to move through a fast cycle of experiment and learn, with the prospect of failure seen simply as a learning opportunity rather than a block to further progress.
Agile methods work – various reports suggest time savings of between 10% and 40%, and the quality of solutions is often much better [3]. Much of this success comes from focused creative teamwork and once again we can see many of our core competencies being deployed. The stretch target, the psychological safety that comes from having an autonomous and empowered group with the licence to experiment, the constructive controversy that emerges during the scrum process are all critical success factors in the agile approach.
Lean Start-up
Lean start-up (LSU) is a similar approach for entrepreneurs developed by Eric Ries and popularized by him and Steve Blank in various books and articles. It draws on his own experience as an entrepreneur and his reflections on what went wrong with the process. At its with agile innovation, at heart is the view that starting a new venture is about a series of short fast experiments rather than a carefully planned and executed big project. Each cycle is carefully designed to generate information and test ideas out on the market – and after each prototype the venture idea is adjusted. Key principles are the “minimum viable product” (MVP) that is a simple basic version of the overall product idea that can be tested on users to gain feedback, and the “pivot,” which is changes in direction as a result of that feedback.
The origin of the “lean” idea comes from the low waste approach pioneered in manufacturing and widely used across all sectors. It has been applied to product development to reduce time and resources spent and in software in particular has been allied to a second principle, of “agile” development. Here the main project is broken down into a series of fast short cycles of prototypes and learning, with the development team effort concentrated in fast bursts of intense activity – the “scrum.”
LSU developed in the field of software and web applications but the underlying philosophy can be applied in any project. There are some core elements to the approach:
- Build-measure-learn The principle here is to design a hypothesis to test an idea and then adjust the project on the basis of that feedback. So, for example, it can be used to test a particular feature where the hypothesis is that people will like and value it; if they do then retain the feature, if they don’t, drop it.
- Minimum viable product (MVP) This is the minimum configuration of the new venture idea that can be used to run a build/measure/learn cycle – a simple prototype whose purpose is to generate data that helps adjust the core idea for the venture.
- Validated learning An important element of LSU is to work with data that provide useful information and help learning about the venture. Ries talks about the problem of “vanity metrics,” which might appear to be measures of success but don’t actually reveal anything useful. For example, the number of people visiting a web-page is not helpful in itself, but the amount of time they spend or the features they click on may be because it gives information about the underlying things that people are valuing – at least enough to send some time on. Equally the number of return visitors is a useful metric.
- Innovation accounting Linked to validated learning is the idea of using data to ensure resources are being well spent. To do this it requires establishing a baseline and then improving on the performance linked to that by varying elements in the MVP – a process called “tuning the engine.” For example, a simple baseline could be set by a market survey that asks people if they would buy a product or service. Then launching an MVP cycle would generate data that suggested that more (or less) of them would be interested – and the core concept could be pivoted before a retest cycle. In this way, the scarce resources associated with innovation can be carefully tracked.
- Pivoting The core assumption in LSU is that the only way to get closer to what customers actually need is to test your idea out on them and adapt it according to feedback from several learning cycles. This creates a need to use data from experiments to adjust the offer – the idea of a pivot is not that you change the idea completely but pivot it around the core so that it more exactly meets market needs. YouTube was originally a dating site on which one of the many features offered was the ability to share short video clips. During MVP tests, it became clear that this feature was particularly valued so the original idea was adapted to put this more up front; further tests showed it was sufficiently valued to make it the core feature of the new business venture.
The essence of pivoting and MVP could be summed up as “launch and see what happens” – inevitably something will and if the experimental launch is well designed it will help sharpen and refine the final offering without too much resource waste. Even if the MVP is a “failure,” there is valuable learning about new directions in which to pivot.
There are different versions of the pivot:
- Zoom-in pivot, where a single feature in the product now becomes the entire product (as in the YouTube case).
- Zoom-out pivot, where the whole product becomes a single feature in something much larger.
- Customer segment pivot, where the product was right, but the original customer segment wasn’t. By rethinking the customer target segment the product can be better positioned.
- Customer need pivot, where validated learning highlights a more important customer need or problem.
- Platform pivot, where single separate applications converge to become a platform.
- Business architecture pivot, essentially changing the underlying business model – for example, from high margin, low volume, to low margin, high volume.
- Value capture pivot, where changes involve rethinking marketing strategy, cost structure, product, and so on.
- Engine of growth pivot, where the start-up model is rethought. Ries suggests three core models for this – viral, sticky, or paid growth – and there is scope to change between them.
- Channel pivot, where different routes to reach the market are explored.
- Technology pivot, where alternative new technologies are used but the rest of the business model – market, cost structure, and so on – remain the same.
- Single unit flow An idea that originated in the Toyota Production System is one of the cornerstones of “lean” thinking. In essence, it is about working in small batches and completing the tasks on those rather than working in high volume. Think about doing a mailshot that would involve stuffing envelopes, addressing them, stamping them, posting them, and so on. Doing this in high volume, one task at a time runs the risk of being slow and also of errors being made and not detected – for example, spelling someone’s name wrong. Working one unit at a time would be faster and more accurate.
Applied to LSU the idea is to work at small scale to develop the system and identify errors and problems quickly; the whole system can then be redesigned to take out these problems.
- Line stop/Andon cord Another idea drawn from Toyota is the ability to stop production when an error occurs – in the giant car factories this is done by means of a cord that triggers a light above the place where the employee has found a problem. In LSU, it is the principle of making sure there are error checks and that the process is stopped until these are fixed.
- Continuous improvement Another Toyota-based principle is to keep reviewing and improving the core product and the process delivering it. By working in small batches (see (f) above), it is possible to experiment and optimize around the core idea.
- Kanban Yet another “lean” feature this refers to the system of stock management associated with just-in-time production. Applied to LSU, it puts improvement projects around the core product/venture idea into “buckets,” which are processed and progressed in a systematic fashion. It is a powerful aid to managing capacity since new projects cannot be started until there is room for them in the system.
- Five whys A powerful diagnostic tool that helps to find the root causes of problems and directs action toward solving those problems rather than treating symptoms.
10.2 Factors Influencing Product Success or Failure
There have been more than 200 studies that have investigated the factors affecting the success of new products. Most have adopted a “matched-pair” methodology in which similar new products are examined, but one is much less successful than the other [4]. This allows us to discriminate between good and poor practice and helps to control for other background factors. Table 10.1 summarizes some of the main research on the topic of product success and failure.
TABLE 10.1 Some Key Studies of New Product and Service Development
| Study Name | Key Focus | Further References |
| Project SAPPHO | Success and failure factors in matched pairs of firms, mainly in chemicals and scientific instruments | 5 |
| Wealth from Knowledge | Case studies of successful firms – all were winners of the Queen’s Award for Innovation | 6 |
| Postinnovation Performance | Looked at these cases 10 years later to see how they fared | 7 |
| Project Hindsight | Historical reviews of US government-funded work within the defense industry looking back over 20 years (from 1966) at key projects and success/failure factors | 8 |
| TRACES | As Project Hindsight but with 50-year review and also exploring civilian projects. Main aims were to identify sources of successful innovation and management factors influencing success | 9 |
| Industry and Technical progress | Survey of UK firms to identify why some were apparently more innovative than others in the same sector, size range, etc. Derived a list of managerial factors that comprised “technical progressiveness” | 10 |
| Minnesota Studies | Detailed case studies over an extended period of innovations. Derived a “road map” of the innovation process and the factors influencing it at various stages | 11 |
| Project NEWPROD | Long-running survey of success and failure in product development and replications | 12 |
| Stanford Innovation Project | Case studies of (mainly) product innovations, emphasis on learning | 13 |
| Lilien and Yoon | Literature review of major studies of success and failure | 14 |
| Rothwell | 25-year retrospective review of success and failure studies and models of innovation process | 15 |
| Mastering the Dynamics of Innovation | Five retrospective in-depth industry-level cases | 16 |
| Sources of Innovation | Case studies involving different levels and types of user involvement | 17 |
| Product Development Management Association | Handbook distilling key elements of good practice from a range of success and failure studies in product development | 18 |
| Ernst | Extensive literature review of success factors in product innovation | 19 |
| Interprod | International study (17 countries) collecting data on the factors influencing new product success and failure | 20 |
| Christensen | Industry-level studies of disruptive innovation – includes disk drives, mechanical excavators, steel mini-mills | 21 |
| Eisenhardt and Brown | Detailed case studies of five semiconductor equipment firms | 22 |
| Revolutionizing Product Development | Case studies of product development | 23 |
| Winning by Design | Case studies of product design and innovation | 24 |
| Innovation Audits | Various frameworks synthesizing literature and reported key factors | 25 |
| Radical Innovation | Review of radical innovation practices in case study firms | 26 |
| Rejuvenating the Mature Business | Review of mature businesses in Europe and their use of innovation to secure competitive advantage | 27 |
| Innovation Wave | Case studies of manufacturing and service innovations based on experiences at the London Business School Innovation Exchange | 28 |
| Tidd and Bodley | Effects of product novelty on effectiveness of development tools, based on 50 development projects | 3 |
| SPOTS | Contribution and effectiveness of strategy, processes, organization, technology, and systems for new service development in 108 firms | 29 |
These studies have differed in emphasis and sometimes contradicted each other, but despite differences in samples and methodologies, it is possible to identify some consensus of what the best criteria for success are:
- Product advantage Product superiority in the eyes of the customer, real differential advantage, high performance-to-cost ratio, delivering unique benefits to users – appear to be the primary factor separating winners and losers. Customer perception is the key.
- Market knowledge The homework is vital: better predevelopment preparation including initial screening, preliminary market assessment, preliminary technical appraisal, detailed market studies, and business/financial analysis. Customer and user needs assessment and understanding are critical. Competitive analysis is also an important part of the market analysis.
- Clear product definition This includes defining target markets, clear concept definition and benefits to be delivered, clear positioning strategy, a list of product requirements, features and attributes, or use of a priority criteria list agreed before development begins.
- Risk assessment Market-based, technological, manufacturing and design sources of risk to the development project must be assessed, and plans made to address them. Risk assessments must be built into the business and feasibility studies so they are appropriately addressed with respect to the market and the firms’ capabilities.
- Project organization The use of cross-functional, multidisciplinary teams carrying responsibility for the project from beginning to end.
- Project resources Sufficient financial and material resources and human skills must be available; the firm must possess the management and technological skills to design and develop the new product.
- Proficiency of execution Quality of technological and production activities and all precommercialization business analyses and test marketing; detailed market studies underpin new product success.
- Top management support From concept through to launch, management must be able to create an atmosphere of trust, coordination, and control; key individuals or champions often play a critical role during the innovation process. Research Note 10.4 explores the contributions of top management support in new product development.
These factors have all been found to contribute to new product success and should therefore form the basis of any formal process for new product development. Note from this list, and the factors illustrated in Figures 10.3 and 10.4, that successful new product and service development require not only the management of a blend of product or service characteristics, such as product focus, superiority, and advantage, but also wider organizational issues, such as project resources, execution, and leadership. Managing only one of these key contributions is unlikely to result in consistent success.
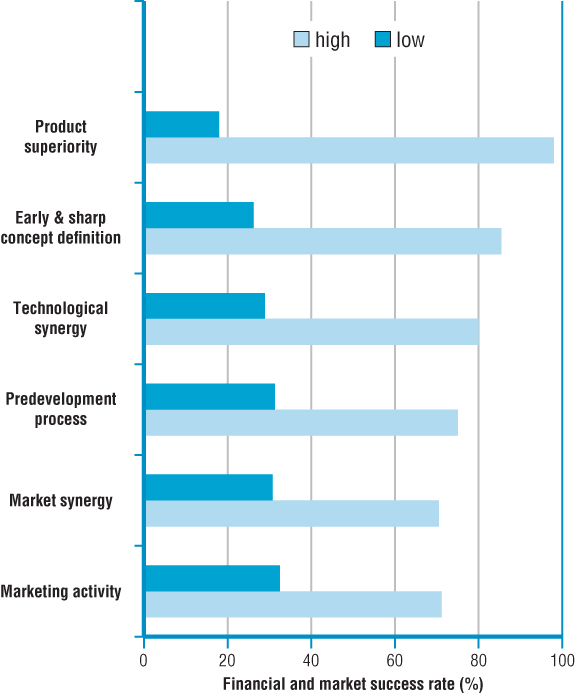
FIGURE 10.3 Factors influencing new product success.
Source: Based on Cooper, R.G., Doing it right: winning with new product, Ivey Business Journal, 2006. 64(6): 1–7.
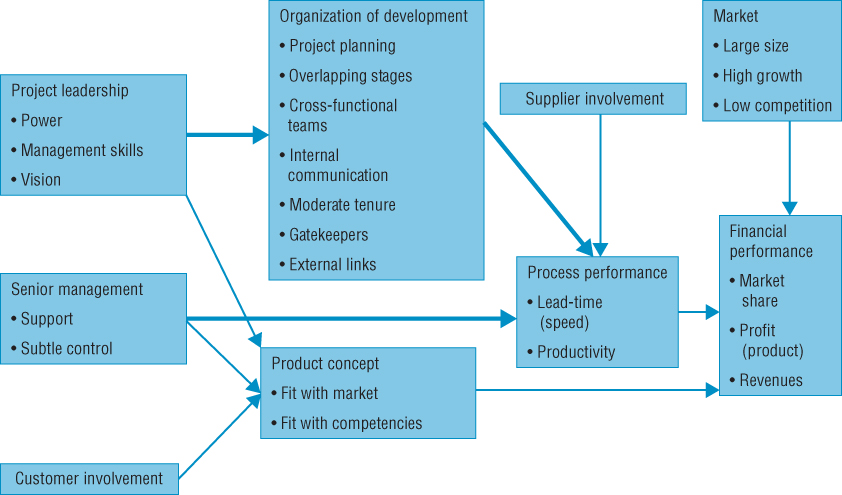
FIGURE 10.4 Key factors influencing the success of new product development.
Source: Brown, S.L. and K.M. Eisenhardt, Product development: Past research, present findings and future directions, Academy of Management Review, 1995. 20, 343–78. Copyright Academy of Management.
The organizational issues appear to dominate in the case of more radical product or service offerings. This is probably because it is much more difficult in such cases to specify, in advance, the product or service characteristics in any detail, and instead managers have to rely more on getting the organization right and influencing the direction of development. Research Note 10.5 summarizes the factors that influence the success of new product development.
When we have asked managers to describe how radical products and services are developed, the answers include the mysterious and intuitive, and many highlight the importance of luck, accident, and serendipity. Of course, there are examples of radical technologies or products that have begun life by chance, like the discovery of penicillin, but Pasteur’s advice applies: “luck favours the prepared mind.”
Gary Lynn and Richard Reilly have tried to identify in a systematic way the most common factors that contribute to successful product development, focusing on what they call “blockbuster” products – more radical and successful than most new products. Over 10 years they studied more than 700 teams and nearly 50 detailed cases of some of the most successful products ever developed and compared and contrasted these organizations with less successful counterparts. They identify five key practices that contribute to the successful development of “blockbuster” products [30]:
- Commitment of senior management.
- Clear and stable vision.
- Improvisation.
- Information exchange.
- Collaboration under pressure.
All five practices operate as a system, and blockbuster development teams must adopt all five practices. Size of the organization did not seem to matter; neither did the type of product.
Commitment of Senior Management
Those teams that developed blockbusters had the full support and cooperation from senior management. These senior managers functioned as sponsors for the project and took on an active and intimate role. Senior managers would often provide more of a “hit and run” kind of involvement for those teams that did not produce blockbusters.
Clear and Stable Vision
It is important for the development team to have a clear and stable vision to guide them, with specific and enduring parameters, something called “project pillars.” These pillars are the key requirements, or “must haves” for the new product. Mission awareness is a strong predictor of the success of R&D projects, the degree to which depends on the stage of the project. For example, in the planning and conceptual stage, mission awareness explains around two-thirds of the subsequent project success. Leadership clarity is also associated with clear team objectives, high levels of participation, commitment to excellence, and support for innovation. Leadership clarity, partly mediated by good team processes, is a good predictor of team innovation.
Improvisation
A clear and stable vision is necessary, but nobody is so brilliant that they can see the end product from the beginning. They may have a vision of what the end product may look like or what the experience of using it will be (or must be) like. It’s more like having a dialogue with the product – in trying to get the end results you may ditch what you’ve done and try something else. You may just have to accept that you may come up with something you never thought you would produce and you might be better off for it. Teams that produce blockbuster products complete the traditional stages of product development, but they take a different approach to the process. Although this may appear to be undisciplined, the teams nearly always have to meet a hard and fast deadline and are more likely to monitor their progress and costs than the less successful teams.
Information Exchange
Effective communication and information exchange is another key practice. Many blockbuster outcomes require the use of cross-functional teams. Exchanging information openly and clearly on a cross-functional team can be challenging to say the least. Not only do specific functions have their own specialized language, they also often have conflicting interests. Team members call on each other through a variety of informal and personal ways such as casual conversation, phone calls and meetings. In addition, more formal knowledge exchange happens through a system for recording, storing, retrieving, and reviewing information (see Chapter 11 for more on knowledge management). Both types of information exchange can be enabled for virtual team working, but all teams need some face-to-face time. Research Note 10.6 provides further detail on the influence of cross-functional teams on new product success.
Collaboration Under Pressure
Blockbuster development teams are generally cross-functional, but must also often deal with outsiders to bring in a new perspective or expertise. Collaboration in the face of conflicting functions and other sources of internal and external pressure requires a number of facilitating factors. Teams that produced blockbuster products complete the traditional stages of product development but take a different approach to the process. Rather than going through the gates step by step, waiting for a final decision to be made about going forward, they focus on getting an early prototype out quickly to learn how customers might respond. Once they learned how customers responded, they then continued to take out new prototypes for more continuous feedback. The teams need to be able to balance the insights they gained from the customers with the desired outcome. This constant balance allowed them to adjust and fine-tune their understanding of both the market need and the product concept. This fast, iterative process was critical to their success.
10.3 Influence of Technology and Markets on Commercialization
So far, we have described a generic process for new product development, and factors which we know affect success and failure. However, the type of innovation also influences the best way to develop and commercialize an innovation.
The innovation literature has long debated the relative merits of “market pull” versus “technology push” for explaining the success (or failure) of new products and services. The usual truce or compromise is to agree on a “coupling model,” whereby technological possibilities are coupled with market opportunities. However, this view is too simplistic. More than 40 years of research, case studies, surveys, and econometric analysis are clear. In some cases, clear market needs are unmet because of technological limitations (e.g., the elusive goal of a cure for cancer); but in other cases, technological possibilities have no immediate or obvious commercial application and anticipate or even create new markets. For example, lasers (“light amplification by the stimulated emission of radiation,” if you ever wondered) were for many years simply a useful instrument in scientific experiments, initially used in various military applications, with mixed success, but later formed the basis of almost all optical recording and transmission of data, from broadband to DVD. In this section, we try to provide an understanding of the influences the market and technological context has on new product and service development.
Marketing focuses on the needs of the customer, and therefore should begin with an analysis of customer requirements and attempt to create value by providing products and services that satisfy those requirements. The conventional marketing mix is the set of variables that are to a large extent controllable by the company, normally referred to as the “four Ps”: product, price, place, and promotion. All four factors allow some scope for innovation: product innovation results in new or improved products and services and may change the basis of competition; product innovation allows some scope for premium pricing, and process innovation may result in price leadership; innovations in logistics may affect how a product or service is made available to customers, including distribution channels and nature of sales points; innovations in media provide new opportunities for promotion.
However, we need to distinguish between strategic marketing – that is whether or not to enter a new market – and tactical marketing, which is concerned mainly with the problem of differentiating existing products and services, and extensions to such products. There is a growing body of research that suggests that factors that contribute to new product success are not universal, but are contingent upon a range of technological and market characteristics. A study of 110 development projects found that complexity, novelty, and whether the project was for hardware or software development affected the factors that contributed to success [31]. Research Note 10.7 examines the effect of product novelty on performance.
Our own research confirms that different managerial processes, structures, and tools are appropriate for routine and novel development projects (see Table 10.2). For example, in terms of frequency of use, the most common methods used for high novelty projects are segmentation, prototyping, market experimentation, and industry experts, whereas for the less novel projects the most common methods are partnering customers, trend extrapolation, and segmentation. The use of market experimentation and industry experts might be expected where market requirements or technologies are uncertain, but the common use of segmentation for such projects is harder to justify. However, in terms of usefulness, there are statistically significant differences in the ratings for segmentation, prototyping, industry experts, market surveys, and latent needs analysis. Segmentation is the only method more effective for routine development projects, and prototyping, industry experts, focus groups, and latent needs analysis are all more effective for novel development projects. For example, IDEO, the global design and development consultancy, finds conventional market research methods insufficient and sometimes misleading for new products and services, and instead favors the use of direct observation and prototyping.
TABLE 10.2 The Influence of Product Novelty on the Effectiveness of Tools Used for Product Development
Source: Based on data from Tidd, J. and K. Bodley, Effect of project novelty on the effectiveness of tools used to support new product development. R&D Management, 2002. 32(2), 127–38.
| High Novelty | Low Novelty | |||
| Usage (%) | Usefulness | Usage (%) | Usefulness | |
| Segmentation* | 89 | 3.42 | 42 | 4.50 |
| Prototyping* | 79 | 4.33 | 63 | 4.08 |
| Market experimentation | 63 | 4.00 | 53 | 3.70 |
| Industry experts* | 63 | 3.83 | 37 | 3.71 |
| Surveys/focus groups* | 52 | 4.50 | 37 | 4.00 |
| Trend extrapolation | 47 | 4.00 | 47 | 3.44 |
| Latent needs analysis* | 47 | 3.89 | 32 | 3.67 |
| User-practice observation | 47 | 3.67 | 42 | 3.50 |
| Partnering customers | 37 | 4.43 | 58 | 3.67 |
| User-developers | 32 | 4.33 | 37 | 3.57 |
| Scenario development | 21 | 3.75 | 26 | 2.80 |
| Role-playing | 5 | 4.00 | 11 | 1.00 |
* Denotes difference in usefulness rating is statistically significant at 5% level (n = 50).
Clearly then, many of the standard marketing tools and techniques are of limited utility for the development and commercialization of novel or complex new products or services. A number of weaknesses can be identified:
- Identifying and evaluating novel product characteristics Marketing tools such as conjoint analysis have been developed for variations of existing products or product extensions, and therefore are of little use for identifying and developing novel products or applications.
- Identifying and evaluating new markets or businesses Marketing techniques such as segmentation are most applicable to relatively mature, well-understood products and markets, and are of limited use in emerging, ill-defined markets.
- Promoting the purchase and use of novel products and services The traditional distinction between consumer and business marketing is based on the characteristics of the customers or users, but the characteristics of the innovation and the relationship between developers and users are more important in the case of novel and complex products and services.
Table 10.2 shows the influence of product novelty on the effectiveness of tools used for product development.
Therefore, before applying the standard marketing techniques, we must have a clear idea of the maturity of the technologies and markets. Figure 10.5 presents a simple two-by-two matrix, with technological maturity as one dimension, and market maturity as the other. Each quadrant raises different issues and will demand different techniques for development and commercialization:
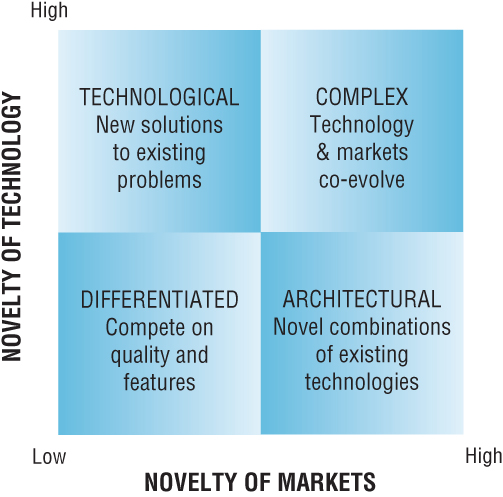
FIGURE 10.5 How technological and market maturity influence the commercialization process.
- Differentiated Both the technologies and markets are mature, and most innovations consist of the improved use of existing technologies to meet a known customer need. Products and services are differentiated on the basis of packaging, pricing, and support. For example, see Case Study 10.1 on IDEO.
- Architectural Existing technologies are applied or combined to create novel products or services, or new applications. Competition is based on serving specific market niches and on close relations with customers. Innovation typically originates or is in collaboration with potential users.
- Technological Novel technologies are developed that satisfy known customer needs. Such products and services compete on the basis of performance, rather than price or quality. Innovation is mainly driven by developers.
- Complex Both technologies and markets are novel, and coevolve. In this case, there is no clearly defined use of a new technology, but over time developers’ work with lead users to create new applications. The development of multimedia products and services is a recent example of such a coevolution of technologies and markets.
Assessing the maturity of a market is particularly difficult, mainly due to the problem of defining the boundaries of a market. The real rate of growth of a market provides a good estimate of the stage in the product life cycle and, by inference, the maturity of the market. In general, high rates of market growth are associated with high R&D costs, high marketing costs, rising investment in capacity, and high product margins (see Figure 10.6). At the firm level, there is a significant correlation between expenditure on R&D, number of new product launches, and financial measures of performance such as value added and market to book value [32]. Generally, profitability declines as a market matures as the scope for product and service differentiation reduces, and competition shifts toward price.
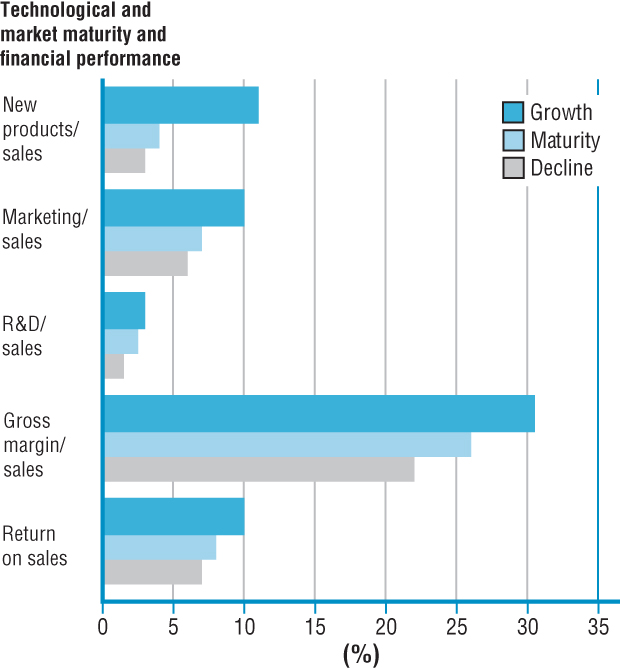
FIGURE 10.6 How market maturity influences resources and performance.
Source: Based on data from Buzzell, R.D. and B.T. Gale, The PIMS Principle, 1987, Free Press, New York.
10.4 Differentiating Products
Here we are concerned with the specific issue of how to differentiate a product from competing offerings where technologies and markets are relatively stable. It is in these circumstances that the standard tools and techniques of marketing are most useful. We assume that the reader is familiar with the basics of marketing, so here we shall focus on product differentiation by quality and other attributes.
Differentiation measures the degree to which competitors differ from one another in a specific market. Markets in which there is little differentiation and no significant difference in the relative quality of competitors are characterized by low profitability, whereas differentiation on the basis of relative quality or other product characteristics is a strong predictor of high profitability in any market conditions. Where a firm achieves a combination of high differentiation and high perceived relative quality, the return on investment is typically twice that of nondifferentiated products. Analysis of the Strategic Planning Institute’s database of more than 3000 business units helps us to identify the profit impact of market strategy (PIMS) [33]:
- High relative quality is associated with a high return on sales One reason for this is that businesses with higher relative quality are able to demand higher prices than their competitors. Moreover, higher quality may also help reduce costs by limiting waste and improving processes. As a result, companies may benefit from both higher prices and lower costs than competitors, thereby increasing profit margins.
- Good value is associated with increased market share Plotting relative quality against relative price provides a measure of relative value: high quality at a high price represents average value, but high quality at a low price represents good value. Products representing poor value tend to lose market share, but those offering good value gain market share.
- Product differentiation is associated with profitability Differentiation is defined in terms of how competitors differ from each other within a particular product segment. It can be measured by asking customers to rank the individual attributes of competing products and to weight the attributes. Customer weighting of attributes is likely to differ from that of the technical or marketing functions.
Analysis of the PIMS data reveals a more detailed picture of the relationships between innovation, value, and market performance (see Figure 10.7). Process innovation helps to improve relative quality and to reduce costs, thereby improving the relative value of the product. Product innovation also affects product quality, but has a greater effect on reputation and value. Together, innovation, relative value, and reputation drive growth in market share. For example, there is an almost linear relationship between product innovation and market growth: businesses with low levels of product innovation – that is having less than 1% of products introduced in the last three years – experience an average real annual market growth of less than 1%; whereas businesses with high levels – that is having around 8% of products introduced in the past three years – experience real annual market growth of around 8% [34]. The compound effect of such differences in real growth can have a significant impact on relative market share over a relatively short period of time. However, in consumer markets maintaining high levels of new product introduction is necessary, but not sufficient. In addition, reputation, or brand image, must be established and maintained, as without it consumers are less likely to sample new product offerings whatever the value or innovativeness. Witness the rapid and consistent growth of Samsung and decline of Nokia in the mobile phone market (see Case Study 10.2).
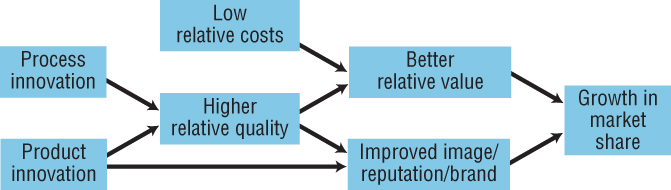
FIGURE 10.7 Relationship between innovation and performance in fast-moving consumer goods.
Source: Clayton, T. and G. Turner, Brands, innovation and growth. In Tidd, J. ed., From knowledge management to strategic competence: Measuring technological, market and organizational innovation. 2012, London: Imperial College Press/World Scientific Publishing Co.
Quality function deployment (QFD) is a useful technique for translating customer requirements into development needs and encourages communication between engineering, production, and marketing. Unlike most other tools of quality management, QFD is used to identify opportunities for product improvement or differentiation, rather than to solve problems. Customer-required characteristics are translated or “deployed” by means of a matrix into language that engineers can understand (see Figure 10.8). The construction of a relationship matrix – also known as “the house of quality” – requires a significant amount of technical and market research. Great emphasis must be made on gathering market and user data in order to identify potential design trade-offs and to achieve the most appropriate balance between cost, quality, and performance.
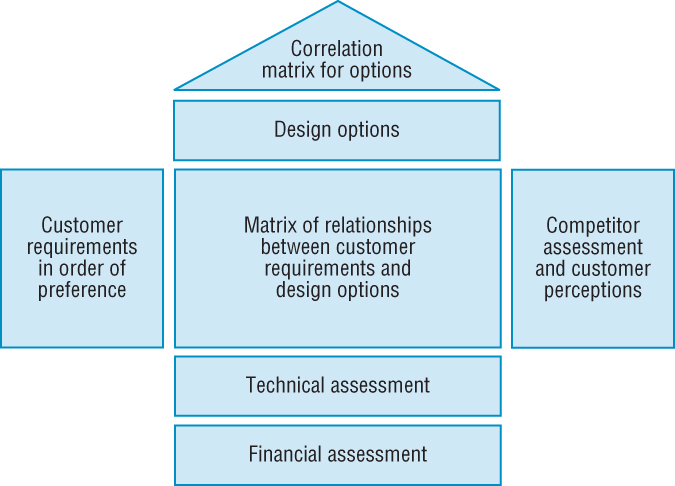
FIGURE 10.8 Quality function development (QFD) matrix.
The construction of a QFD matrix involves the following steps [35]:
- Identify customer requirements, primary and secondary, and any major dislikes.
- Rank requirements according to importance.
- Translate requirements into measurable characteristics.
- Establish the relationship between the customer requirements and technical product characteristics and estimate the strength of the relationship.
- Choose appropriate units of measurement and determine target values based on customer requirements and competitor benchmarks.
Symbols are used to show the relationship between customer requirements and technical specifications and weights attached to illustrate the strength of the relationship. Horizontal rows with no relationship symbol indicate that the existing design is incomplete. Conversely, vertical columns with no relationship symbol indicate that an existing design feature is redundant as it is not valued by the customer. In addition, comparisons with competing products, or benchmarks, can be included. This is important because relative quality is more relevant than absolute quality: customer expectations are likely to be shaped by what else is available, rather than some ideal.
In some cases, potential users may have latent needs or requirements that they cannot articulate. In such cases, three types of user needs can be identified: “must be’s,” “one-dimensionals,” and attractive features or “delighters [36].” Must be’s are those features that must exist before a potential customer will consider a product or service. For example, in the case of an executive car, it must be relatively large and expensive. One-dimensionals are the more quantifiable features that allow direct comparison between competing products – for example, in the case of an executive car, the acceleration and braking performance. Finally, the delighters are the most subtle means of differentiation. The inclusion of such features delights the target customers, even if they do not explicitly demand them. For example, delighters in the case of an executive car might include self-parking or other parking aids. Such features are rarely demanded by customers or identified by regular market research. However, indirect questioning can be used to help identify latent requirements.
QFD was originally developed in Japan and is claimed to have helped Toyota to reduce its development time and costs by 40%. More recently, many leading American firms have adopted QFD, including AT&T, Digital, and Ford, but results have been mixed: only around a quarter of projects have resulted in any quantifiable benefit [37]. In contrast, there has been relatively little application of QFD by European firms. This is not the result of ignorance, but rather a recognition of the practical problems of implementing QFD.
Clearly, QFD requires the compilation of a lot of marketing and technical data, and more importantly the close cooperation of the development and marketing functions. Indeed, the process of constructing the relationship matrix provides a structured way of getting people from development and marketing to communicate, and therefore is as valuable as any more quantifiable outputs. However, where relations between the technical and marketing groups are a problem, which is too often the case, the use of QFD may be premature.
10.5 Building Architectural Products
Architectural products consist of novel combinations of existing technologies that serve new markets or applications. In such cases, the critical issue is to identify or create new market segments.
Market share is associated with profitability: on average, market leaders earn three times the rate of return of businesses ranked fifth or less [38]. Therefore, the goal is to segment a market into a sufficiently small and isolated segment, which can be dominated and defended. This allows the product and distribution channels to be closely matched to the needs of a specific group of customers.
Market or buyer segmentation is simply the process of identifying groups of customers with sufficiently similar purchasing behavior so that they can be targeted and treated in a similar way. This is important because different groups are likely to have different needs. By definition, the needs of customers in the same segment will be highly homogeneous. In formal statistical terms, the objective of segmentation is to maximize across-group variance and to minimize within-group variance.
In practice, segmentation is conducted by analyzing customers’ buying behavior and then using factor analysis to identify the most significant variables influencing behavior – descriptive segmentation – and then using cluster analysis to create distinct segments that help identify unmet customer needs – prescriptive segmentation. The principle of segmentation applies to both consumer and business markets, but the process and basis of segmentation are different in each case.
Segmenting Consumer Markets
Much of the research on the buying behavior of consumers is based on theories adapted from the social and behavioral sciences. Utilitarian theories assume that consumers are rational and make purchasing decisions by comparing product utility with their requirements. This model suggests a sequence of phases in the purchasing decision: problem recognition, information search, evaluation of alternatives, and finally the purchase. However, such rational processes do not appear to have much influence on actual buying behavior. For example, in the United Kingdom, the Consumers’ Association routinely tests a wide range of competing products and makes buying recommendations based on largely objective criteria. If the majority of buyers were rational, and the Consumers’ Association successfully identified all relevant criteria, these recommendations would become best-sellers, but this is not the case.
Behavioral approaches have greater explanatory power. These emphasize the effect of attitude and argue that the buying decision follows a sequence of changing attitudes to a product – awareness, interest, desire, and finally action. The goal of advertising is to stimulate this sequence of events. However, research suggests that attitude alone explains only 10% of decisions and can rarely predict buyer behavior.
In practice, the balance between rational and behavioral influences will depend on the level of customer involvement. Clearly, the decision-making process for buying an aircraft or machine tool is different from the process of buying a toothpaste or shampoo. Many purchasing decisions involve little cost or risk, and therefore low involvement. In such cases, consumers try to minimize the financial, mental, and physical effort involved in purchasing. Advertising is most effective in such cases. In contrast, in high-involvement situations, in which there is a high cost or potential risk to customers, buyers are willing to search for information and make a more informed decision. Advertising is less effective in such circumstances and is typically confined to presenting comparative information between rival products. See Case Study 10.3 discusses the failure of conventional marketing and advertising methods.
There are many bases of segmenting consumer markets, including by socioeconomic class, life cycle groupings, and by lifestyle or psychographic (psychological–demographic) factors. High-level, crude categories such as baby-boomers or postmillennials are not sufficient to predict buying preferences. An example of psychographic segmentation is the Taylor–Nelson classification that consists of self-explorers, social registers, experimentalists, achievers, belongers, survivors, and the aimless. Better-known examples include the yuppy (young upwardly mobile professional) and dinky (dual income, no kids), and the more recent yappy (young affluent parent), sitcoms (single income, two children, oppressive mortgage), and skiers (spending the kids’ inheritance). There is often a strong association between a segment and particular products and services. For example, the personal characteristics and values of those that prefer Apple products are very different from those that choose Android devices.
Such segmentation is commonly used for product development and marketing in fast-moving consumer goods such as foods or toiletries and consumer durables such as consumer electronics or cars (see Case study 10.3). It is of particular relevance in the case of product variation or extension but can also be used to identify opportunities for new products, such as functional foods for the health conscious, and emerging requirements such as new pharmaceuticals and health care services for the wealthy elderly.
Segmenting Business Markets
Business customers tend to be better informed than consumers and, in theory at least, make more rational purchasing decisions. Business customers can be segmented on the basis of common buying factors or purchasing processes. The basis of segmentation should have clear operational implications, such as differences in preferences, pricing, distribution, or sales strategy. For example, customers could be segmented on the basis of how experienced, sophisticated, or price-sensitive they are. However, the process is complicated by the number of people involved in the buying process:
- The actual customer or buyer, who typically has the formal authority to choose a supplier and agree to terms of purchase.
- The ultimate users of the product or service, who are normally, but not always, involved in the initiation and specification of the purchase.
- Gatekeepers, who control the flow of information to the buyers and users.
- Influencers, who may provide some technical support to the specification and comparison of products.
Therefore, it is critical to identify all relevant parties in an organization and determine the main influences on each. For example, technical personnel used to determine the specification may favor performance, whereas the actual buyer may stress value for money.
The most common basis of business segmentation is by the benefits customers derive from the product, process, or service. Customers may buy the same product for very different reasons and attach different weightings to different product features. For example, in the case of a new numerically controlled machine tool, one group of customers may place the greatest value on the reduction in unit costs it provides, whereas another group may place greater emphasis on potential improvements in precision or quality of the output. See Case Study 10.4 for an example of the marketing of a complex technological innovation, a smart card.
It is difficult in practice to identify distinct segments by benefit because these are not strongly related to more traditional and easily identifiable characteristics such as firm size or industry classification [39]. Therefore, benefit segmentation is only practical where such preferences can be related to more easily observable and measurable customer characteristics. For example, in the case of the machine tool, analysis of production volumes, batch sizes, operating margins, and value-added might help differentiate between those firms that value higher efficiency from those that seek improvements in quality.
This suggests a three-stage segmentation process for identifying new business markets:
- First, a segmentation based on the functionality of the technology, mapping functions against potential applications.
- Next, a behavioral segmentation to identify potential customers with similar buying behavior, for example, regarding price or service.
- Finally, combine the functional and behavioral segmentations in a single matrix to help identify potential customers with relevant applications and buying behavior.
In addition, the analysis of competitors’ products and customers may reveal segments not adequately served, or alternatively an opportunity to redefine the basis of segmentation. For example, existing customers may be segmented on the basis of size of company, rather than the needs of specific sectors or particular applications. However, in the final analysis, segmentation only provides a guide to behavior as each customer will have unique characteristics.
There is likely to be a continuum of customer requirements, ranging from existing needs to emerging requirements and latent expectations, and these must be mapped onto existing and emerging technologies [40]. Whereas much of conventional market research is concerned with identifying the existing needs of customers and matching these to existing technological solutions; in this case, the search has to be extended to include emerging and new customer requirements. There are three distinct phases of analysis:
- Cross-functional teams including customers are used to generate new product concepts by means of brainstorming, morphology, and other structured techniques.
- These concepts are refined and evaluated, using techniques such as QFD.
- Parallel prototype development and market research activities are conducted. Prototypes are used not as “master models” for production, but as experiments for internal and external customers to evaluate.
Where potential customers are unable to define or evaluate product design features, in-depth interview clinics must be carried out with target focus groups or via antenna shops. In antenna shops, market researchers and engineers conduct interactive customer interviews and use marketing research tools and techniques to identify and quantify perceptions about product attributes.
Product mapping can be used to expose the technological and market drivers of product development and allows managers to explore the implications of product extensions. It helps to focus development efforts and limit the scope of projects by identifying target markets and technologies. This helps to generate more detailed functional maps for design, production, and marketing. An initial product introduction, or “core” product, can be extended in a number of ways:
- An enhanced product, which includes additional distinctive features designed for an identified market segment.
- An “up-market” extension. This can be difficult because customers may associate the company with a lower quality segment. Also, sales and support staff may not be sufficiently trained or skilled for the new segments.
- A “down-market” extension. This runs the risk of cannibalizing sales from the higher end and may alienate existing customers and dealers.
- Custom products with additional features required by a specific customer or distribution channel.
- A hybrid product, produced by merging two core designs to produce a new product.
As we discussed in Chapter 2, in his detailed analysis of the disk drive industry, Clayton Christensen distinguishes between two types of architectural innovation [41]. The first, sustaining innovation that continues to improve existing product functionality for existing customers and markets. The second, disruptive innovation provides a different set of functions, which are likely to appeal to a very different segment of the market. As a result, existing firms and their customers are likely to undervalue or ignore disruptive innovations, as these are likely to underperform existing technologies in terms of existing functions in established markets. This illustrates the danger of simplistic advice such as “listening to customers” and the limitations of traditional management and marketing approaches. Therefore, established firms tend to be blind to the potential of disruptive innovation, which is more likely to be exploited by new entrants. Segmentation of current markets and close relations with existing customers will tend to reinforce sustaining innovation, but will fail to identify or wrongly reject potential disruptive innovations. Instead firms must develop and maintain a detailed understanding of potential applications and changing users’ needs.
A fundamental issue in architectural innovation is to identify the need to change the architecture itself, rather than just the components within an existing architecture. New product introduction is, up to a point, associated with higher sales and profitability, but very high rates of product introduction become counterproductive as increases in development costs exceed additional sales revenue. This was the case in the car industry, when Japanese manufacturers reduced the life cycle to just four years in the 1990s, but then had to extend it again. Alternatively, expectations of new product introductions can result in users skipping a generation of products in anticipation of the next generation. This has happened in both the PC and mobile phone markets, which has had knock-on effects in the chip industry. Put another way, there is often a trade-off between high rates of new product introduction and product life. The development of common product platforms and increased modularity is one way to try to tackle this trade-off in new product development. See for example, see Case Study 10.5 that shows how product development has transformed Jaguar Land Rover.
Incremental product innovation within an existing platform can either introduce benefits to existing customers, such as lower price or improved performance, or additionally attract new users and enter new market niches. A study of 56 firms and over 240 new products over a period of 22 years found that a critical issue in managing architectural innovation is the precise balance between the frequency of radical change of product platform, and incremental innovation within these platforms [42]. This suggests that a strategy of ever-faster new product development and introduction is not sustainable, but rather the aim should be to achieve an optimum balance between platform change and new product based on existing platforms. This logic appears to apply to both manufactured products and services, as discussed in Research Note 10.8.
10.6 Commercializing Technological Products
Technological products are characterized by the application of new technologies in existing products or relatively mature markets. In such cases, the key issue is to identify existing applications where the technology has a cost or performance advantage.
The traditional literature on industrial marketing has a bias toward relatively low-technology products and has failed largely to take into account the nature of high-technology products and their markets.
The first and most critical distinction to make is between a technology and a product [43]. Technologists are typically concerned with developing devices, whereas potential customers buy products, which marketing must create from the devices. Developing a product is much more costly and difficult than developing a device. Devices that do not function or are difficult to manufacture are relatively easy to identify and correct compared to an incomplete product offering. A product may fail or be difficult to sell due to poor logistics and branding, or difficult to use because insufficient attention has been paid to customer training or support. As a result, attempting to differentiate a product on the basis of its functionality or the performance of component devices can be expensive and futile.
For example, a personal computer (PC) is a product consisting of a large number of devices or subsystems, including the basic hardware and accessories, operating system, application programs, languages, documentation, customer training, maintenance and support, advertising and brand development. For example, a development in microprocessor technology, such as RISC (reduced instruction set computing), may improve the product performance in certain circumstances, but may be undermined by more significant factors such as lack of support for developers of software and therefore a shortage of suitable application software.
In the case of high-technology products, it is not sufficient to carry out a simple technical comparison of the performance of technological alternatives, and conventional market segmentation is unlikely to reveal opportunities for substituting a new technology in existing applications. It is necessary to identify why a potential customer might look for an alternative to the existing solution. It may be because of lower costs, superior performance, greater reliability, or simply fashion. In such cases, there are two stages to identify potential applications and target customers: technical and behavioral [44].
Statistical analysis of existing customers is unlikely to be of much use because of the level of detail required. Typically, technical segmentation begins with a small group of potential users being interviewed to identify differences and similarities in their requirements. The aim is to identify a range of specific potential uses or applications. Next, a behavioral segmentation is carried out to find three or four groups of customers with similar situations and behavior. Finally, the technical and behavioral segments are combined to define specific groups of target customer and markets that can then be evaluated commercially (see Figure 10.9). Clayton Christensen and Michael Raynor make a similar point in their book, The Innovator’s Solution, and argue that conventional segmentation of markets by product attributes or user types cannot identify potentially disruptive innovations, as demonstrated in Case Study 10.6.
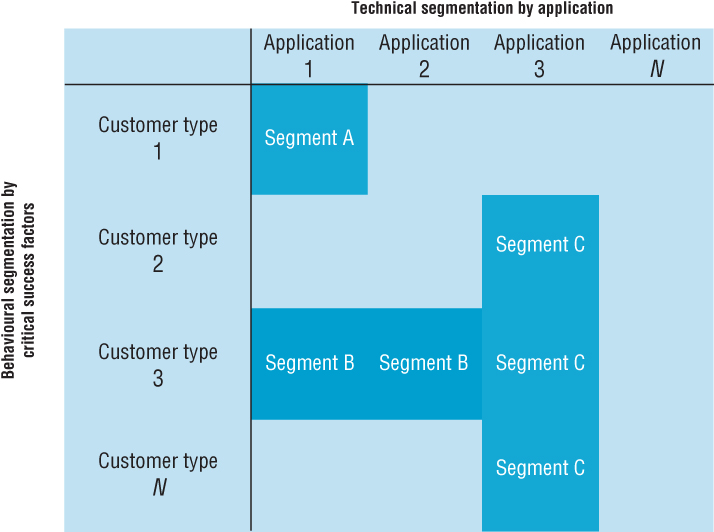
FIGURE 10.9 Technical and behavioral segmentation for high-technology products and services.
Several features are unique to the marketing of high-technology products and affect buying behavior [45]:
- Buyers’ perceptions of differences in technology affect buying behavior. In general, where buyers believe technologies to be similar, they are likely to search for longer than when they believe there to be significant differences between technologies.
- Buyers’ perceptions of the rate of change of the technology affect buying behavior. In general, where buyers believe that the rate of technological change is high, they put a lot of effort in the search for alternatives, but search for a shorter time. In noncritical areas, a buyer may postpone a purchase.
- Organizational buyers may have strong relationships with their suppliers, which increases switching costs. In general, the higher the supplier-related switching costs, the lower the search effort, but the higher the compatibility-related switching costs and the greater the search effort.
View 10.1 discusses how complex projects are assessed and developed in the oil industry.
10.7 Implementing Complex Products
Complex products or systems are a special case in marketing because neither the technology nor markets are well defined or understood. As a result, technology and markets coevolve over time, as developers and potential users interact. Note that technological complexity does not necessarily imply market complexity, or vice versa. For example, the development of a passenger aircraft is complex in a technological sense, but the market is well defined, and potential customers are easy to identify. We are concerned here with cases where both technologies and markets are complex – for example, telecommunications, multimedia, and pharmaceuticals.
The traditional distinction between consumer and industrial marketing in terms of the nature of users, rather than the products and services themselves, is therefore unhelpful. For example, a new industrial product or process may be relatively simple, whereas a new consumer product may be complex. The commercialization process for complex products has certain characteristics common to consumer and business markets [46]:
- Products are likely to consist of a large number of interacting components and subsystems, which complicates development and marketing.
- The technical knowledge of customers is likely to be greater, but there is a burden on developers to educate potential users. This requires close links between developers and users.
- Adoption is likely to involve a long-term commitment, and therefore the cost of failure to perform is likely to be high.
- The buying process is often lengthy, and adoption may lag years behind availability and receipt of the initial information.
The Nature of Complex Products
Complex products typically consist of a number of components or subsystems. Depending on how open the standards are for interfaces between the various components, products may be offered as bundled systems, or as subsystems or components. For bundled systems, customers evaluate purchases at the system level, rather than at the component level. For example, many pharmaceutical firms are now operating managed health care services rather than simply developing and selling specific drugs. Similarly, robot manufacturers offer “manufacturing solutions,” rather than stand-alone robot manipulators. Bundled systems can offer customers enhanced performance by allowing a package of optimized components using proprietary interfaces of “firmware,” and in addition may provide the convenience of a single point of purchase and after-sales support. However, bundled systems may not appeal to customers with idiosyncratic needs, or knowledgeable customers able to configure their own systems.
The growth of system integrators and “turnkey” solutions suggests that there is an additional value to be gained by developing and marketing systems rather than components: typically, the value added at the system level is greater than the sum of the value added by the components. There is, however, an important exception to this rule. In cases where a particular component or subsystem is significantly superior to competing offerings, unbundling is likely to result in a larger market [47]. The increased market is due to additional customers who would not be willing to purchase the bundled system, but would like to incorporate one of the components or subsystems into their own systems. For example, Intel and Microsoft have captured the dominant market shares of microprocessors and operating systems, respectively, by selling components rather than by incorporating these into their own PCs.
Links Between Developers and Users
The development and adoption process for complex products, processes, and services is particularly difficult. The benefits to potential users may be difficult to identify and value, and because there are likely to be few direct substitutes available the market may not be able to provide any benchmarks. The choice of suppliers is likely to be limited, more an oligopolistic market than a truly competitive one. In the absence of direct competition, price is less important than other factors such as reputation, performance and service, and support.
Innovation research has long emphasized the importance of “understanding user needs” when developing new products [48], but in the special case of complex products and services potential users may not be aware of, or may be unable to articulate, their needs. In such cases, it is not sufficient simply to understand or even to satisfy existing customers, but rather it is necessary to lead existing customers and identify potential new customers. Conventional market research techniques are of little use, and there will be a greater burden on developers to “educate” potential users. Hamel and Prahalad refer to this process as expeditionary marketing [49]. The main issue is how to learn as quickly as possible through experimentation with real products and customers, and thereby anticipate future requirements and preempt potential competitors.
The relationship between developers and users will change throughout the development and adoption process, as shown in Figure 10.10. Three distinct processes need to be managed, each demanding different linkages: development, adoption, and interfacing. The process of diffusion and adoption was examined in Chapter 9. However, relatively little guidance is available for managing the interface between the developers and adopters of an innovation.

FIGURE 10.10 Developer–adopter relationship for complex products.
The interface process can be thought of as consisting of two flows: information flows and resource flows [50]. Developers and adopters will negotiate the inflows and outflows of both information and resources. Therefore, developers should recognize that resources committed to development and resources committed to aiding adoption should not be viewed as independent or “ring-fenced.” Both contribute to the successful commercialization of complex products, processes, and services. Developers should also identify and manage the balance and direction of information and resource flows at different stages of the process of development and adoption. For example, at early stages, managing information inflows may be most important, but at later stages, managing outflows of information and resources may be critical. In addition, learning will require the management of knowledge flows, involving the exchange or secondment of appropriate staff.
Two dimensions help determine the most appropriate relationship between developers and users: the range of different applications for an innovation; and the number of potential users of each application [51]:
- Few applications and few users In this case, direct face-to-face negotiation regarding the technology design and use is possible.
- Few applications, but many users This is the classic marketing case, which demands careful segmentation, but little interaction with users.
- Many applications, but few users In this case, there are multiple stakeholders among the user groups, with separate and possibly conflicting needs. This requires skills to avoid optimization of the technology for one group at the expense of others. The core functionality of the technology must be separated and protected and custom interfaces developed for the different user groups.
- Many applications and different users In this case, developers must work with multiple archetypes of users, and therefore aim for the most generic market possible, customized for no one group.
In general, where there are relatively few potential users, as is usually the case with complex products for business customers, customers are likely to demand that developers have the capability to solve their problems, and be able to transfer the solution to them. However, customer expectations vary by sector and nationality. For example, firms in the paper and pulp industry do not expect suppliers to have strong problem-solving capabilities, but do require solutions to be adapted to their specific needs. Conversely, firms in the speciality steel industry demand suppliers to possess strong problem-solving capabilities. Overall, German and Swedish customers expect suppliers to have problem solving and adaptation capabilities, but British, French, and Italian customers appear to be less demanding [52].
Adoption of Complex Products
The buying process for complex products is likely to be lengthy due to the difficulty of evaluating risk and subsequent implementation. Perceived risk is a function of a buyer’s level of uncertainty and the seriousness of the consequences of the decision to purchase. There are two types of risk: the performance risk, that is the extent to which the purchase meets expectations; and the psychological risk associated with how other people in the organization react to the decision. Low-risk decisions are likely to be made autonomously; and therefore, it is easier to target decision makers and identify buying criteria. For complex products, there is greater uncertainty, and the consequences of the purchase are more significant, and therefore, some form of joint or group decision making is likely.
If there is general agreement concerning the buying criteria, a process of information gathering and deliberation can take place in order to identify and evaluate potential suppliers. However, if there is disagreement concerning the buying criteria, a process of persuasion and bargaining is likely to be necessary before any decision can be made.
In the case of organizational purchases, the expectations, perceptions, roles, and ideas of risk of the main decision-makers may vary. As a result, we should expect and identify the different buying criteria used by various decision-makers in an organization. For example, a production engineer may favor the reliability or performance of a piece of equipment, whereas the finance manager is likely to focus on lifecycle costs and value for money, as illustrated in Case Study 10.7. Three factors are likely to affect the purchase decision in an organization [53]:
- Political and legal environment This may affect the availability of, and information concerning, competing products. For example, government legislation might specify the tender process for the development and purchase of new equipment.
- Organizational structure and tasks Structure includes the degree of centralization of decision making and purchasing; tasks include the organizational purpose served by the purchase, the nature of demand derived from the purchaser’s own business, and how routine the purchase is.
- Personal roles and responsibilities Different roles need to be identified and satisfied. Gatekeepers control the flow of information to the organization, influencers add information or change buying criteria, deciders choose the specific supplier or brand, and the buyers are responsible for the actual purchase. Consequently, the ultimate users may not be the primary target.
10.8 Service Innovation
Employment trends in all the so-called advanced countries indicate a move away from manufacturing, construction, mining, and agriculture, toward a range of services, including retail, finance, transportation, communication, entertainment, professional, and public services. This trend is in part because manufacturing has become so efficient and highly automated, and therefore, generates proportionately less employment; and partly because many services are characterized by high levels of customer contact and are reproduced locally, and are therefore often labor-intensive. In the most advanced service economies such as the United States and the United Kingdom, services create up to three-quarters of the wealth and 85% of employment, and yet we know relatively little about managing innovation in this sector. The critical role of services, in the broadest sense, has long been recognized, but service innovation is still not well understood.
Innovation in services is much more than the application of information technology (IT). In fact, the disappointing returns to IT investments in services have resulted in a widespread debate about its causes and potential solutions – the so-called “productivity paradox” in services. Frequently service innovations, which make significant differences to the ways customers use and perceive the service delivered, will not only demand major investments in process innovation and technology by service providers but also demand investment in skills and methods of working to change the business model, as well as major marketing changes. Estimates vary, but returns on investment on IT alone are around 15%, with a typical lag of two to three years, when productivity often falls, but when combined with changes in organization and management these returns increase to around 25% [54].
In the service sector, the impact of innovation on growth is generally positive and consistent, with the possible exception of financial services. The pattern across retail and wholesale distribution, transport and communication services, and the broad range of business services is particularly strong, as shown in Figure 10.11.
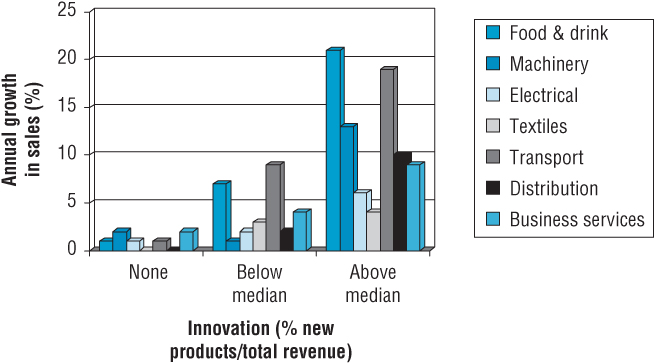
FIGURE 10.11 Innovation and growth in the service sector.
Source: Based on data from European Community Innovation Survey. Based on a survey of 2000 UK service businesses.
Most research and management prescriptions have been based on the experience of manufacturing and high-technology sectors. Most simply assume that such practices are equally applicable to managing innovation in services, but some researchers argue that services are fundamentally different. There is a clear need to distinguish what, if any, of what we know about managing innovation in manufacturing is applicable to services, what must be adapted, and what is distinct and different.
We will argue that generic good practices do exist, which apply to both the development of manufactured and service offerings, but that these must be adapted to different contexts, specifically the scale and complexity, degree of customization of the offerings, and the uncertainty of the technological and market environments. It is critical to match the configuration of management and organization of development to the specific technology and market environment.
The service sector includes a very wide range and a great of diversity of different activities and businesses, ranging from individual consultants and shopkeepers to huge multinational finance firms and critical nonprofit public and third-sector organizations such as government, health, and education. Therefore, great care needs to be taken when making any generalization about the service sectors. We will introduce some ways of understanding and analyzing the sector later, but it is possible to identify some fundamental differences between manufacturing and service operations:
- Tangibility. Goods tend to be tangible, whereas services are mostly intangible, even though you can usually see or feel the results.
- Perceptions of performance and quality are more important in services, in particular, the difference between expectations and perceived performance. Customers are likely to regard a service as being good if it exceeds their expectations. Perceptions of service quality are affected by:
- tangible aspects – appearance of facilities, equipment, and staff
- responsiveness – prompt service and willingness to help
- competence – the ability to perform the service dependably
- assurance – knowledge and courtesy of staff and ability to convey trust and confidence
- empathy – provision of caring, individual attention.
- Simultaneity. The lag between production and consumption of goods and services is different. Most goods are produced well in advance of consumption, to allow for distribution, storage, and sales. In contrast, many services are produced and almost immediately consumed. This creates problems of quality management and capacity planning. It is harder to identify or correct errors in services and more difficult to match supply and demand.
- Storage. Services cannot usually be stored, for example, a seat on an airline, although some, such as utilities, have some potential for storage. The inability to hold stocks of services can create problems matching supply and demand – capacity management. These can be dealt with in a number of ways. Pricing can be used to help smooth fluctuations in demand, for example by providing discounts at off-peak times. Where possible, additional capacity can be provided at peak times by employing part-time workers or outsourcing. In the worst cases, customers can simply be forced to wait for the services, by queuing.
- Customer contact. Most customers have low or no contact with the operations which produce goods. Many services demand high levels of contact between the operations and ultimate customer, although the level and timing of such contact varies. For example, medical treatment may require constant or frequent contact, but financial services only sporadic contact.
- Location. Because of the contact with customers and near simultaneous production and consumption of services, the location of service operations is often more important than for operations that produce goods. For example, restaurants, retail operations, and entertainment services all favor proximity to customers. Conversely, manufactured goods are often produced and consumed in very different locations. For these reasons, the markets for manufactured goods also tend to be more competitive and global, whereas many personal and business services are local and less competitive. For example, only around 10% of services in the advanced economies are traded internationally.
These service characteristics should be taken into account when designing and managing the organization and processes for new service development, as some of the findings from research on new product development will have to be adapted or may not apply at all. Also, because of the diversity of service operations, we need also to tailor the organization and management to different types of service context.
In practice, most operations produce some combination of goods and services. It is possible to position any operation on a spectrum from “pure” products or goods through to “pure” services. For example, a restaurant or retail operation both have tangible goods on offer, but in most cases, the service provided is at least equally important. Conversely, most manufacturers now offer some after-sales service and support to customers.
However, the distinction between goods and services remains important because the differences in their characteristics demand a different approach to management and organization. It is perhaps better to think of any business or operation as offering a bundle of benefits, some of which will be tangible, some not, and from this decide the appropriate mix of products and services to be produced.
The service sector includes a wide range of very different operations, including low-skilled personal services such as cleaners, higher skilled personal services such as tradesmen, business services such as lawyers and bankers, and mass consumer services such as transportation, telecommunications, and public administration. Critical dimensions that can be used to segment services include labor intensity of the operations, that is the ratio of labor costs to equipment costs, and the degree of customization or interaction with customers [55].
To identify common characteristics of service innovators, we have examined over 100 service businesses from the PIMS database and separated out those which have the highest sustained new service content in their revenue, as shown in Table 10.3.
TABLE 10.3 Characteristics of Service “High Innovators”
Source: Clayton, T., in Tidd, J. and F.M. Hull, eds, Service innovation: Organizational responses to technological opportunities and market imperatives. 2003, London: Imperial College Press, Reproduced with permission.
| Business Descriptor | Low Innovators | High Innovators |
| Innovation Outcomes | ||
|
• % sales from services introduced <3 years ago |
<1% | 17% |
| • % new services versus competitors | >0% | 5% |
| Customer Base | ||
| • Focus on key customers | Average | High |
| • Relative customer base | Similar to competitors | More focused than competitors |
| Value Chain | ||
| • Focus on key suppliers | Average | High/strategic |
| • Value-added/sales % | 72% | 60% |
| • Operating cost added/sales | 36% | 25% |
| • Vertical integration versus competitors | Same or more | Same or less |
| Innovation Input | ||
| • “What” R&D | 0.1% sales | 0.7% sales |
| • “How” R&D | 0.1% sales | 0.5% sales |
| • Fixed assets/sales | growing at 10% p.a. | growing at >20% p.a. |
| • Overheads/sales % | 8% | 11% |
| Innovation Context | ||
| • Recent technology change | 20% | 40% |
| • Time to market | >1 year | <1 year |
| Competition | ||
| • Competitor entry | 10% | 40% |
| • Imports/exports versus market | 2% | 12% |
| Quality of Offer | ||
| • Relative quality versus competitors | Declining | Improving |
| • Value for money | Just below competitors | Better than competitors |
| Output | ||
| • Real sales | 9% | 15% |
Not surprisingly, high innovators spend more on R&D, to change both what they deliver to customers and how they deliver it. In addition, they have often experienced technological change and invested in fixed assets to do so. They usually take less than a year to bring new service concepts to market. Competition is also an important factor. The highest innovating firms are more than likely to have experienced entry into their markets by a significant new competitor. They are also much more likely to compete in open markets where international trade – both imports and exports – plays an important role.
The data also indicate that focus is an important discriminating factor between high and low service innovators. First, those businesses with the highest level of new service content tend to avoid overcomplicating their customer base. They are usually firms for which fewer key customer segments account for a higher proportion of their total revenue. This suggests that customer complexity can be a barrier to effective innovation in service businesses. This “focus” service strategy is well demonstrated by the rise of “no frills” air services in the United States and Europe since the mid-1990s, such as Southwest, Ryanair, and EasyJet. Second, it seems that focus in the procurement and service delivery process is also an aid to stronger innovation performance. High innovators tend to focus their purchases on fewer, larger suppliers, and are less vertically integrated – and therefore focused on fewer internal processes within the overall value chain.
However, persuading customers to buy new services at a premium can be difficult. Most of our “innovation winners” operate with a policy of parity pricing of using their service advantage to go for growth, rather than to exploit it for maximum immediate profits. They grow real sales significantly faster, they grow share of their target markets faster than their direct competitors, and noninnovators generally, and in addition they increase their returns on capital employed and assets.
Research Note 10.9 identifies four different types of service innovation organizations. Each appears to have evolved or acquired sufficient good practices to be viable at least in niche markets. The client project orientated reduces time to market and improves service delivery by focusing on customer requirements and project management; the mechanistic customization reduces costs by setting standards and through the involvement of suppliers and customers; the hybrid knowledge sharing provides a combination of innovation and efficiency by promoting team work and knowledge sharing; and the integrated innovative raises innovation and quality by means of cross-functional groups supported by groupware and other tools and technology, but this increased coordination raises the time and cost of service development.
Examination of the actual measures suggests that each of the four organizational configurations provides several common elements, including:
- organizational mode of bringing people together
- control mechanisms, either impersonal (standards, documentation, common software) or interpersonal (collocated teams)
- shared knowledge and/or technical information base
- external linkages, for example, customers and/or partners/suppliers.
In terms of performance, innovation and quality appear to be improved by cross-functional teams and sharing information, raised by involvement with customers and suppliers, and by encouraging collaboration in teams. Service delivery is improved by customer focus and project management and by knowledge sharing and collaboration in teams. Time to market is reduced by knowledge sharing and collaboration and customer focus and project organization, but cross-functional teams can prolong the process. Costs are reduced by setting standards for projects and products and by involvement of customers and suppliers, but can be increased by using cross-functional teams. Although individual practices can make a significant contribution to performance, it is clear that it is the coherent combination of practices and their interaction that creates superior performance in specific contexts, as shown in Figure 10.12.

FIGURE 10.12 Factors influencing the effectiveness of new service development.
Source: Tidd, J. and F.M. Hull, Managing service innovation: the need for selectivity rather than ‘best practice’, New Technology, Work and Employment, 2006. 21(2), 139–61.
Summary
There is a vast amount of management research on the subject of new product and service development, and we are now pretty certain what works and what does not. There are no guarantees that following the suggestions in this chapter will produce a blockbuster product, service or business, but if these elements are not managed well, your chances of success will be much lower. This is not supposed to discourage experimentation and calculated risk-taking, but rather to provide a foundation for evidence-based practice. Research suggests that a range of factors affect the success of a potential new product or service:
- Some factors are product-specific, for example, product advantage, clear target market, and attention to predevelopment activities.
- Other factors are more about the organizational context and process, for example, senior management support, formal process, and use of external knowledge.
- A formal process for new product and service development should consist of distinct stages, such as concept development, business case, product development, pilot and commercialization, separated by distinct decision points or gates, which have clear criteria such as product fit, product advantages, and so on.
- Different stages of the process demand different criteria and different tools and methods. Useful tools and methods at the concept stage include segmentation, experimentation, focus groups, and customer-partnering; and at the development stage, useful tools include prototyping, design for production, and QFD.
- Services and products are different in a number of ways, especially intangibility and perceived benefits, so will demand the adaptation of the standard models and prescriptions for new product development.
Chapter 10: Concept Check Questions
- What is the main difference between the development funnel and the stage‐gate approach to new product development?
- According to research on new product development, which of the following is NOT necessarily associated with success?
- In service innovation a major success factor to manage is the difference between expectations and perceived performance. Which of the following does NOT necessarily contribute to the perception of service performance?
- For developing novel products and services, which of the following tools is least useful?
- The lean start‐up approach to development typically does not feature:
Further Reading
The classic texts on new product development are those by Robert Cooper, for example, Winning at New Products (Basic Books, fourth edition, 2011), or Cooper, R.G. (2000) Doing it right: Winning with new products. Ivey Business Journal, 64(6), 1–7, or anything by Kim Clark and Steven Wheelwright, such as Wheelwright, S.C. and K. B. Clark, Creating project plans to focus product development, Harvard Business Review, September–October, 1997, or their book Revolutionizing Product Development (Free Press, 1992). Paul Trott provides a good review of research in his text Innovation Management and New Product Development (FT Prentice Hall, fifth edition, 2012), but for a more concise review of the research see Panne, van der, G., Beers, C. van, Kleinknecht, A., Success and failure of innovation: a literature review, International Journal of Innovation Management, 2003. 7(3), 309–38. A useful and practical handbook is The PDMA Handbook of New Product Development, edited by Kenneth Kahn (Wiley, third edition, 2013), which is particularly strong on process and tools. Fiona Schweitzer and Joe Tidd provide a review of methods to engage customers and users in the innovation process in Innovation Heroes: Understanding customers as valuable resources for innovating. World Scientific Press, London, 2018.
For more focused studies of new service development, see the recent article: Berry, L.L. et al. (2006) Creating new markets through service innovation, MIT Sloan Management Review, 47, 2. More comprehensive overviews of service innovation are provided by Ian Miles in the Special Issue on innovation in services, International Journal of Innovation Management, December, 2000, or in the books by Tidd and Hull: Service Innovation: Organizational Responses to Technological Opportunities and Market Imperatives (Imperial College Press, London, 2003); and Normann: Service Management – Strategy and Leadership in Service Business (John Wiley & Sons, Ltd, third edition, 2001). Recent comprehensive handbooks on service development, both of which we have contributed to, are: F. Djellal and C. Gallouj (editors), The Handbook of Innovation and Services (Edward Elgar, 2010), and Gavriel Salvendy and Waldemar Karwowski (eds.), Introduction to Service Engineering (Wiley, 2010). On the more specialist topic of creating value from technology and services, try Marketing Technology as a Service: Proven Techniques That Create Value, by Laurie Young and Bev Burgess (Wiley, 2010) and Frank Hull and Chris Storey’s Total Value Development (Imperial College Press, 2016).
There are few texts which focus exclusively on how to apply conventional marketing tools and techniques to innovative new products and processes, but the best attempts to date are the chapter on “Securing the future” in Gary Hamel and C. K. Prahalad’s Competing for the Future (Harvard Business School Press, 1994) and the chapter on “Learning from the market” in Dorothy Leonard-Barton’s Wellsprings of Knowledge (Harvard Business School Press, 1995). Dawn Iacobucci has edited an excellent compilation of current theory and practice of business-to-business and other relationship-based marketing in Networks in Marketing (Sage, 1996), much of which is relevant to the development and marketing of complex products and services. It also provides a sound introduction to the more general subject of networks, which was discussed in Chapter 6. We discuss the special case of complex product systems in a special issue of Research Policy, 29, 2000, and in The Business of Systems Integration, edited by Andrea Prencipe, Andy Davies and Mike Hobday (Oxford University Press, 2003).
A number of US texts cover the related but more narrow issue of marketing high-technology products, including William Davidow’s Marketing High Technology (Free Press, 1986) and Essentials of Marketing High Technology by William Shanklin and John Ryans, Jr (Lexington, 1987). The former is written by a practicing engineer/marketing manager, and therefore is strong on practical advice, and the latter is written by two academics, and provides a more coherent framework for analysis. Vijay Jolly’s Commercializing New Technologies (Harvard Business School Press, 1998) provides a process model based on the experiences of leading firms such as 3M and Sony, which consists of five sub-processes or stages, but the framework is biased toward mass consumer markets. Geoffrey Moore has produced a series of useful guides based on the experience of technology-based firms, beginning with Crossing the Chasm: Marketing and Selling Technology Products to Mainstream Customers (Third edition, HarperCollins, 2014).
Case Studies
Additional case studies are available on the companion website, including:
- Bank of Scotland, which explores service development in retail financial services, highlighting its similarity to product development for consumer goods. You can also read about innovation in law firms in which patterns of process innovation are discussed.
- BBC, which picks up on the theme of “hidden innovation” in the creative industries and media – for example, film and TV program development, which is not captured by traditional policy or measures such as R&D or patents.
References
- 1. Cooper, R.G., Winning at new products. 4th ed., 2011, New York: Basic Books; Cooper, R.G., Doing it right: Winning with new products. Ivey Business Journal, 2000. 64(6), 1–7; Wheelwright, S.C. and K.B. Clark, Revolutionizing product development: Quantum leaps in speed, efficiency and quality. 1992, New York: Free Press; Wheelwright, S.C. and K.B. Clark, Creating project plans to focus product development. Harvard Business Review, 1997. September–October.
- 2. Tidd, J. and K. Bodley, The affect of project novelty on the new product development process. R&D Management, 2002. 32(2), 127–38.
- 3. Hull, F.M. and C. Storey, Total value development: How to drive service Innovation. 2016, London: Imperial College Press; Altringer, B., A new model for innovation in big companies, Harvard Business Review, 2013, November.
- 4. Rothwell, R., The characteristics of successful innovators and technically progressive firms (with some comments on innovation research). R&D Management, 1977. 7(3), 191–206; Rothwell, R., Successful industrial innovation: critical factors for 1990s. R&D Management, 1992. 22(3), 221–39; Balbontin, A., B. Yazdani, R. Cooper, and W.E Souder, New product development success factors in American and British firms. International Journal of Technology Management, 1999. 17(3), 259–80; Brown, S.L. and K.M. Eisenhardt, Product development: Past research, present findings, and future directions. Academy of Management Review, 1995. 20(2), 343–78; Mishra, S., D. Kim, and D.H. Lee, Factors affecting new product success: Cross-country comparisons. Journal of Product Innovation Management, 1996. 13(6), 530–50; Ernst, H., Success factors of new product development: A review of the empirical literature. International Journal of Management Reviews, 2002. 4(1), 1–40.
- 5. Rothwell, R., The characteristics of successful innovators and technically progressive firms. R&D Management, 1977. 7(3), 191–206.
- 6. Langrish, J. et al., Wealth from knowledge. 1972, London: Macmillan.
- 7. Georghiou, L. et al., Post-innovation performance. 1986, Basingstoke: Macmillan.
- 8. Sherwin, C. and S. Isenson, Project hindsight. Science, 1967. 156, 571–7.
- 9. Isenson, R., Technology in retrospect and critical events in science (Project TRACES). 1968, Illinois Institute of Technology/National Science Foundation.
- 10. Carter, C. and B. Williams, Industry and technical progress. 1957, Oxford: Oxford University Press.
- 11. Van de Ven, A., H. Angle, and M. Poole, Research on the management of innovation. 1989, New York: Harper & Row.
- 12. Cooper, R.G., Winning at new products, 4th ed. 2011, New York: Basic Books.
- 13. Maidique, M. and B. Zirger, The new product learning cycle. Research Policy, 1985. 14(6), 299–309.
- 14. Lilien, G. and E. Yoon, Success and failure in innovation – A review of the literature. IEEE Transactions on Engineering Management, 1989. 36(1), 3–10.
- 15. Rothwell, R., Successful industrial innovation: Critical success factors for the 1990s. R&D Management, 1992. 22(3), 221–39.
- 16. Utterback, J., Mastering the dynamics of innovation. 1994, Boston, MA: Harvard Business School Press, Boston, MA.
- 17. Von Hippel, E., The sources of innovation. 1988, Cambridge, MA: MIT Press.
- 18. Rosenau, M. et al. (eds), The PDMA handbook of new product development. 1996, New York: John Wiley & Sons, Inc.
- 19. Ernst, H., Success factors of new product development: A review of the empirical literature. International Journal of Management Reviews, 2002. 4(1), 1–40.
- 20. Souder, W. and S. Jenssen, Management practices influencing new product success and failure in the US and Scandinavia. Journal of Product Innovation Management, 1999. 16, 183–204. See also: Tidd, J. and B. Thuriaux-Alemán, Innovation management practices: Cross-Sectorial adoption, variation and effectiveness, R&D Management, in press; Graner, M. and M. Mißler-behr, Method application in new product development and the impact on cross-functional collaboration and new product success. International Journal of Innovation Management, 2014. 18(1), 1450002.
- 21. Christenson, C., The innovator’s dilemma. 1997, Boston, MA: Harvard Business School Press.
- 22. Eisenhardt, K. and S. Brown, The art of continuous change: Linking complexity theory and time-paced evolution in relentlessly shifting organizations. Administrative Science Quarterly, 1997. 42(1), 1–34.
- 23. Wheelwright, S. and K. Clark, Revolutionizing product development. 1992, New York: Free Press.
- 24. Walsh, V. et al., Winning by design: Technology, product design and international competitiveness. 1992. Oxford: Basil Blackwell.
- 25. Chiesa, V., P. Coughlan, and C. Voss, Development of a technical innovation audit. Journal of Product Innovation Management, 1996. 13(2), 105–36; Design Council, Living innovation, design council/Department of Trade and Industry, London; Francis, D., Developing innovative capability. 2001, Brighton: University of Brighton.
- 26. Leifer, R. et al., Radical innovation. 2000. Boston, MA: Harvard Business School Press.
- 27. Baden-Fuller, C. and J. Stopford, Rejuvenating the mature business. 1995, London: Routledge.
- 28. Von Stamm, B., Managing innovation, design and creativity. 2008; The innovation wave. 2003, Chichester: John Wiley & Sons, Ltd.
- 29. Tidd, J. and F.M. Hull, Managing service innovation: The need for selectivity rather than ‘best-practice’. New Technology, Work and Employment, 2006. 21(2), 139–61; Service innovation: Organizational responses to technological opportunities and market imperatives. 2003, London: Imperial College Press.
- 30. Lynn, G.S. and R.R. Reilly, R.R., Blockbusters: The five keys to developing great new products. 2002, New York: HarperBusiness.
- 31. Zacharias, N.A, R.M. Stock, and S. Im, Strategic givens in new product development: Understanding curvilinear effects on new product performance. International Journal of Innovation Management, 2016; Dvir, D., et al., In search of project classification: A non-universal approach to project success factors. Research Policy, 1998. 27, 915–35.
- 32. Tidd, J. and C. Driver, Technological and market competencies and financial performance. In J. Tidd, ed., From knowledge management to strategic competence: Measuring technological, market and organizational innovation, 2006, London: Imperial College Press, pp. 94–125.
- 33. Luchs, B., Quality as a strategic weapon. European Business Journal, 1990. 2(4), 34–47.
- 34. Clayton, T. and G. Turner, Brands, innovation and growth. In J. Tidd, ed., From knowledge management to strategic competence: Measuring technological, market and organizational innovation, 2006, London: Imperial College Press, pp. 77–93.
- 35. Burn, G., Quality function deployment. In Dale, B. and J. Plunkett, eds., Managing quality, 1990, London: Philip Allan, pp. 66–88.
- 36. Dimancescu, D. and K. Dwenger, World-class new product development. 1995, New York: American Management Association.
- 37. Griffin, A., Evaluating QFD’s use in US firms as a process for developing products. Journal of Product Innovation Management, 1992. 9, 171–87.
- 38. Buzzell, P. and B. Gale, The PIMS principle, 1987. New York: Free Press.
- 39. Moriarty, P. and D. Reibstein, Benefit segmentation in industrial markets. Journal of Business Research, 1986. 14, 463–86.
- 40. Lauglaug, A., Technical-market research – Get customers to collaborate in developing products. Long Range Planning, 1993. 26(2), 78–82.
- 41. Christensen, C., The innovator’s dilemma, 2000. New York: HarperCollins.
- 42. Jones, N., Competing after radical technological change: The significance of product line management strategy. Strategic Management Journal, 2003. 24, 1265–87; see also, Green, K. and R. Raman, Innovation hit rate, product advantage, innovativeness, and firm performance. International Journal of Innovation Management, 2014. 18(5), 1450038.
- 43. Davidow, W., Marketing high technology, 1986. New York: Free Press.
- 44. Millier, P., The marketing of high-tech products: Methods of analysis, 1989. Paris: Editions d’Organisation (in French).
- 45. Hyysalo, S., et al., Intermediate search elements and method combination in lead-user searches. International Journal of Innovation Management, 2015. 19(1), 1550007; Henttonen, K. and P. Ritala, Search far and deep: Focus of open search strategy as driver of firm’s innovation performance. International Journal of Innovation Management, 2013. 17(3), 1340007; Weiss, A. and J. Heide, The nature of organizational search in high technology markets. Journal of Marketing Research, 1993. 30, 220–33.
- 46. Hobday, M., H. Rush, and J. Tidd, Complex product systems. Research Policy, 2000. 29, 793–804.
- 47. Wilson, L., A. Weiss, and G. John, Unbundling of industrial systems. Journal of Marketing, 1990. 27, 123–38.
- 48. Kleinknecht, A. and G. van der Panne, Predicting new product sales: The post-launch performance of 215 innovators. International Journal of Innovation, 2012. 16(2), 1250011; Cooper, R. and E. Kleinschmidt, Screening new products for potential winners. Long Range Planning, 1993. 26(6), 74–81.
- 49. Hamel, G. and C. Prahalad, Competing for the future. 1994, Boston, MA: Harvard Business School Press.
- 50. Brem, A. and J. Tidd, Perspectives on supplier innovation. 2012, London: Imperial College Press; More, P., Developer/adopter relationships in new industrial product situations. Journal of Business Research, 1986. 14, 501–17.
- 51. Leonard-Barton, D. and D. Sinha, Developer–user interaction and user satisfaction in internal technology transfer. Academy of Management Journal, 1993. 36(5), 1125–39.
- 52. Hakansson, H., The Swedish approach to Europe. In D. Ford, ed., Understanding business markets. 1995, London: The Dryden Press, pp. 232–61.
- 53. Webster, F. Jr., Industrial marketing strategy, 3rd ed. 1995, New York: John Wiley & Sons, Inc.
- 54. Diego, A., C. Bravo-Ortega, and G. Crespi, Innovation in the services sector. Emerging Markets Finance and Trade, 2015. 51(3), 537−39; Crespi, G., C. Criscuolo, and J. Haskel, Information technology, organisational change and productivity growth: evidence from UK firms. The Future of Science, Technology and Innovation Policy: Linking Research and Practice, 2006, SPRU 40th Anniversary Conference, Brighton, UK.
- 55. Kindstrom, D., C. Kowalkowski, and E. Sandberg, Enabling service innovation: A dynamic capabilities approach. Journal of Business Research, 2013. 66(8), 1063−073; Ettlie, J. and S.R. Rosenthal, Service versus manufacturing Innovation. Journal of Product Innovation Management, 2011. 28(2), 285−99; Tidd, J. and F.M. Hull, Managing service innovation: The need for selectivity rather than ‘best-practice’. New Technology, Work and Employment, 2006. 21(2), 139–61; Service innovation: Organizational responses to technological opportunities and market imperatives. 2003, London: Imperial College Press; Berry, L.L., et al., Creating new markets through service innovation. MIT Sloan Management Review, 2006. 47, 2; Schmenner, R.W., How can service businesses survive and prosper? MIT Sloan Management Review, 1986. 27(3), 21–32.