
CHAPTER 13
Capturing the Business Value of Innovation

In the next two chapters, we examine how organizations, private and public, can better capture the benefits of innovation and minimize the risks of innovation. We begin with a discussion of the classic, but rather narrow, view of economists who identify some of the ways in which firms appropriate the benefits of innovation, in particular, through returns on product and process innovation. In the second section, we identify the relationships between different types of innovation and various forms of financial and market performance. Next, we broaden the scope to include the competitive advantages of exploiting knowledge, both tacit and more formal types, including intellectual property. In the following chapter, we review the more fundamental contributions innovation can make to economic and social change, focusing on the potential for economic development, improvement in social services, and greater sustainability.
13.1 Creating Value through Innovation
One of the central problems of managing innovation is how to create and capture value. For example, in Chapter 1 we discussed the recent transitions in the music industry and how changes in music is produced, distributed, consumed, and paid for (or not in many cases). Video content is facing a similar challenge to the dominant business model, and the producers, distributors, and users are experimenting with a range of new ways of generating an income to pay for the production and distribution of video content (see Case Study 13.1).
At the level of the firm, there is only a weak relationship between innovation and performance. As we saw in Chapter 4, technological leadership in firms does not necessarily translate itself into economic benefits. The capacity of the firm to appropriate the benefits of its investment in technology depends on its ability to translate its technological advantages into commercially viable products or processes, for example, through complementary assets or capabilities in marketing and distribution; and its capacity to defend its advantages against imitators, for example, through secrecy, standards, or intellectual property. Some of the factors that enable a firm to benefit commercially from its own technological lead can be strongly shaped by its management: for example, the provision of complementary assets to exploit the lead. Other factors can be influenced only slightly by the firm’s management and depend much more on the general nature of the technology, the product market and the regime of intellectual property rights (IPR): for example, the strength of patent protection. Research Note 13.1 identifies innovation management practices that contribute to value creation.
The early work on this was by economists who argued that under perfect market conditions there would be no incentive for individual entrepreneurs or firms to innovate, as ease of imitation would make it difficult to achieve returns from the risky investment in innovation [1]. Subsequently, the focus was on what conditions were optimal to encourage risk taking and innovation, but prevent monopoly positions emerging. For example, as we discussed in Chapter 4, David Teece argues that three groups of factors influence the ability of a firm to capture value from innovation: the appropriability regime, which includes the strength of formal IPR, nature of the knowledge (tacit vs. codified), secrecy, ease of imitation, and lead times; complementary assets, such as brand, position, distribution, support and services; and the dominant design [2].
However, simplistic arguments in favor of ever-stronger IPR, in particular patents and copyright, fail to understand the evidence of their limited effectiveness, both in terms of encouraging innovation and in creating and capturing value from innovation. For example, in the United States the number of patents granted to firms during the 1990s more than doubled, and the cases of legal enforcement of IPR more than tripled, resulting in legal expenditures equivalent to 25% of the R&D of the firms involved, but without any associated step-change in the levels of innovation or profitability [3].
There are a number of other empirical reasons to believe that IPR play only a minor role in the creation and capture of value from innovation. Firstly, the propensity to use, and more importantly to enforce, IPR varies by sector significantly. In some industries (and countries), the IPR regime is strong, such as pharmaceuticals, in other sectors much weaker, such as information and communications technologies (ICTs). However, these differences in the strength of IPR are not reflected in the rates of innovation or profitability across these sectors [4]. In each case, other aspects, such as sales and distribution, service and support, are much more important explanatory factors. Secondly, the high variation in innovation and performance within the same sectors and within similar IPR regimes indicates that other firm-level factors are also at work. For example, in services, differences in the external linkages with suppliers, consultants, customers, and other partners are associated with differences in innovation and growth [5].
In fact, an overreliance on using IPR for protection can limit the benefits derived from innovation. Firms need to balance the desire to protect their knowledge with the need to share aspects of this knowledge to promote innovation. This is particularly necessary for systemic innovations, which may demand externalities and complementary products and services to be successful or where potential network externalities exist. Network externalities arise when increases in the number of users results in reduced costs but greater benefits, like many Internet products and services (see Case Study 13.2, Skype). A degree of IPR is associated with network externalities. In such cases, IPR may indicate that there is knowledge in a codified form, which makes it easier to transfer or share within a network, and the security offered by the IPR can encourage collaboration and licensing [6].
By influencing the shape or architecture of an emerging innovation in this way, a firm can capture a small proportion of a potentially very large pie, rather than focusing on the protection of a much smaller pie. Where imitation is likely, investment in complementary assets can result in higher returns in the longer term [7]. In fact, the research indicates that use of IPR has a negative effect on a strategy of long-term value creation and that lead time, secrecy, and the tacitness of knowledge are more strongly associated with creating value [8]. Research Note 13.2 discusses the effects of using internal and external IPR to create value.
In summary, theoretical arguments and empirical research suggest that from both policy and management perspectives, only a limited level of IPR is desirable to encourage risk taking and innovation, and that a broader repertoire of strategies is necessary to create and capture the economic and social benefits of innovation.
13.2 Innovation and Firm Performance
There are several difficulties in constructing a model of the effects of innovation on the financial performance of the firm [9]. First, at the firm level, the relationship between inputs and outputs is much weaker than at the industry level. The weakness in the relationship may be caused simply by the random unpredictability of innovation. Any comparison must, therefore, be across homogeneous firms to control for relative opportunity, and in practice this may be difficult to arrange. Secondly, the reporting behavior of firms may change in respect of any variable that is monitored to be used in an index of innovation. This reflects the so-called Goodhart law phenomenon whereby monetary indicators devised by the government become subverted as behavior changes in response to measurement. Thirdly, an objective of the indicators may be to influence financial markets and lending behavior. However, these markets at present give a lot of attention to the management and efficiency of technological inputs, which are assessed almost entirely by track record. Furthermore, financial markets will concern themselves only with the gain appropriable by the firm itself.
In order to determine whether inputs (or outputs) measure anything of relevance, it is necessary to look for correlations between indicators, such as R&D expenditure, productivity growth, profitability, or the stock-market value of the firm. For example, there is quite a strong relationship between R&D and the number of patents at the cross-sectional level, across firms and industries. However, at the firm level, the relationship is much weaker over time. Econometric techniques can be used to assess the impact of innovation inputs, specifically the expenditure on R&D, and on some measure of performance, typically productivity or patents. Research shows that product R&D is significantly less productive than process R&D [10].
Other studies using the SPRU significant innovations database found that the impact of the use of innovation was around four times that of their generation [11,12]. The same study found that the productivity increases took 10–15 years to be fully effected. Using R&D as a proxy for inputs to the innovation process and patents as an indicator of outputs, at the national level, patents and R&D are correlated and, also, to some extent, at the sectoral level, but as Pavitt notes, the extent of unexplained variation is high at the level of cross-company analysis [13]. Part of the difficulty in obtaining stable relationships between patents and R&D lies in the fact that firms have different propensities to patent their discoveries. This partly reflects the ease of protecting the gains from innovation in other ways, such as secrecy and first-mover advantages. Furthermore, the effectiveness of patents varies across industries, for example, being strong in pharmaceuticals but weak in consumer electronics [14].
R&D statistics also display industry-specific bias with some sectors classifying their development work as design or production [15]. The fact that weaker relationships between outputs and inputs are observed at the firm level, rather than at the industry level, suggests that there is a lot of variability in the productivity of technological inputs and that there may be some point in studying the particular conditions under which the inputs are used most effectively.
The most likely explanatory factors are scale, technological opportunity, and management [16]. The evidence on scale is mixed. There are two linked hypotheses – that the size of the R&D effort counts and that the size of the firm makes R&D more effective, say, because of economies of scope between projects [17]. Studies suggest that the scale of R&D effort is important only in chemicals and pharmaceuticals [18]. Firm size is a more difficult issue to study because the interpretation of R&D and patents differ between class sizes of firms. One study compared over 600 manufacturing firms between 1972 and 1982 in the United Kingdom, matched to the SPRU database of significant technical innovations [19]. It suggests that large firms tend to innovate more because they have a higher incentive to do so: a doubling of market share from the mean of 2.5% will increase the probability of innovation in the next period by 0.6%. This result is qualified by noting that less competitive firms (higher concentration and lower import ratios) innovate less.
Technological opportunity at the industry level has been examined in the context of relative appropriability. Technological opportunity also exists at the firm level via the spillover effects from other firms. Such spillovers are not automatic and demand explicit attention to technology transfer and search for external sources of innovation, as advocated by us throughout this book. The classic study of the managerial efficiency of R&D inputs is the SPRU project SAPPHO, best summarized in Freeman, which found that commitment to the project by senior management and good communications are crucial to success [20].
A major problem with measuring inputs and outputs is how do we take account of the “spillover” of innovation benefits or information to other firms or industries? For example, if we are looking at a particular sector’s industrial output or productivity in relation to its R&D spending, how do we take account of spillover from other sectors or nonindustry R&D? [21]. The question really relates to the appropriate level of investigation – is it the company/or industry/or entire economy? Freeman discusses the question of spillover, arguing that the appropriate connection to make is not so much company R&D and productivity as industry R&D and productivity. For example, the whole electronics industry benefited from Bell’s work on semiconductors, and only a small part was recovered by Bell in the form of licensing or sales.
There may also be a different kind of spillover internal to the firm. Some products fail, but their R&D is still useful. For example, the large sums spent by IBM on the (failed) Stretch computer in the 1960s (only a few were sold) led to the successful 360 series. Spillover from innovations between closely related sectors is not as great as previous research has suggested with regard to R&D spending. Rather, there is spillover between producers and users [22]. This is presumably because the innovation itself is too firm-specific to show much spillover effect, whereas the information shared with R&D spillover is less firm-specific. Research Note 13.3 reviews the effect of technological novelty on value creation.
Although firms are increasingly drawing upon external sources of innovation, few have yet to systematically scan outside their own sector [23]. A particular form of spillover occurs when the economy, as a whole, benefits more from an innovation than is appropriated as profits. A difference, then, occurs between the private rate of return and the social rate of return, and in general the social benefits of innovation far exceed the private returns to individual firms [24].
The limitations of R&D and patents, as surrogates for innovation, have led to more recent studies turning to less robust but market-based measures, such as new product announcements and innovation counts. One study related the number of new chemical entities discovered in the US pharmaceutical industry to constant price R&D and other variables [18]. A nonlinear (convex) relationship with R&D was discovered and there was some indication that when R&D was interacted with sales in a large firm, it was more effective. Another study examined the strength of the relationship from patents to innovations in order to judge whether patents can be used as an innovation indicator. The results are striking in that at the four-digit industry level, there is a strong relationship. This disappears when the firm-level data is analyzed. Indeed, the best predictor of a firm innovation is the patent intensity of the industry it is in [25]. Subsequent studies have analyzed innovations announced in all major US publications, others have restricted the scope to leading financial publications such as the Wall Street Journal [26]. These studies indicate that innovation tends to be concentrated in larger firms, in less concentrated industries and is strongly affected by joint investment in advertising and R&D [27]. At the industry level, patent intensity and new product announcements are strongly related, with 60% of the variance in the new product sample being explained by patent intensity. However, at the firm level, the relationship is very weak, and only 2% of the variance of individual firm-level new product activity appears to be explained by patenting activity [25].
The ratio of R&D/value-added has been used as a proxy for innovation output in research. This is because identical R&D expenditures in different industries do not necessarily indicate identical innovation activity, and also R&D thresholds will be different for different industries, some being far more capital-intensive than others [28]. Similarly, an “innovation ratio” has been developed, based on the ratio of cash outlay to cash return, as well as the ratio of development time to market life of specific development projects. On this basis, it is possible to calculate an innovation ratio for specific sectors and companies. For example, the ratio for the UK mechanical engineering sectors is around 14%. As the value-added for that sector is some 50% of turnover, this suggests that at least 7% of revenue should be devoted to innovation in order to sustain intangible assets [29].
Analysis of the SPRU database of innovations and company accounts shows that the profit margin of innovators is higher than noninnovators, controlling for other influences, although the effect is rather small. The relationship between profitability and lagged indicators of capital input, marketing expenses, and R&D reveals that the rate of return to R&D is about 33%, with an average lag of about 5 years. Process innovation has four times the rate of return as product innovation, but is more risky with more variable returns [30].
The impact of R&D on the stock market is more difficult to judge as one needs a prior position on the efficiency or, otherwise, of financial markets before setting up a testable hypothesis. Some key studies find a significant (though noisy) effect [31]. For example, the relationship between patents and the market value of the firm is not significant, with the exception of the pharmaceutical industry [32]. In contrast, product announcements have a positive effect on the share price of the originating firm. The impact of the announcement on share price depends on two factors: first, an assessment of the probability of success of the new product; second, an evaluation of the level of future earnings from the product. The average value of each new product announcement was found to be $26 million (in 1972 dollars). Of course, the precise return and value of each product announcement depends on the industry sectors: the highest returns were found to be in food, printing, chemicals and pharmaceuticals, computers, photographic equipment, and durable goods. Excess returns due to new product announcements suggest that past and current accounting data have little predictive value.
The P/E (price/earnings) ratio may be a better indicator of (future) innovation performance. The average P/E ratio of the firms making new product announcements is almost twice that of the firms that make no new product announcements. This implies that the stock market is valuing the long-term stream of future earnings generated by the innovative firms at a much higher rate than the noninnovators. However, profitability declines as the market evolves: the real rate of market growth is associated with profitability. At the extremes, a real annual rate of growth of 10% or more has a ROI four points higher than markets declining at rates of 5% or more. High rates of market growth are associated with the following [33]:
- High gross margins
- High marketing costs
- Rising productivity
- Increasing value-added per employee
- Increasing investment
- Low or negative cash flow
Market differentiation measures the degree to which all competitors differ from one another across a market. Markets in which there is little differentiation and no significant difference in the relative quality of competitors are characterized by low returns. High relative quality is a strong predictor of high profitability in any market conditions. Nevertheless, a niche business may achieve high returns in a market with high differentiation without high relative quality. A combination of both high market differentiation and high perceived relative quality yields very high ROI, typically in excess of 30%. The importance of market share varies with industry. Intuition would suggest that share would be most important in capital-intensive manufacturing and production industries, where economies of scale are required. However, the PIMS (profit impact of market share) database suggests that market share has a much stronger impact on profitability in innovative sectors, that is, those industries characterized by high R&D and/or marketing expenditure. This suggests that scale effects are more important in R&D and marketing than in manufacturing.
Our own study of the relationship between innovation and performance examined 40 companies, representing five different sectors [9]. We chose companies to provide a range of R&D intensity in each of the five sectors. Analysis of the data confirms that expenditure on R&D, as a proportion of sales, has a significant positive effect on value-added, but also the number of new product announcements made. This suggests that R&D contributes both to increasing the number of new products introduced and their value. The results suggest that the financial markets undervalue expenditure on R&D, but do value R&D efficiency. If we use the ratio of new products introduced/absolute R&D as a proxy for research efficiency, we find that the efficiency of research also has a significant positive effect on the market-to-book value.
13.3 Exploiting Knowledge and Intellectual Property
In this section, we discuss how individuals and organizations identify “what they know” and how best to exploit this. We examine the related fields of knowledge management, organizational learning, and intellectual property. Key issues include the nature of knowledge, for example, explicit versus tacit knowledge; the locus of knowledge, for example, individual versus organizational; and the distribution of knowledge across an organization. More narrowly, knowledge management is concerned with identifying, translating, sharing, and exploiting the knowledge within an organization. One of the key issues is the relationship between individual and organizational learning and how the former is translated into the latter, and ultimately into new processes, products, and businesses. Finally, we review different types of formal intellectual property and how these can be used in the development and commercialization of innovations.
In essence, managing knowledge involves five critical tasks:
- Generating and acquiring new knowledge
- Identifying and codifying existing knowledge
- Storing and retrieving knowledge
- Sharing and distributing knowledge across the organization
- Exploiting and embedding knowledge in processes, products, and services
Generating and Acquiring Knowledge
Organizations can acquire knowledge by experience, experimentation, or acquisition. Of these, learning from experience appears to be the least effective. In practice, organizations do not easily translate experience into knowledge. Moreover, learning may be unintentional or it may not result in improved effectiveness. Organizations can incorrectly learn, and they can learn that which is incorrect or harmful, such as learning faulty or irrelevant skills or self-destructive habits. This can lead an organization to accumulate experience of an inferior technique and may prevent it from gaining sufficient experience of a superior procedure to make it rewarding to use, sometimes called the “competency trap.”
Experimentation is a more systematic approach to learning. It is a central feature of formal R&D activities, market research, and some organizational alliances and networks. When undertaken with intent, a strategy of learning through incremental trial and error acknowledges the complexities of existing technologies and markets, as well as the uncertainties associated with technology and market change and in forecasting the future. The use of alliances for learning is less common and requires an intent to use them as an opportunity for learning, a receptivity to external know-how and partners of sufficient transparency. Whether the acquisition of know-how results in organizational learning depends on the rationale for the acquisition and the process of acquisition and transfer. For example, the cumulative effect of outsourcing various technologies on the basis of comparative transaction costs may limit future technological options and reduce competitiveness in the long term.
A more active approach to the acquisition of knowledge involves scanning the internal and external environments. As we discussed in Chapter 6, scanning consists of searching, filtering, and evaluating potential opportunities from outside the organization, including related and emerging technologies, new market and services, which can be exploited by applying or combining with existing competencies. Opportunity recognition, which is a precursor to entrepreneurial behavior, is often associated with a flash of genius, but in practice, is probably more often the end result of a laborious process of environmental scanning. External scanning can be conducted at various levels. It can be an operational initiative with market- or technology-focused managers becoming more conscious of new developments within their own environments or a top-driven initiative where venture managers or professional capital firms are used to monitor and invest in potential opportunities.
Identifying and Codifying Knowledge
It is useful to begin with a clearer idea of what we mean by “knowledge.” It has become all things to all people, ranging from corporate IT systems to the skills and experience of individuals. There is no universally accepted typology, but the following hierarchy is helpful:
- Data are a set of discrete raw observations, numbers, words, records, and so on. Typically, they are easy to structure, record, store, and manipulate electronically.
- Information is data that has been organized, grouped, or categorized into some pattern. The organization may consist of categorization, calculation, or synthesis. This organization of data endows information with relevance and purpose and, in most cases, adds value to data.
- Knowledge is information that has been contextualized, given meaning, and therefore made relevant and easier to operationalize. The transformation of information into knowledge involves making comparisons and contrasts, identifying relationships, and inferring consequences. Therefore, knowledge is deeper and richer than information and includes framed expertise, experience, values, and insights (see Research Note 13.4).
There are essentially two different types of knowledge, each with different characteristics:
- Explicit knowledge, which can be codified, that is, expressed in numerical, textual, or graphical terms and therefore is more easily communicated, for example, the design of a product.
- Tacit or implicit knowledge, which is personal, experiential, context-specific, and hard to formalize and communicate, for example, how to ride a bicycle.
Note that the distinction between explicit and tacit is not necessarily the result of the difficulty or complexity of the knowledge, but rather how easy it is to express that knowledge. Blackler develops a finer typology of knowledge, which identifies five types [34]:
- Embrained knowledge depends on conceptual skills and cognitive abilities and emphasizes the value of abstract knowledge.
- Embodied knowledge is action oriented but likely to be only partly explicit, for example, problem-solving ability and learning by doing, and is highly context-specific.
- Encultured knowledge is the process of achieving shared understanding and meaning. It is socially constructed and open to negotiation and involves socialization and acculturation.
- Embedded knowledge resides in systematic routines and processes. It includes resources and relationships between roles, procedures, and technologies and is related to the notion of organizational capabilities or competencies.
- Encoded knowledge is represented by symbols and signs and includes designs, blueprints, manuals, and electronic media.
It is useful to distinguish between learning “how” and learning “why.” Learning “how” involves improving or transferring existing skills, whereas learning “why” aims to understand the underlying logic or causal factors with a view to applying the knowledge in new contexts.
Much of the research on innovation management and organizational change has failed to address the issue of organizational learning. Instead, it has focused on learning by individuals within organizations: “… it is important to recognize that organizations do not learn, but rather the people in them do” [35]; “an organization learns in only two ways: (i) by the learning of its members; or (ii) by ingesting new members …” [36].
Clearly, individuals do learn within the context of organizations. This context affects their learning, which, in turn, may affect the performance of the organization. However, individuals and organizations are very different entities, and there is no reason why organizational learning should be conceptually or empirically the same as learning by individuals or individuals learning within organizations. Existing theory and research on organizational learning has been dominated by a weak metaphor of human learning and cognitive development, but such simplistic and inappropriate anthropomorphizing of organizational characteristics has contributed to confused research and misleading conclusions.
Using the dimensions of individual versus collective knowledge, and routine versus novel tasks, it is possible to identify four organizational configurations, as shown in Figure 13.1. This framework is useful because rather than advocate a simplistic universal trend toward “knowledge workers,” it allows different types of knowledge to be mapped onto different organizational and task requirements.
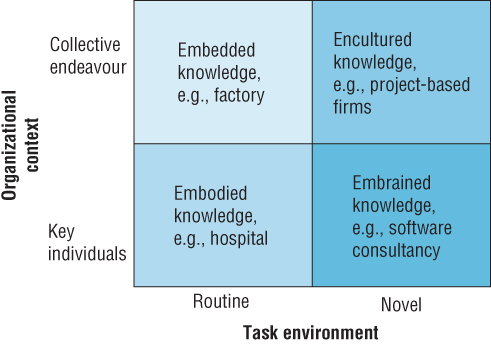
FIGURE 13.1 Task, organizational context, and knowledge types.
Source: Blackler, F. Knowledge, knowledge work and organizations: An overview and interpretation. Organization Studies, 1995, 16(60), 1021–46. Copyright SAGE Publications.
For example, this framework suggests that under conditions of environmental uncertainty embrained and encultured knowledge are more relevant than embedded or embodied knowledge. The choice between the two approaches will depend on the organizational culture and context. We might expect a small, entrepreneurial firm to rely more on embrained knowledge and a large established firm on encultured knowledge.
As we have seen, knowledge can be embodied in people, organizational culture, routines and tools, technologies, processes, and systems. Organizations consist of a variety of individuals, groups, and functions with different cultures, goals, and frames of reference. Knowledge management consists of identifying and sharing knowledge across these disparate entities. There is a range of integrating mechanisms that can help to do this. Nonaka and Takeuchi argue that the conversion of tacit to explicit knowledge is a critical mechanism underlying the link between individual and organizational knowledge. They argue that all new knowledge originates with an individual, but that through a process of dialogue, discussion, experience sharing, and observation, such knowledge is amplified at the group and organizational levels. This creates an expanding community of interaction, or knowledge network, which crosses intra- and interorganizational levels and boundaries. Such knowledge networks are a means to accumulate knowledge from outside the organization, share it widely within the organization, and store it for future use.
This transformation of individual knowledge into organizational knowledge involves four cycles [37]:
- Socialization Tacit to tacit knowledge, in which the knowledge of an individual or group is shared with others. Culture, socialization, and communities of practice are critical for this.
- Externalization Tacit to explicit knowledge, through which the knowledge is made explicit and codified in some persistent form. This is the most novel aspect of Nonaka’s model. He argues that tacit knowledge can be transformed into explicit knowledge through a process of conceptualization and crystallization. Boundary objects are critical here.
- Combination Explicit to explicit knowledge, where different sources of explicit knowledge are pooled and exchanged. The role of organizational processes and technological systems is central to this.
- Internalization Explicit to tacit knowledge, whereby other individuals or groups learn through practice. This is the traditional domain of organizational learning.
Max Boisot has developed the similar concept of C-space (culture space) to analyze the flow of knowledge within and between organizations. It consists of two dimensions: codification, the extent to which information can be easily expressed, and diffusion, the extent to which information is shared by a given population. Using this framework, he proposes a social learning cycle, which involves four stages: scanning, problem-solving, diffusion, and adsorption, as shown in Figure 13.2 [38].
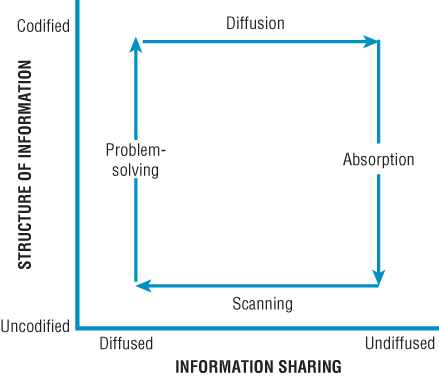
FIGURE 13.2 A model of knowledge structuring and sharing.
Source: Boisot, M. and D. Griffiths, Are there any competencies out there? Identifying and using technical competencies. In Tidd, J., ed., From knowledge management to strategic competence, 2nd ed. (pp. 249–307). 2006, Imperial College Press: London. Copyright Imperial College Press/World Scientific Publishing Co.
C-space (culture space) is a useful conceptual framework for this analysis. It focuses on structuring and flow of knowledge within and between organizations. It consists of two dimensions: codification and diffusion. Codifying knowledge involves taking information that human agents carry in their heads and find hard to articulate and structuring it in such a way that its complexity is reduced (Research Note 13.2). This enables it to be incorporated into physical objects or described on paper. Once this has occurred, it will develop a life of its own and can diffuse quite rapidly and extensively. Knowledge moves around the C-space in a cyclical fashion as shown in Case Study 13.3.
Storing and Retrieving Knowledge
Storing knowledge is not a trivial problem, even now that the electronic storage and distribution of data is cheap and easy. The biggest hurdle is the codification of tacit knowledge. The other common problem is to provide incentives to contribute, retrieve, and reuse relevant knowledge. Many organizations have developed excellent knowledge intranet systems, but these are often underutilized in practice (see Case Study 13.4).
In practice, there are two common but distinct approaches to knowledge management. The first is based on investments in IT, usually based on groupware and intranet technologies. These are the favored approach of many management consultants. But introducing knowledge management into an organization consists of much more than technology and training. It can require fundamental changes to organizational structure, processes, and culture. The second approach is more people and process based and attempts to encourage staff to identify, store, share, and use information throughout the organization. Research suggests that, as in previous cases of process innovation, the benefits of the technology are not fully realized unless the organizational aspects are first dealt with [39].
Therefore, the storage, retrieval, and reuse of knowledge demands much more than good IT systems. It also requires incentives to contribute to and use knowledge from such systems, whereas many organizations instead encourage and promote the generation and use of new knowledge.
Richard Hall goes some way toward identifying the components of organizational memory. His main purpose is to articulate intangible resources, and he distinguishes between intangible assets and intangible competencies. His empirical work, based on a survey and case studies, indicates that managers believe that the most significant of these intangible resources are the company’s reputation and employees’ know-how, both of which may be a function of organizational culture. Assets include IPR and reputation. Competencies include the skills and know-how of employees, suppliers, and distributors, as well as the collective attributes, which constitute organizational culture. These include the following [40]:
- Intangible, off-balance sheet, assets, such as patents, licenses, trademarks, contracts, and protectable data.
- Positional, which are the result of previous endeavor, that is, with a high path dependency, such as processes and operating systems, and individual and corporate reputation and networks.
- Functional, which are either individual skills and know-how or team skills and know-how, within the company, at the suppliers or distributors.
- Cultural, including traditions of quality, customer service, human resources or innovation.
The key questions in each case are as follows:
- Are we making the best use of this resource?
- How else could it be used?
- Is the scope for synergy identified and exploited?
- Are we aware of the key linkages that exist between the resources?
13.4 Sharing and Distributing Knowledge
In practice, large organizations often do not know what they know. Many organizations now have databases and groupware to help store, retrieve, and share data and information, but such systems are often confined to “hard” data and information, rather than more tacit knowledge. As a result, functional groups or business units with potentially synergistic information may not be aware of where such information could be applied.
Knowledge sharing and distribution is the process by which information from different sources is shared and, therefore, leads to new knowledge or understanding. Greater organizational learning occurs when more of an organization’s components obtain new knowledge and recognize it as being of potential use. Tacit knowledge is not easily imitated by competitors because it is not fully encoded, but for the same reasons it may not be fully visible to all members of an organization. As a result, organizational units with potentially synergistic information may not be aware of where such information could be applied. The speed and extent to which knowledge is shared between members of an organization are likely to be a function of how codified the knowledge is.
There are many permutations of the processes required for converting and connecting knowledge from different parts of an organization [41]:
- Converting data and information to knowledge – for example, identifying patterns and associations in databases
- Converting text to knowledge – through synthesis, comparison, and analysis
- Converting individual to group knowledge – sharing knowledge requires a supportive culture, appropriate incentives and technologies
- Connecting people to knowledge – for example, through seminars, workshops, or software agents
- Connecting knowledge to people – pushing relevant information and knowledge through intranets, agent systems
- Connecting people to people – creating expert and interest directories and networks, mapping who knows what and who knows who
- Connecting knowledge to knowledge – identifying and encouraging the interaction of different knowledge domains, for example, through common projects
This process of conversion and connection is underpinned by communities of practice. A community of practice is a group of people related by a shared task, process, or the need to solve a problem, rather than by formal structural or functional relationships [42]. Through practice, a group within which knowledge is shared becomes a community of practice through a common understanding of what it does, how to do it, and how it relates to other communities of practice.
Within communities of practice, people share tacit knowledge and learn through experimentation. Therefore, the formation and maintenance of such communities represents an important link between individual and organizational learning. These communities naturally emerge around local work practice and so tend to reinforce functional or professional silos, but also can extend to wider, dispersed networks of similar practitioners.
The existence of communities of practice facilitates the sharing of knowledge within a community, due to both the sense of collective identity and the existence of a significant common knowledge base. However, the sharing of knowledge between communities is much more problematic due to the lack of both these elements. Thus, the dynamics of knowledge sharing within and between communities of practice are likely to be very different, with the sharing of knowledge between communities typically being much more complex, difficult, and problematic.
Many factors can prevent the sharing of knowledge between communities of practice, such as the distinctiveness of different knowledge bases and lack of common knowledge, goals, assumptions, and interpretative frameworks. These differences significantly increase the difficulty not just of sharing knowledge between communities but appreciating the knowledge of another community.
However, there are some proven mechanisms to help knowledge transfer between different communities of practice [43]:
- An organizational translator, who is an individual able to express the interests of one community in terms of another community’s perspective. Therefore, the translator must be sufficiently conversant with both knowledge domains and trusted by both communities. Examples of translators include the “heavyweight product manager” in new product development, who bridges different technical groups and technical and marketing groups.
- A knowledge broker, who differs from a translator in that they participate in different communities rather than simply mediate between them. They represent overlaps between communities and are typically people loosely linked to several communities through weak ties, and so are able to facilitate knowledge flows between different communities [44]. An example might be a quality manager responsible for the quality of a process that crosses several different functional groups.
- A boundary object or practice, which is something of interest to two or more communities of practice. Different communities of practice will have a stake in it, but from different perspectives. A boundary object might be a shared document, for example, a quality manual; an artifact, for example, a prototype; a technology, for example, a database; or a practice, for example, a product design. A boundary object provides an opportunity for discussion, debate (and conflict) and, therefore, can encourage communication between different communities of practice.
For example, formally appointed “knowledge brokers” can be used to systematically scavenge the organization for old or unused ideas, to pass these around the organization and imagine their application in different contexts. For example, Hewlett-Packard created a SpaM group to help identify and share good practice among its 150 business divisions. Before the new group was formed, divisions were unlikely to share information because they often competed for resources and were measured against each other. Similarly, Skandia, a Swedish insurance company active in overseas markets, attempts to identify, encourage, and measure its intellectual capital and has appointed a “knowledge manager” who is responsible for this. The company has developed a set of indicators that it uses both to manage knowledge internally and for external financial reporting.
More generally, cross-functional team working can help to promote this intercommunal exchange. Functional diversity tends to extend the range of knowledge available and increase the number of options considered, but also can have a negative effect on group cohesiveness and the cost of projects and efficiency of decision-making. However, a major benefit of cross-functional team working is the access it provides to the bodies of knowledge that are external to the team. In general, a high frequency of knowledge sharing outside of a group is associated with improved technical and project performance, as gatekeeper individuals pick up and import vital signals and knowledge. In particular, cross-functional composition in teams is argued to permit access to disciplinary knowledge outside. Therefore, cross-functional team working is a critical way of promoting the exchange of knowledge and practice across disciplines and communities.
One useful way of understanding the advantages and disadvantages of different ways of implementing knowledge management is to identify five different strategies for introducing knowledge management to an organization (see Table 13.1) [45]:
- Ripple
- Flow
- Embedding
- Bridge
- Transfer
TABLE 13.1 Knowledge Management Implementation Strategies
Source: Adapted from Friso den Hertog, J. and E. Huizenga. The knowledge enterprise. 2014, second edition. Imperial College Press: London.
| Strategy | Characteristics | Requirements | Risks |
| Ripple | Bottom-up, continuous improvement, e.g., quality management | Process tools, sustained motivation | Isolation from technical excellence |
| Integration | Integration of functional knowledge within processes, e.g., product development | Improved interfaces, early involvement, overlapping phases | Conformity, coordination burden |
| Embedding | Coupling of systems, products and services, e.g., enterprise resource planning (ERP) | Common information systems and technology, motivation and rewards | Loss of autonomy, system complexity |
| Bridge | New knowledge by novel combination of existing competencies, e.g., architectural innovations | Common language and objectives | High control needs, technical feasibility, market failure |
| Transfer | Exploiting existing knowledge in a new context, e.g., related diversification | New market knowledge | Inappropriate technology, customer support and service |
The ripple approach is the most basic and consists of a knowledge center or core of one specific discipline, technology, or skill, which is developed incrementally over time. An example might be quality management, or the experience curve in mass production, or robust designs. The impact over time can be great, but the danger is that the knowledge will become detached from market needs and technological opportunities.
The flow approach involves projects being handed from one knowledge center to another, often sequentially. This is similar to the traditional new product or service development process, and one of the biggest problems is managing the interfaces and integration between the knowledge centers, for example, the design, production, and marketing functions.
The embedding approach brings different knowledge centers into a broader framework, without any major changes to the centers. An example would be the electronic data interchange (EDI) between a supplier and retailer to reduce stocks and improve responsiveness. Potential problems include asymmetric cost and benefits between the centers, and fear of control or leakage of information.
The bridge approach merges two or more different knowledge centers to create a whole new knowledge domain. This may be a merger of disciplines, for example, mechanical and electrical engineering to form mechatronics, which is sometimes referred to as technology fusion, or may involve the combination of two organizations in a joint venture or merger. This is a very risky strategy, as such bridges typically have significant technological, organizational, and commercial uncertainties, but when successful can result in radically new knowledge and high rewards.
The transfer approach is more selective and consists of taking a useful element of one knowledge domain and adapting it for use in another. The knowledge transferred might be technology, market knowledge, or organizational know-how or processes. Process benchmarking is an example of a knowledge transfer strategy.
This framework is useful because it helps us to understand better the needs and limits of different approaches to knowledge management, beyond the usual, but often unsuccessful “technology and training” approach.
Converting Knowledge into Innovation
Innovation rarely results from a single knowledge input, such a new technology, but instead the challenge is how best to combine multiple and diverse types of knowledge into a configuration. Successful innovation management requires that we can get hold of and use knowledge about components but also about how those can be put together – what they termed the architecture of an innovation (see Chapter 1). For example, change at the component level in building a flying machine might involve switching to newer metallurgy or composite materials for the wing construction or the use of fly-by-wire controls instead of control lines or hydraulics. But the underlying knowledge about how to link aerofoil shapes, control systems, propulsion systems, etc. at the system level is unchanged – and being successful at both requires a different and higher order set of competencies.
One of the difficulties with this is that innovation knowledge flows – and the structures which evolve to support them – tend to reflect the nature of the innovation. So, if it is at component level then the relevant people with skills and knowledge around these components will talk to each other – and when change takes place they can integrate new knowledge. But when change takes place at the higher system level – “architectural innovation” – then the existing channels and flows may not be appropriate or sufficient to support the innovation and the firm needs to develop new ones. This is another reason why existing incumbents often fare badly when major system-level changes take place – because they have the twin difficulties of learning and configuring a new knowledge system and “unlearning” an old and established one.
A variation on this theme comes in the field of “technology fusion,” where different technological streams converge, such that products that used to have a discrete identity begin to merge into new architectures. An example here is the home automation industry, where the fusion of technologies like computing, telecommunications, industrial control, and elementary robotics is enabling a new generation of housing systems with integrated entertainment, environmental control (heating, air conditioning, lighting, etc.), and communication possibilities.
Similarly, in services a new addition to the range of financial services may represent a component product innovation, but its impacts are likely to be less far-reaching (and the attendant risks of its introduction lower) than a complete shift in the nature of the service package – for example, the shift to direct-line systems instead of offering financial services through intermediaries.
David Tranfield and his colleagues map the different phases of the innovation process to identify the knowledge routines in each of three innovation phases – discovery, realization, and nurture (see Figure 13.3 and Table 13.2) [46]:
- Discovery – scanning and searching the internal and external environments, to pick up and process signals about potential innovation. These could be needs of various kinds, opportunities arising from research activities, regulative pressures, or the behavior of competitors.
- Realization – how the organization can successfully implement the innovation, growing it from an idea through various stages of development to final launch as a new product or service in the external market place or a new process or method within the organization. Realization requires selecting from this set of potential triggers for innovation, those activities to which the organization will commit resources.
- Nurturing the chosen option by providing resources, developing (either by creating through R&D or acquiring through technology transfer) the means for exploration. It involves not only codified knowledge formally embodied in technology but also tacit knowledge in the surrounding social linkage, which is needed to make the innovation work. The nurture phase involves maintaining and supporting the innovation through various improvements and also reflecting upon previous phases and reviewing experiences of success and failure in order to learn about how to manage the process better and capture relevant knowledge from the experience. This learning creates the conditions for beginning the cycle again, or “reinnovation.”
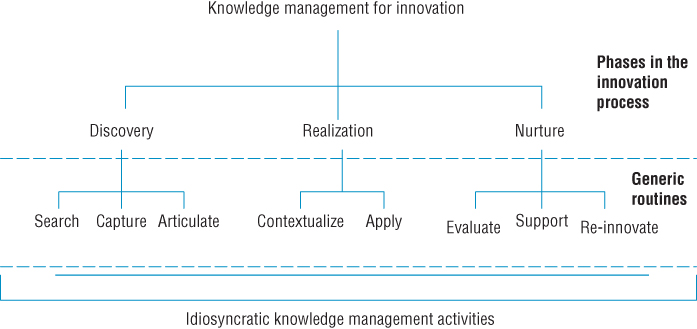
FIGURE 13.3 Process model of knowledge management for innovation.
Source: Tranfield, D., M. Young, D. Partington, J. Bessant, and J. Sapsed, Knowledge management routines for innovation projects: Developing a hierarchical process model. In Tidd, J., ed., From Knowledge Management to Strategic Competence, Third Edition (pp. 126–149). 2012, Copyright Imperial College Press/ World Scientific Publishing Co.
TABLE 13.2 Process Model Linking Innovation Phase to Knowledge Management Activities
Source: Tranfield, D., M. Young, D. Partington, J. Bessant, and J. Sapsed, Knowledge management routines for innovation projects: Developing a hierarchical process model. In Tidd, J., ed., From Knowledge Management to Strategic Competence, third edition (pp. 126–149). 2012, Imperial College Press: London. Reproduced with permission.
| Phase in the Innovation Process | Generic Routines | Description | Examples of Detailed Knowledge Management Activities |
| Discovery | Search | The passive and active means by which potential knowledge sources are scanned for items of interest |
Active environmental scanning (technological, market, social, political, etc.) Active future scanning Experiment – R&D, etc. |
| Capture | The means by which knowledge search outcomes are internalized within the organization | Picking up relevant signals and communicating them within and across the organization to relevant players | |
| Articulate | The means by which captured knowledge is given clear expression |
Concept definition – what might we do? Strategic and operational planning cycles – from outline feasibility to detail operational plan | |
| Realization | Contextualize | The means by which articulated knowledge is placed in particular organizational contexts |
Resource planning and procurement – inside and outside the organization Prototyping and other concept refining activities Early mobilization across functions – design for manufacture, assembly, quality, etc. |
| Apply | The means by which contextualized knowledge is applied to organizational challenges |
Project team mobilization Project planning cycles Project implementation and modification – “cycles of mutual adaptation” in technological, market, organizational domains Launch preparation and execution | |
| Nurture | Evaluate | The means by which the efficacy of knowledge applications is assessed |
Postproject review Market/user feedback Learning by using/making/ etc. |
| Support | The means by which knowledge applications are sustained over time |
Feedback collection Incremental problem-solving and debugging | |
| Reinnovate | The means by which knowledge and experience are reapplied elsewhere within the organization |
Pick up relevant signals to repeat the cycle Mobilize momentum for new cycle |
13.5 Exploiting Intellectual Property
In some cases, knowledge, in particular in its more explicit or codified forms, can be commercialized by licensing or selling the IPR, rather than the more difficult and uncertain route of developing new processes, products, or businesses.
For example, in 1 year IBM reported license income of US$1 billion, and in the United States the total royalty income of industry from licensing is around US$100 billion. Much of this is from payments for licenses to use software, music, or films. For example, in 2005 the global sales of legal music downloads exceeded US$1 billion (although illegal downloads are estimated to be worth three to four times this figure), still only around 5% all music company revenue, with music downloaded to mobile phones accounting for almost a quarter of this. Patterns of use vary by country, for example, in Japan 99.8% of all music downloads are to mobile phones, rather than to dedicated MP3 players. However, despite the growth of legal sites for downloading music and an aggressive program of pursuing users of illegal file-sharing sites, the level of illegal downloads has not declined.
This clearly demonstrates two of the many problems associated with intellectual property: these may provide some legal rights, but such rights are useless unless they can be effectively enforced; and once in the public domain, imitation or illegal use is very likely. For these reasons, secrecy is often a more effective alternative to seeking IPR. However, IPR can be highly effective in some circumstances, and as we will argue later, can be used in less obvious ways to help to identify innovations and assess competitors. A range of IPR exists, but those most applicable to technology and innovation are patents, copyright and design rights, and registration.
Patents
All developed countries have some form of patent legislation, the aim of which is to encourage innovation by allowing a limited monopoly, usually for 20 years, and more recently many developing and emerging economies have been encouraged to sign up to the TRIPS (Trade Related Intellectual Property System). Legal regimes differ in the detail, but in most countries the issue of a patent requires certain legal tests to be satisfied:
- Novelty – no part of “prior art,” including publications, written, oral, or anticipation. In most countries, the first to file the patent is granted the rights, but in the United States it is the first to invent. The US approach may have the moral advantage, but results in many legal challenges to patents and requires detailed documentation during R&D.
- Inventive step – “not obvious to a person skilled in the art.” This is a relative test, as the assumed level of skill is higher in some fields than others. For example, Genentech was granted a patent for the plasminogen activator t-PA, which helps to reduce blood clots, but despite its novelty, a Court of Appeal revoked the patent on the grounds that it did not represent an inventive step because its development was deemed to be obvious to researchers in field.
- Industrial application – utility test requires the invention to be capable of being applied to a machine, product, or process. In practice, a patent must specify an application for the technology, and additional patents sought for any additional application. For example, Unilever developed Ceramides and patented their use in a wide range of applications. However, it did not apply for a patent for application of the technology to shampoos, which was subsequently granted to a competitor.
- Patentable subject – for example, discoveries and formula cannot be patented, and in Europe neither can software (the subject of copyright) or new organisms, although both these are patentable in the United States. For example, contrast the mapping of the human genome in the United States and Europe: in the United States, the research is being conducted by a commercial laboratory that is patenting the outcomes, and in Europe by a group of public laboratories that are publishing the outcomes on the Internet.
- Clear and complete disclosure – note that a patent provides only certain legal property rights, and in the case of infringement the patent holder needs to take the appropriate legal action. In some cases, secrecy may be a preferable strategy. Conversely, national patent databases represent a large and detailed reservoir of technological innovations, which can be interrogated for ideas.
Apart from the more obvious use of patents as IPR, they can be used to search for potential innovations and to help identify potential partners or to assess competitors.
Patents can also be used to identify and assess innovation, at the firm, sector, or national level. However, great care needs to be taken when making such assessments, because patents are only a partial indicator of innovation.
The main advantages of patent data are that they reflect the corporate capacity to generate innovation, are available at a detailed level of technology over long periods of time, are comprehensive in the sense that they cover small as well as large firms, and are used by practitioners themselves. However, patenting tends to occur early in the development process, and therefore can be a poor measure of the output of development activities, and tells us nothing about the economic or commercial potential of the innovation.
Crude counts of the number of patents filed by a firm, sector, or country reveal little, but the quality of patents can be assessed by a count of how often a given patent is cited in later patents. This provides a good indicator of its technical quality, albeit after the event, although not necessarily commercial potential. Highly cited patents are generally of much greater importance than patents that are never cited or are cited only a few times. The reason for this is that a patent that contains an important new invention, or major advance, can set off a stream of follow-on inventions, all of which may cite the original, important invention upon which they are building.
Using such patent citations, the quality distribution of patents tends to be very skewed: there are large numbers of patents that are cited only a few times, and only a small number of patents cited more than 10 times. For example, half of patents are cited two or fewer times, 75% are cited five or fewer times, and only 1% of the patents are cited 24 or more times. Overall, after 10 or more years, the average cites per patent is around six [47].
The most useful indicators of innovation based on patents are as follows (Table 13.3):
- Number of patents Indicates the level of technology activity, but crude patent counts reflect little more than the propensity to patent of a firm, sector, or country.
- Cites per patent Indicates the impact of a company’s patents.
- Current impact index (CII) This is a fundamental indicator of patent portfolio quality, it is the number of times the company’s previous 5 years of patents, in a technology area, were cited from the current year, divided by the average citations received.
- Technology strength (TS) Indicates the strength of the patent portfolio and is the number of patents multiplied by the current impact index, that is, patent portfolio size inflated or deflated by patent quality.
- Technology cycle time (TCT) Indicates the speed of invention and is the median age, in years, of the patent references cited on the front page of the patent.
- Science linkage (SL) Indicates how leading edge the technology is, and is the average number of science papers referenced on the front page of the patent.
- Science strength (SS) Indicates how much the patent applies basic science, and is the number of patents multiplied by science linkage, that is, patent portfolio size inflated or deflated by the extent of science linkage.
TABLE 13.3 Patent Indicators for Different Sectors
Source: Narin, F., Assessing technological competencies. In Tidd, J., ed., From knowledge management to strategic competence, 3rd ed. (pp. 179–219). 2012, Imperial College Press: London.
| Current Impact Index (Expected Value 1.0) | Technology Life Cycle (Years) | Science Linkage (Science References/Patents) | |
| Oil and gas | 0.84 | 11.9 | 0.8 |
| Chemicals | 0.79 | 9.0 | 2.7 |
| Pharmaceuticals | 0.79 | 8.1 | 7.3 |
| Biotechnology | 0.68 | 7.7 | 14.4 |
| Medical equipment | 2.38 | 8.3 | 1.1 |
| Computers | 1.88 | 5.8 | 1.0 |
| Telecommunications | 1.65 | 5.7 | 0.8 |
| Semiconductors | 1.35 | 6.0 | 1.3 |
| Aerospace | 0.68 | 13.2 | 0.3 |
Companies whose patents have above-average CII and SL indicators tend to have significantly higher market-to-book ratios and stock-market returns. However, having a strong intellectual property portfolio does not, of course, guarantee a company’s success. Many additional factors influence the ability of a company to move from quality patents to innovation and financial and market performance. The decade of troubles at IBM, for example, is certainly illustrative of this, since IBM has always had very high quality and highly cited research in its laboratories.
Care needs to be taken when using patent data as an indicator of innovation. The main advantages of patents are as follows:
- Patents represent the output of the inventive process, specifically those inventions that are expected to have an economic benefit.
- Obtaining patent protection is time consuming and expensive. Hence, applications are only likely to be made for those developments that are expected to provide benefits in excess of these costs.
- Patents can be broken down by technical fields, thus providing information on both the rate and direction of innovation.
- Patent statistics are available in large numbers and over very long time series.
The main disadvantages of patents as indicators of innovation are as follows:
- Not all inventions are patented. Firms may choose to protect their discoveries by other means, such as through secrecy. It has been estimated that firms apply for patents for 66–87% of patentable inventions.
- Not all innovations are technically patentable – for example, software development (outside the United States), and some organisms.
- The propensity to patent varies considerably across different sectors and firms. For example, there is a high propensity to patent in the pharmaceutical industry, but a low propensity in fast-moving consumer goods.
- Firms have a different propensity to patent in each national market, according to the attractiveness of markets.
- A large proportion of patents are never exploited, or are applied for simply to block other developments. It has been estimated that between 40% and 60% of all patents issued are used.
There are major intersectoral differences in the relative importance of patenting in achieving its prime objective, namely, to act as a barrier to imitation. For example, patenting is relatively unimportant in automobiles, but critical in pharmaceuticals. Moreover, patents do not yet fully measure technological activities in software since copyright laws are often used as the main means of protection against imitation, outside the United States.
There are also major differences among countries in the procedures and criteria for granting patents. For this reason, comparisons are most reliable when using international patenting or patenting in one country. The US patenting statistics are a particularly rich source of information, given the rigor and fairness of criteria and procedures for granting patents, the strong incentives for firms to get IPR in the world’s largest market. More recently, data from the European Patent Office are also becoming more readily available. Research Note 13.5 reviews the strategic uses of patents.
Case Study 13.5 gives examples of the strategic value of patents including recent acquisitions and battles for IPR and alleged infringements.
Copyright
Copyright is concerned with the expression of ideas, and not the ideas themselves. Therefore, the copyright exists only if the idea is made concrete, for example, in a book or recording. There is no requirement for registration, and the test of originality is low compared to patent law, requiring only that “the author of the work must have used his own skill and effort to create the work”. Like patents, copyright provides limited legal rights for certain types of material for a specific term. For literary, dramatic, musical, and artistic works, copyright is normally for 70 years after the death of the author, 50 in the United States, and for recordings, film, broadcast, and cable programs 50 years from their creation. Typographical works have 25 years copyright. The type of materials covered by copyright include the following:
- Original literary, dramatic, musical, and artistic works, including software and in some cases databases
- Recordings, films, broadcasts, and cable programs
- Typographical arrangement or layout of a published edition
Design Rights
Design rights are similar to copyright protection, but mainly apply to three-dimensional articles, covering any aspect of the “shape” or “configuration,” internal or external, whole or part, but specifically excludes integral and functional features, such as spare parts. Design rights exist for 15 years and 10 years if commercially exploited. Design registration is a cross between patent and copyright protection, is cheaper and easier than patent protection, but more limited in scope. It provides protection for up to 25 years, but covers only visual appearance – shape, configuration, pattern, and ornament. It is used for designs that have aesthetic appeal, for example, consumer electronics and toys. For example, the knobs on top of LEGO bricks are functional and would therefore not qualify for design registration, but were also considered to have “eye appeal,” and therefore granted design rights.
Licensing IPR
Once you have acquired some form of formal legal IPR, you can allow others to use it in some way in return for some payment (a license), or sell the IPR outright (or assign it). Licensing IPR can have a number of benefits:
- Reduce or eliminate production and distribution costs and risks
- Reach a larger market
- Exploit in other applications
- Establish standards
- Gain access to complementary technology
- Block competing developments
- Convert competitor into defender
Considerations when drafting a licensing agreement include degree of exclusivity, territory and type of end use, period of license, and type and level of payments – royalty, lump sum, or cross-license. Pricing a license is as much an art as a science and depends on a number of factors such as the balance of power and negotiating skills. Common methods of pricing licenses are as follows:
- Going market rate – based on industry norms, for example, 6% of sales in electronics and mechanical engineering
- 25% rule – based on licensee’s gross profit earned through use of the technology
- Return on investment – based on licensor’s costs
- Profit sharing – based on relative investment and risk. First, estimate total life-cycle profit. Next, calculate relative investment and weight according to share of risk. Finally, compare results to alternatives, for example, return to licensee, imitation, litigation
There is no “best” licensing strategy, as it depends on the strategy of the organization and the nature of the technology and markets (see Case Studies 13.6 and 13.7). For example, Celltech licensed its asthma treatment to Merck for a single payment of $50 million, based on sales projections. This isolated Celltech from the risk of clinical trials and commercialization and provided a much-needed cash injection. Toshiba, Sony, and Matsushita license DVD technology for royalties of only 1.5% to encourage its adoption as the industry standard. Until the recent legal proceedings, Microsoft applied a “per processor” royalty to its OEM (original equipment manufacturer) customers for Windows to discourage them from using competing operating systems.
The successful exploitation of IPR also incurs costs and risks:
- Cost of search, registration, and renewal
- Need to register in various national markets
- Full and public disclosure of your idea
- Need to be able to enforce
In most countries, the basic registration fee for a patent is relatively modest, but in addition applying for a patent includes the cost of professional agents, such as patent agents, translation for foreign patents, official registration fees in all relevant countries, and renewal fees. Pharmaceutical patents are much more expensive, up to five times more, due to the complexity and length of the documentation. In addition to these costs, firms must consider the competitive risk of public disclosure and the potential cost of legal action should the patent be infringed (see Figure 13.4). Costs vary by country, because of the size and attractiveness of different national markets and also because of differences in government policy. For example, in many Asian countries, the policy is to encourage patenting by domestic firms, so the process is cheaper. Research Note 13.6 reviews the growth of patenting in China and India.
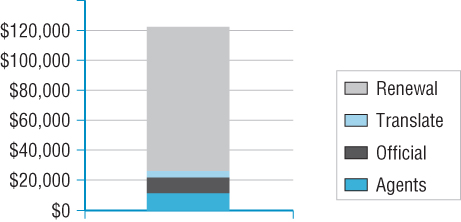
FIGURE 13.4 Typical lifetime cost of a single patent from the European Patent Office.
13.6 Business Models and Value Capture
We discussed the idea of business models in Chapter 9 as a way of capturing the essential elements in a business case for a new venture or innovation proposal. At the heart of any business model is the idea of representing how innovation will create and capture value. The term “business model” is perhaps inappropriate as all organizations, private, public, and social, seek to create and to some extent capture value, broadly defined, so perhaps the term “value model” is more generic. The value model of a venture is simply how value is to be created and captured. The distinction between the creation and capture of value is central, as some ventures are better at one aspect than the other. Moreover, some ventures create value that is captured by other in their network, for example, customers or users of an innovation may benefit more than those that generated it. The idea of a business model is not new, as demonstrated by Case Study 13.8.
Typically, the development of a value model will include consideration of the value proposition, mechanisms for revenue generation, capabilities and processes, and position in the value network or ecosystem (see Figure 13.5) [48]:
- Value proposition – How does the innovation or venture create value and for whom? The value created will be specific to target market segments and customer groups, and different types of innovation will contribute in different ways (see Table 13.4).
- Revenue generation – How does the enterprise capture and appropriate the benefits (or “rents” as economists call them)? In the case of public and social ventures, capture and revenues are less important than demonstrating value, and ensuring that resources, human, and financial are sustainable.
- Capabilities and processes – How can the innovation or venture deliver? This is much more than access to financial and other resources. It requires a (rare) combination of resources, knowledge, and capabilities. A common mistake made by entrepreneurs is to focus too much on the initial creation of value and not to pay sufficient attention to how value will be captured in the longer term.
- Position in the network – How are risks, responsibilities, and rewards distributed? Suppliers, customers, and collaborators will all play a role in the creation and capture of value, but often there are big disparities between shares of value creation and capture. This can be the result of positional advantages, for example, due to size or power, ownership of IP, brands or standards, and access to distribution channels and customers.

FIGURE 13.5 Business model canvas.
TABLE 13.4 Some Examples of Generic Business Models
| Model | Value Proposition |
| Product or service provider | Offers an end product or service |
| Ownership of key assets and renting them out | Rental for temporary period of something valuable like space, e.g., car parks, luggage and goods storage businesses |
| Finance provider | Offers access to money and services around that |
| Systems integrator | Pulls together components on behalf of an end customer, e.g., building contractors, software service providers, computer builders like Dell |
| Platform provider | Offers a platform across which others can add value, e.g., smartphones and the various apps that run across them, and Intel whose chipsets enable others to offer computing functions |
| Network provider | Offers access to various kinds of network service, e.g., mobile phone or broadband company |
| Skills provider | Sells or rents access to human resources and knowledge, e.g., recruitment agencies, professional consultancies, and contract services |
| Outsourcer | Offers to take over responsibility for management and delivery of key activities, e.g., payroll management, IT services, or financial transaction processing |
Table 13.5 illustrates the variation of value-added between and within sector. Value-added is commonly used by economists as a proxy measure for the productivity of organizations. Note that there are large variations in value-added in the same sector and across different sectors (column 2). The same wide range of performance is evident for almost all measures, such as utilization of capital investment (column 3), which measures the relative investment in plant and equipment, and the efficiency of the new product development process (column 4). This wide variation of performance within and across sectors does suggest there is significant scope to create and capture value in most contexts and that the ability to do so is not evenly distributed. Differences in value-added across sectors reflect the market, technological and regulatory conditions, but variances within sector are more indicative of different innovation strategies and management.
TABLE 13.5 Variation in Value Creation within and across Sectors
Source: Derived from Tidd, J., From knowledge management to strategic competence. 2012, Imperial College Press: London, pp. 119–120.
| Sector | Value-Added /Sales(%) |
Capex /Sales Ratio |
R&D Mil /New Products |
| (1) Services | |||
| Company A | 58.9 | 12.8 | na |
| Company B | 50.9 | 9.7 | na |
| Company C | 39.3 | na | na |
| Company D | 11.1 | na | na |
| Company E | 4.1 | na | na |
| (2) Food and Drink | |||
| Company F | 30.1 | 5.2 | 5.9 |
| Company G | 29.4 | 5.7 | 2.4 |
| Company H | 22.6 | 4.5 | 25.6 |
| Company I | 12.1 | 1.5 | 13.4 |
| Company J | 9.9 | 1.7 | na |
| (3) Electronics | |||
| Company K | 61.0 | 2.9 | 4.4 |
| Company L | 47.8 | 2.9 | 3.4 |
| Company M | 39.8 | 3.3 | 2.7 |
| Company N | 35.9 | 4.6 | 6.2 |
| Company O | 28.2 | 10.2 | 1.1 |
| (4) Engineering | |||
| Company P | 48.0 | 4.1 | 4.9 |
| Company Q | 42.3 | 3.2 | 12.8 |
| Company R | 39.7 | 5.4 | 9.3 |
| Company S | 34.1 | 3.6 | 12.0 |
| Company T | 30.8 | 1.5 | 0.8 |
However, value creation is not simply a function of physical assets or manufacturing capabilities. Research Note 13.7 discusses how the integration of products and services can create value, and Case Study 13.9 illustrates how intangible and relational assets can contribute to long-term success.
13.7 Dynamics of Generative Interaction
Getting to a position where TECs, their clients, and other stakeholders, such as contractors and suppliers, can innovate together is a multistage process that can, under certain conditions, generate a positive feedback cycle or generative interaction, producing benefits for both TEC and their clients. During generative interaction, TECs use both external knowledge networks and more conventional internal capability and reputation building. Together these (internal) micro- and (external) mesolevel mechanisms account for the generative development of stocks of expertise that can flow in the project network between TECs and their clients and partners.
Figure 13.6 begins with the proposition that innovation delivers added value for the client’s business. Value for clients is generated in a number of ways, for example, through enhanced prestige (e.g., being associated with striking buildings such as the London’s 30 St. Mary Axe (“the Gherkin”) or the Burj Al Arab hotel (“the Sail”) in Dubai; through improved functionality of assets (e.g., improved acoustics in a concert hall, reduced infection rates in a hospital); and cost savings (e.g., designs with faster build times through the use of prefabricated components such as for railway station platforms and railway embankment renewals); or less disruption (e.g., through the use of tunnel jacking and ground freezing to slide a prefabricated road tunnel under operational railway lines during Boston’s “big dig”) or improved safety during a project (e.g., using movement-monitoring systems to reduce the risk of collapse during underground excavations). Furthermore, when TECs generate client added value, this may produce ongoing benefits for the TEC. Important mechanisms through which this is achieved include an improved ability to win repeat business and boosted reputation.
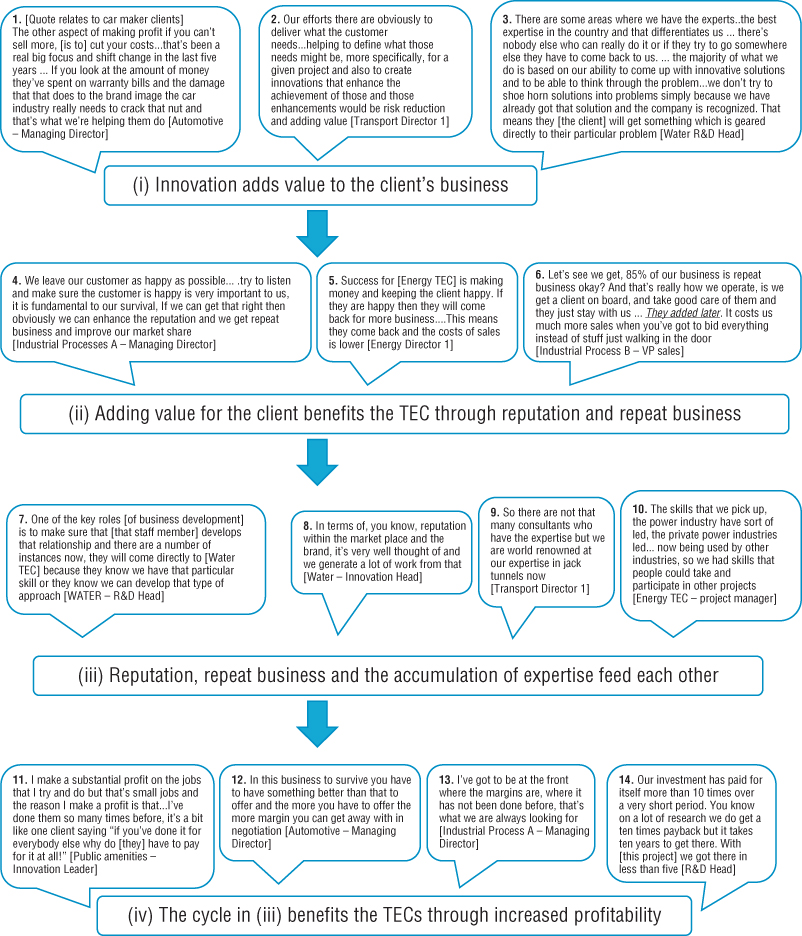
FIGURE 13.6 A chain of mechanisms that support generative interaction.
Source: Derived from Hopkins, M.M., J. Tidd, P. Nightingale, and R. Miller, Generative and degenerative interactions: Positive and negative dynamics of open, user-centric innovation in technology and engineering consultancies, R&D Management, 2011. 41(1), 44–60.
Summary
In this chapter, we have attempted to develop a broad view of innovation and its more fundamental financial, economic, and social benefits. Most accounts of innovation and performance adopt a rather narrow perspective, typically focusing on how firms appropriate the benefits from innovation, usually by means of IPR, standards or first-mover advantages. An exception is the excellent collection of papers in Research Policy, volume 35, 2006, in honor of the seminal paper by David Teece on the subject (see below).
The generation, acquisition, sharing, and exploitation of knowledge are central to successful innovation. However, there is a wide range of different types of knowledge, and each plays a different role. One of the key challenges is to identify and exchange knowledge across different groups and organizations, and a number of mechanisms can help, mostly social in nature, but supported by technology. In limited cases, codified knowledge can form the basis of legal IPR, and these can form a basis for the commercialization of knowledge. However, care needs to be taken when using IPR, as these can divert scarce management and financial resources and can expose organizations to imitation and illegal use of IPR.
- The generation, acquisition, sharing, and exploitation of knowledge are central to successful innovation, but there is a wide range of different types of knowledge, and each plays a different role.
- One of the key challenges is to identify and exchange knowledge across different groups and organizations, and a number of mechanisms can help, mostly social in nature, but supported by technology.
- Tacit knowledge is critical, but is difficult to capture, and draws upon individual expertise and experience. Therefore, where possible, tacit knowledge needs to be made more explicit and codified to allow it to be more readily shared and applied to different contexts.
- Codified knowledge can form the basis of legal IPR, and these can form a basis for the commercialization of knowledge. However, care needs to be taken when using IPR, as these can divert scarce management and financial resources, and can expose organizations to imitation and illegal use of IPR.
Chapter 13: Concept Check Questions
- Which of the following effects of innovation is supported empirically?
- Which of the following is NOT a widely accepted method for sharing knowledge across communities of practice?
- Which of the following is NOT a legal requirement to register a patent?
- Which of the following is a potential benefit of licensing intellectual property to another organization?
- A disadvantage of using patents as an indicator of innovation is:
Further Reading
Knowledge management and intellectual property are both very large and complex subjects. For knowledge management, we would recommend the books by Friso den Hertog, The Knowledge Enterprise (Imperial College Press, 2000), for applications and examples, and for theory Nonaka’s The Knowledge Creating Company (Oxford University Press, 1995). We provide a good combination of theory, research, and practice of knowledge management in From Knowledge Management to Strategic Competence, edited by Joe Tidd (Imperial College Press, 2012, third edition), which examines the links between knowledge, innovation, and performance. More critical accounts of the concept and practice of knowledge management can be found in the editorial by Jackie Swan and Harry Scarbrough, (2001) “Knowledge management: concepts and controversies,” Journal of Management Studies, 38(7), 913–21; J. Storey and E. Barnett (2000) “Knowledge management initiatives: learning from failure,” Journal of Knowledge Management, 4(2), 145–56; and C. Pritchard, R. Hull, M. Chumer, and H. Willmott, Managing Knowledge: Critical Investigations of Work and Learning (Macmillan, 2000). Harry Scarbrough also edits The Evolution of Business Knowledge (Oxford University Press, 2008), which reports the findings of the UK national research program on the relationships between business and knowledge (including one of our research projects).
For a comprehensive technical legal overview of intellectual property, see David Bainbridge’s Intellectual Property, (Pearson, 2012, ninth edition), or for a much more concise summary, try John Palfrey’s Intellectual Property Strategy (MIT Press, 2011). For understanding the role and limitations of intellectual property, we would like to refer the theoretical approach adopted by David Teece, for example, in his book The Transfer and Licensing of Know-how and Intellectual Property (World Scientific, 2006), or for a more applied treatment of the topic see Licensing Best Practices: Strategic, Territorial and Technology Issues, edited by Robert Goldscheider and Alan Gordon (John Wiley & Sons, 2006), which includes practical case studies of licensing from many different countries and sectors. Joe Tidd has edited a recent review of research on intellectual property and innovation, Exploiting Intellectual Property to Promote Innovation and Create Value (Imperial College Press, 2018).
Business model innovation, how value is created and captured, is discussed in Strategic Market Creation: A New Perspective on Marketing and Innovation Management, a review of research at Copenhagen Business School and Bocconi University, edited by Karin Tollin and Antonella Carù (Wiley, 2008). Allan Afuah’s Business Model Innovation: Concepts, Analysis, and Cases (Routledge, 2014) provides a good overview with examples. There have been many journal special issues on the topic, including Patrick Spieth, Joe Tidd, Kurt Matzler, Dirk Schneckenberg, and Wim Vanhaverbeke edited a special issue on Business Model Innovation, in the International Journal of Innovation Management, 17(1), 2013; Long Range Planning on innovative business models, volume 43(2 & 3), 2011; a compilation of articles republished in the Harvard Business Review on Business Model Innovation (2012), and most recently R&D Management, 46(3), 2016.
Case Studies
You can find these additional case studies on the companion website:
- The case of Pixar animation studio demonstrates how knowledge and creativity are harnessed in a business that is built on individual creativity, knowledge sharing, and intellectual property.
- This case of Torotrak explores a business founded on breakthrough technology but still trying to secure a strong competitive position through the careful deployment of that knowledge.
- FringeSport provides value for CrossFit and home gym enthusiasts by supplying fitness equipment and customer support and service, relying on a network of enthusiasts.
References
- 1. Arrow, K., Economic welfare and the allocation of resources for invention. In Nelson, R., ed. The rate and direction of inventive activity. 1962, Princeton University Press: Princeton, NJ.
- 2. Teece, D., Profiting from technological innovation: Implications for integration, collaboration, licensing and public policy. Research Policy, 1986. 13, 343–73.
- 3. Dosi, G., L. Marengo, and C. Pasquali, How much should society fuel the greed of innovators? On the relations between appropriability, opportunities and rates of innovation. Research Policy, 2006. 35, 1110–21.
- 4. Ugur, M., E. Trushin, E. Solomon, and F. Guidi, R&D and productivity in OECD firms and industries: A hierarchical meta-regression analysis. Research Policy, 2016; Pianta, M. and A. Vaona, Innovation and productivity in European industries. Economics of Innovation and New Technology, 2007. 16(7): p. 485–99.
- 5. Mansury, M.A. and J.H. Love, Innovation, productivity and growth in US business services: a firm-level analysis. Technovation, 2008. 28, 52–62.
- 6. Laursen, K. and A.J. Salter, The paradox of openness: Appropriability, external search and collaboration, Research Policy, 2014. 43(5), 867–78; Hurmelinna, P., K. Kylaheiko, and T. Jauhiainen, The Janus face of the appropriability regime in the protection of innovations: theoretical re-appraisal and empirical analysis. Technovation, 2007. 27, 133–44.
- 7. Jacobides, M.G., T. Knudsen, and M. Augier, Benefiting from innovation: value creation, value appropriation and the role of industry architectures. Research Policy, 2006. 35, 1200–21.
- 8. Denicolai, S., M. Ramirez, and J. Tidd, Creating and capturing value from external knowledge: The moderating role of knowledge-intensity. R&D Management, 2014. 44(3), 248–64; Hurmelinna-Laukkanen, P. and K. Puumalainen, Nature and dynamics of appropriability: strategies for appropriating returns on innovation. R&D Management, 2007. 37(2), 95–110.
- 9. Tidd, J., From knowledge management to strategic competence, 3rd ed. 2012, Imperial College Press: London; Tidd, J., C. Driver, and P. Saunders, Linking technological, market and financial indicators of innovation. Economics of Innovation and New Technology, 1996. 4, 155–72.
- 10. Griliches, Z. and A. Pakes, Patents R&D and Productivity. 1984, University of Chicago Press: Chicago, IL; Stoneman, P., The economic analysis of technological change. 1983, Oxford University Press: Oxford.
- 11. Geroski, P., Innovation and the sectoral sources of UK productivity growth. Economic Journal, 1991. 101, 1438–51.
- 12. Geroski, P., Market structure, corporate performance and innovative activity. 1994. Oxford University Press: Oxford.
- 13. Pavitt, K., Uses and abuses of patent statistics. In Van Raen, A.F.J., ed., Handbook of quantitative studies of science and technology. 1988, North Holland: Amsterdam; Silberston, A., Technology and economic progress. 1989. Macmillan: London.
- 14. Levin, R., W. Cohen, and D. Mowery, R&D, appropriability, opportunity, and market structure: new evidence on the Schumpeterian hypothesis. American Economic Review, 1985. 75, 20–4; Levin, R.C., A. Klevorick, R. Nelson, and S. Winter, Appropriating the returns from industrial research and development. Brookings Papers on Economic Activity, 1987. 3, 783–831.
- 15. Pavitt, K. and P. Patel, The international distribution and determinants of technological activities. Oxford Review of Economic Policy, 1988. 4(4).
- 16. Hay, D.A. and D.J. Morris, Industrial economics and organisation. 1991. Oxford University Press: Oxford.
- 17. Cohen, W. and R. Levin, Empirical studies of innovation and market structure. In R. Schmalensee and R. Willig, eds, The handbook of industrial organisation, volume 1, 1989. North Holland: Amsterdam.
- 18. Jensen, E., Research expenditures and the discovery of new drugs. Journal of Industrial Economics, 1987. XXXVI(1), 83–96.
- 19. Blundell, R., R. Griffith, and S. Van Reenen, Knowledge stocks, persistent innovation and market dominance. Paper given to SPES Discussion Group, Brussels, 1993 September.
- 20. Freeman, C., The economics of industrial innovation. 1982. Pinter: London.
- 21. Mansfield, E., Patents and innovation: An empirical study. Management Science, 1986. 32, 173–81; Griliches, Z., B.H. Hall, and A. Pakes, R&D, patents and market value revisited. Economics of Innovation and New Technology Journal, 1991. 1(3), 183–202.
- 22. Jaffe, A.B., Technological opportunity and spillovers of R&D: evidence from firms’ patents, profits and market values. American Economic Review, 1986. 76, 948–99.
- 23. Tidd, J. and M. Trewhella, Organisational and technological antecedents for knowledge acquisition and learning. R&D Management, 1997. 27(4), 359–75.
- 24. Mansfield, E., Managerial economics: Theory, application and cases, 6th ed. 1990, W.W. Norton.
- 25. Devinney, T.M., How well do patents measure new product activity? Economics Letters, 1993. 41, 447–50.
- 26. Acs, Z. and D.B. Audretsch, Innovation and small firms. 1990, MIT Press: Cambridge, MA; Innovation in large and small firms: An empirical analysis. American Economic Review, 1988. 78, 678–90.
- 27. Chaney, R., T. Devinney, and R. Winer, The impact of new product introductions on the market value of firms. Journal of Business, 1992. 64(4), 573–610.
- 28. Walker, W.B., Industrial innovation and international trading performance. 1979, JAI Press: New York.
- 29. Budworth, D.W., Intangible assets and their renewal. Foundation for Performance Measurement, 1993 October. UK National Meeting, London .
- 30. Scherer, F., Firm size, market structure, opportunity and the output of patented inventions. American Economic Review, 1965. 55, 1097–125; The propensity to patent. International Journal of Industrial Organisation, 1983. 50(1), 107–28.
- 31. Pakes, A., On patents, R&D and the stock market rate of return. Journal of Political Economy, 1985. 93, 390–409; Hall, R. A framework linking intangible resources and capabilities to sustainable competitive advantage. Strategic Management Journal, 1993. 14, 607–18.
- 32. Griliches, Z., B.H. Hall, and A. Pakes, R&D, patents and market value revisited. Economics of Innovation and New Technology Journal, 1991. 1(3), 183–202.
- 33. Buzell, R.D. and B. Gale, The PIMS principle. 1987, Free Press: New York.
- 34. Blackler, F., Knowledge, knowledge work and organizations: An overview and interpretation. Organization Studies, 1995. 16(60), 1021–46.
- 35. Bessant, J., High-involvement innovation. 2003, John Wiley & Sons: Chichester.
- 36. Simon, H.A., Bounded rationality and organizational learning. In Cohen, M.D. and L.S. Sproull, eds, Organizational learning (pp. 175–87). 1996, Sage: London.
- 37. Nonaka, I. and H. Takeuchi, The knowledge creating company. 1995, Oxford University Press: Oxford.
- 38. Boisot, M. and D. Griffiths, Are there any competencies out there? Identifying and using technical competencies. In Tidd, J., ed., From knowledge management to strategic competence, 2nd ed. (pp. 249–307). 2006, Imperial College Press: London.
- 39. Crespi, G., C. Criscuolo, and J. Haskel, Information technology, organisational change and productivity growth: evidence from UK firms. The Future of Science, Technology and Innovation Policy: Linking Research and Practice, 2006 September, SPRU 40th Anniversary Conference, Brighton, UK.
- 40. Hall, R., What are strategic competencies? In Tidd, J., ed., From knowledge management to strategic competence, 3rd ed. 2012, Imperial College Press: London.
- 41. O’Leary, D., Knowledge management systems: Converting and connecting. IEEE Intelligent Systems, 1998. 13(3), 30–3; Becker, M., Managing dispersed knowledge: organizational problems, managerial strategies and their effectiveness. Journal of Management Studies, 2001. 38(7), 1037–51.
- 42. Brown, J.S. and P. Duguid, Knowledge and organization: A social practice perspective. Organization Science, 2001. 12(2), 198–213; Organizational learning and communities of practice: Towards a unified view of working, learning and organization. Organizational Science, 1991. 2(1), 40–57; Hildreth, P., C. Kimble, and P. Wright, Communities of practice in the distributed international environment. Journal of Knowledge Management, 2000. 4(1), 27–38.
- 43. Star, S.L. and J.R. Griesemer, Institutional ecology, translations and boundary objects. Social Studies of Science, 1989. 19, 387–420; Carlile, P.R. A pragmatic view of knowledge and boundaries: boundary objects in new product development. Organization Science, 2002. 13(4), 442–55.
- 44. Granovetter, M., The strength of weak ties. American Journal of Sociology, 1976. 1360–80; Cummings, J.N., Work groups, structural diversity, and knowledge sharing in a global organization. Management Science, 2004. 50(3), 352–64.
- 45. den Hertog, J.F. and E. Huizenga, The knowledge enterprise. 2000, Imperial College Press: London.
- 46. Tranfield, D., et al., Knowledge management routines for innovation projects: Developing a hierarchical process model. In Tidd, J., ed., From knowledge management to strategic competence, 3rd ed. 2012, Imperial College Press: London; Coombs, R. and R. Hull, Knowledge management practices and path-dependency in innovation. Research Policy, 1998. 237–53.
- 47. Narin, F., Assessing technological competencies. In Tidd, J., ed., From knowledge management to strategic competence, 3rd ed. 2012, Imperial College Press: London.
- 48. Schneider, S. and P. Spieth, Business model innovation: Towards an integrated future research agenda. International Journal of Innovation Management, 2013. 17(1), 1340001; Baden-Fuller, C. and S. Haefliger, Business models and technological innovation. Long Range Planning, 2013. 46, 419–26; Zott, C., R. Amit, and L. Massa, The business model: Recent developments and future research. Journal of Management, 2011. 37, 1019–42; Johnson, M.J., C.M. Christensen, and H. Kagermann, Reinventing your business model. Harvard Business Review, 2008 December. 86(12), 51–59; Chesbrough, H., Business model innovation: It’s not just about technology. Strategy & Leadership, 2007. 35(6): p. 12–17; Giesen, E., S.J. Berman, R. Bell, and A. Blitz, Three ways to successfully innovate your business model. Strategy & Leadership, 2007. 35(6), 27–33.