
First, we need to install gdb by running the following command:
sudo apt install gdb
The installation should look something like this:

Then, use gdb to debug the hello program, as follows:
gdb ./hello
gdb can be controlled using commands. The commands are fully listed in online documentation, but simply entering help can aid us with the basics.
You can also use gdb to show the disassembly of specified functions, using the disass command. For example, let's see what happens if we use the disass main command:

Then, again we have been given the disassembly in AT&T sytnax. To set gdb to use Intel syntax, use the following command:
set disassembly-flavor intel
This should give us the Intel assembly language syntax, as follows:

To place a breakpoint at the main function, the command would be b *main.
After placing a breakpoint, we can run the program using the run command. We should end up at the address of the main function:
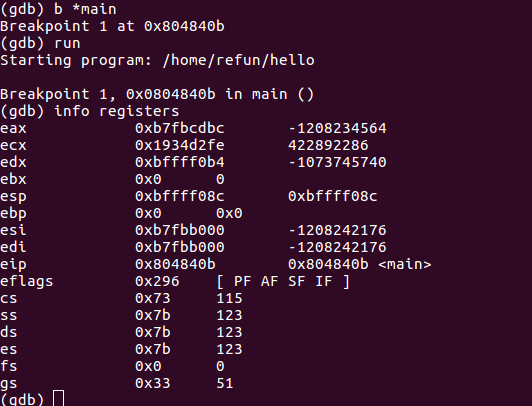
To get the current values of the registers, enter info registers. Since we are in a 32-bit environment, the extended registers (that is, EAX, ECX, EDX, EBX, and EIP) are used. A 64-bit environment would show the registers with the R-prefix (that is, RAX, RCX, RDX, RBX, and RIP).
Now that we are at the main function, we can run each instruction with step into (the stepi command) and step over (the nexti command). Usually, we follow this with the info registers command to see what values changed.
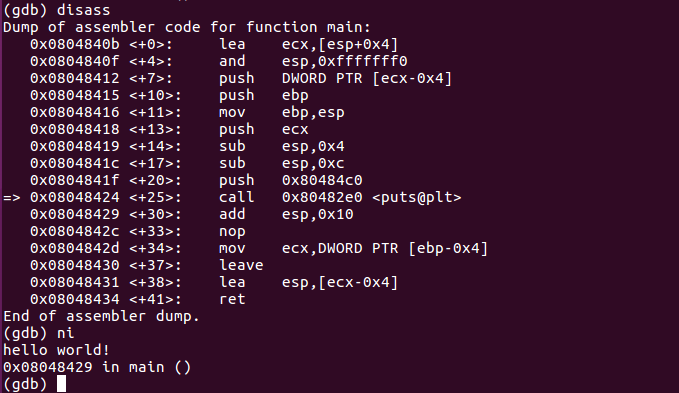
Keep on entering si and disass main until you reach the line containing call 0x80482e0 <puts@plt>. You should end up with these disass and info registers result:

The => found at the left side indicates where the instruction pointer is located. The registers should look similar to this:

Before the puts function gets called, we can inspect what values were pushed into the stack. We can view that with x/8x $esp:

The x command is used to show a memory dump of the specified address. The syntax is x/FMT ADDRESS. FMT has 3 parts: the repeat count, the format letter, and the size letter. You should be able to see more information about the x command with help x. x/8x $esp shows 8 DWORD hexadecimal values from the address pointed by the esp register. Since the address space is in 32 bits, the default size letter was shown in DWORD size.
puts expects a single parameter. Thus, we are only interested in the first value pushed at the 0x080484c0 stack location. We expect that the parameter should be an address to where the message should be. So, entering the x/s command should give us the contents of the message, as follows:
![]()
Next, we need to do a step over (ni) the call instruction line. This should display the following message:
But if you used si, the instruction pointer will be in the puts wrapper code. We can still go back to where we left off using the until command, abbreviated as u. Simply using the until command steps in one instruction. You'll have to indicate the address location where it will stop. It is like a temporary breakpoint. Remember to place an asterisk before the address:

The remaining 6 lines of code restore the values of ebp and esp right after entering the main function, then returning with ret. Remember that a call instruction would store the return address at the top of the stack, before actually jumping to the function address. The ret instruction will read the return value pointed to by the esp register.
The values of esp and ebp, right after entering the main function, should be restored before the ret instruction. Generally, a function begins by setting up its own stack frame for use with the function's local variables.
Here's a table showing the changes in the values of the esp, ebp, and ecx registers after the instruction at the given address.
| Address | Instruction | esp | ebp | ecx | Remarks |
| 0x0804840b | lea ecx,[esp+0x04] | 0xbffff08c | 0 | 0xbffff090 |
Initial values after entering main. [0xbffff08c] = 0xb7e21637 This is the return address. |
| 0x0804840f | and esp,0xfffffff0 | 0xbffff080 | 0 | 0xbffff090 | Aligns the stack in 16-byte paragraphs. In effect, this subtracts 0xc from esp. |
| 0x08048412 | push DWORD PTR [ecx-0x4] | 0xbffff07c | 0 | 0xbffff090 |
[0xbffff07c] = 0xb7e21637 ecx - 4 = 0xbffff08c points to the return address. The return address is now placed in two stack addresses. |
| 0x08048415 | push ebp | 0xbffff078 | 0 | 0xbffff090 |
Begins stack frame setup. [0xbffff078] = 0 |
| 0x08048416 | mov ebp,esp | 0xbffff078 | 0xbffff078 | 0xbffff090 | Saves esp. |
| 0x08048418 | push ecx | 0xbffff074 | 0xbffff078 | 0xbffff090 |
Saves ecx. [0xbffff074] = 0xbffff090 |
| 0x08048419 | sub esp,0x4 | 0xbffff070 | 0xbffff078 | 0xbffff090 | Allocates 4 bytes for stack frame. |
| 0x0804841c | sub esp,0xc | 0xbffff064 | 0xbffff078 | 0xbffff090 | Allocates another 12 bytes for stack frame. |
| 0x0804841f | push 0x80484c0 | 0xbffff060 | 0xbffff078 | 0xbffff090 |
[0xbffff060] = 0x080484c0 [0x080484c0] = "hello world!" |
| 0x08048424 | call 0x80482e0 <puts@plt> | 0xbffff060 | 0xbffff078 | 0xffffffff | Stack is still the same after the call. |
| 0x08048429 | add esp,0x10 | 0xbffff070 | 0xbffff078 | 0xffffffff | Adds 0x10 to esp reducing the stack frame. |
| 0x0804842c | nop | 0xbffff070 | 0xbffff078 | 0xffffffff | No operation |
| 0x0804842d | mov ecx,DWORD PTR [ebp-0x4] | 0xbffff070 | 0xbffff078 | 0xbffff090 | Restores the value of ecx before call. |
| 0x08048430 | leave | 0xbffff07c | 0 | 0xbffff090 |
leave is the equivalent of |
| 0x08048431 | lea esp,[ecx-0x4] | 0xbffff08c | 0 | 0xbffff090 |
ecx - 4 = 0xbffff08c [0xbffff08c] = 0xb7e21637 The address of esp is restored back. |
| 0x08048434 | ret | - | - | - |
Returns to 0xb7e21637 |
You can either continue exploring the cleanup code after ret, or just make the program eventually end by using continue or its abbreviation, c, as follows:
