
This time, we'll work on a program that receives a network connection and sends back some data. We will be using the file available at https://github.com/PacktPublishing/Mastering-Reverse-Engineering/raw/master/ch6/server. Once you have it downloaded, execute it from the Terminal as follows:
![]()
The program is a server program that waits for connections to port 9999. To test this out, open a browser, then use the IP address of the machine where the server is running, plus the port. For example, use 127.0.0.1:9999 if you're trying this from your own machine. You might see something like the following output:

To understand network traffic, we need to capture some network packets by using tools such as tcpdump. tcpdump is usually pre-installed in Linux distributions. Open another Terminal and use the following command:
sudo tcpdump -i lo 'port 9999' -w captured.pcap
Here's a brief explanation of the parameters used:
-i lo uses the loopback network interface. We have used it here since we plan on accessing the server locally.
'port 9999', with the single quotes, filters only packets that are using port 9999.
-w captured.pcap writes data packets to a PCAP file named captured.pcap.
Once tcpdump listens for data, try connecting to the server by visiting 127.0.0.1:9999 from the browser. If you wish to connect from outside the machine which holds the server, then re-run tcpdump without the -i lo parameter. This uses the default network interface instead. And instead of visiting using 127.0.0.1, you'll have to use the IP address used by the default network interface.
To stop tcpdump, just break it using Ctrl + C.
To view the contents of captured.pcap in human readable form, use the following command:
sudo tcpdump -X -r captured.pcap > captured.log
This command should redirect the the tcpdump output to captured.log. The -X parameter shows the packet data in hexadecimal and ASCII. -r captured.pcap means read from the PCAP file captured.pcap. Opening the captured.log file should look something like the following:

Before we proceed, let's examine some basics on the two most popular network protocols, Transmission Control Protocol (TCP) and User Datagram Protocol (UDP). TCP is a network transmission in which a communication between a sender and a receiver is established. The communication begins with a 3-way handshake, where the sender sends a SYN flag to the receiver, then the receiver sends back SYN and ACK flags to the sender, and finally, the sender sends an ACK flag to the receiver, opening the start of a communication. Further exchange of data between the sender and receiver are done in segments. Every segment has a 20-byte TCP header that contains the IP address of the sender and the receiver and any current status flags. This is followed by the size of the data being transmitted and the data itself. UDP uses a shorter header, since it only sends data and doesn't require acknowledgement from the receiver. It is not required, via UDP, to do a 3-way handshake. The primary purpose of UDP is to keep sending data to the receiver. TCP seems to be more reliable in terms of exchanging data, however. For UDP, sending data is much faster, as there are no overheads required. UDP is commonly used to transmit huge amounts of data via file transmission protocols, while TCP is used to communicate data that requires integrity.
In the preceding screenshot, lines 1 to 15 show a TCP 3-way handshake. The first connection from the localhost port at 55704 (client) to the localhost port at 9999 (server) is a SYN, denoted in the flags as S. This was responded to by an S. flag, which means SYN and ACK. The last is an ACK denoted by . in the flags. The client port at 55704 is an ephemeral port. An ephemeral port is a system generated port for client connections. The server port at 9999 is fixed in the server program.
In lines 16 to 23, we can see the actual response data from the server to the client. The server sends back a data containing a 55 character data containing the string "You have connected to the Genie. Nothing to see here." and 2 new line (0x0A) characters to the client. The data before the 55 character string is the packet's header containing information about the packet. The packet header, when parsed, is the information described in line 16. The TCP flags are P., which means PUSH and ACK. The information in the packet header structure is documented in the TCP and UDP specifications. You can start to look for these specifications at RFC 675, available at https://tools.ietf.org/html/rfc675, and RFC 768, available at https://tools.ietf.org/html/rfc768. To fast-track the process, we can use Wireshark, which will be discussed later, to help us parse through the packet information.
In lines 24 to 28, FIN and ACK flags, formatted as F., are sent from the server to the client, saying that the server is closing the connection. Lines 29 to 33 is an ACK response, ., that acknowledges the connection is being closed.
A better tool for capturing and viewing this graphically is Wireshark. Previously known as Ethereal, Wireshark has the same capabilities as tcpdump. Wireshark can be manually downloaded and installed from https://www.wireshark.org/. It can also be installed using the following apt command:
sudo apt install wireshark-qt
Capturing network packets requires root privileges in order to access the network interfaces. This is the reason for our use of sudo when running tcpdump. The same goes when using Wireshark. So, to execute Wireshark in Linux, we use the following command:
sudo wireshark
Besides capturing traffic and showing it in real time, you can also open and view PCAP files in Wireshark:

To start capturing, double-click on any from the list of interfaces. This essentially captures from both the default network interface and the loopback interface lo. What you'll see are continuous lines of network traffic packets. Wireshark has a display filter to minimize all the noise we see. For our exercise, in the filter field, enter the following display filter:
tcp.port == 9999
This should only show packets that use the TCP port at 9999. There are more filters you can experiment on. These are documented in Wireshark's manual pages.
Clicking on a packet shows parsed information that gives you a better understanding of the packet fields, as shown in the following screenshot:
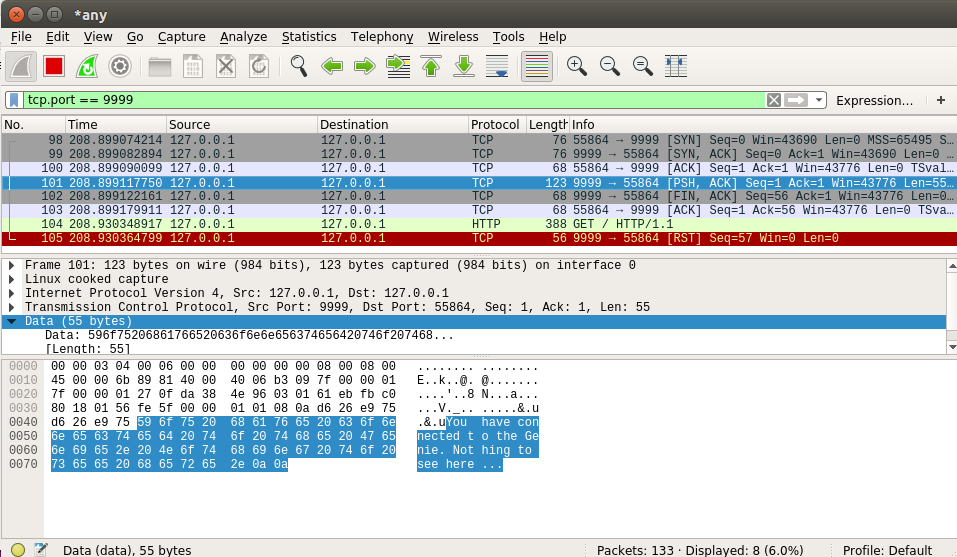
Wireshark has a wide-knowledge of standard packets. This makes Wireshark a must-have tool for every analyst.