
After opening up whatami.exe in IDA Pro, auto-analysis recognizes the WinMain function. In the following screenshot, we can see that the first three APIs that will be executed are LoadStringW, RegisterClassExW, and CreateWindowEx:

When CreateWindowExW is executed, the window properties are taken from the configuration set by RegisterClassExW. The ClassName, which is used as the name of the window, is taken from the file's text string resource using LoadStringW. However, our concern here would only be the code pointed to by lpfnWindProc takes us. When CreateWindowExW is executed, the code pointed to by the lpfnWndProc parameter is executed.
Before we proceed, take a look at sub_4010C0. Let's see the code that comes after CreateWindowExW:
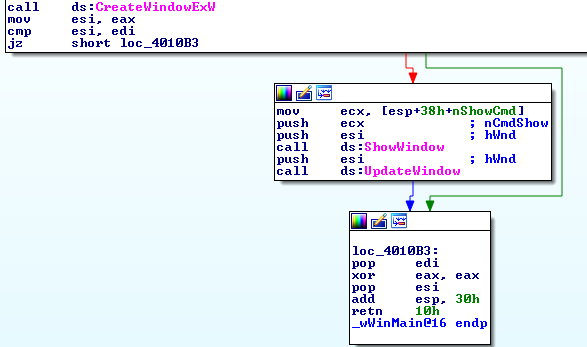
The preceding screenshot shows that after CreateWindowExW, ShowWindow and UpdateWindow are the only APIs that may be executed. However, there are indeed no window messaging APIs that were expected to process window activities. This would entail us assuming that the intention of the program was only to run code at the address pointed to by the lpfnWndProc parameter.
Double clicking on dword_4010C0, which is the address of lpfnWndProc, will show a set of bytes that have not been properly analyzed by IDA Pro. Since we are sure that this area should be a code, we will have to tell IDA Pro that it is a code. By pressing 'c' at address 0x004010C0, IDA Pro will start converting the bytes to readable assembly language code. Select Yes when IDA Pro asks us to convert to code:

Scrolling down, we will encounter another unrecognized code at 0x004011a0. Just perform the same procedure:

Scrolling down again will bring us to data that can no longer be converted. This should be the last part of the code. Let's tell IDA Pro that this code should be a treated as a function. To do that, highlight lines from 0x004010C0 to 0x004011C0, right-click on the highlighted lines, and then select "Create function..." to turn the set of code into a function.

Turning the code into a function will help our deadlisting see a graphical view of the code. To do that, right-click and select Graph view. The following screenshot shows the first set of code of the function. What interests us here is how the rdtsc and cpuid instructions were used:

In Chapter 11, Identification with POC Malware, under anti-debugging tricks, we discussed rdtsc being used as a timing trick. The difference is calculated right after the second rdtsc. In the following code, the expected duration should only be less than or equal to 0x10000, or 65,536 cycles. If we get to pass that timing trick, a message box will appear.
Leaf 1 (set in the register eax) is passed to the first execution of a cpuid instruction. Again, in Chapter 11, cpuid can be used for anti-VM tricks. The result is placed in register eax. This is followed by three xor instructions that eventually exchange the values of the eax and ecx registers.
xor ecx, eax
xor eax, ecx
xor ecx, eax
The bt instruction moves the 31st (0x1F) bit to the carry flag. If the 31st bit is set, it means that we are running in a hypervisor environment. We will need to take note of this line during our debugging session later. We want to make the result with the 31st bit set to 0.
This may be followed by another check on the 5th bit using xor ecx, 20h. With the 5th bit set, it would mean that VMX (Virtual Machine eXtensions) instructions are available. If the VMX instructions are available, it would also mean that the system is capable of running virtualization. Usually, VMX is only available at the host VM, and the program can assume that it is running on the physical machine. For bitwise logic, if the 5th bit of ecx is set, an xor 20h should make it a zero. But if the other bits of register ecx were set, register ecx would not have a zero value. We should also take note on this for our debug session.
Two main tricks were shown here – a timing-trick and an anti-VM trick. Overall, if we deduce what we analyzed, the program can either go in two directions: the loop at loc_4010EF, which makes no sense, and the MessageBoxA code.
If we take a closer look, the whole anti-debug and anti-VM tricks are enclosed by pusha and popa instructions. Essentially, we can skip the whole trick codes and jump right to the MessageBoxA code, as can be seen in the following screenshot:

The MessageBoxA code is followed by functions that read an RCDATA (0x0A) resource type with an ordinal name of 0x88 (136). Using CFF Explorer, click on Resource Editor and expand RCData. We should be able to see the data being read here, as shown in the following screenshot:

The data is copied, using memcpy, to a memory space allocated using VirtualAlloc. The allocated size is the size indicated in the RCData's properties. The size can be seen by expanding RCData in the Resource Directory in CFF Explorer. The address of the copied data is left to theedi register.
We also see IsDebuggerPresent being used here, another anti-debugging trick. Following the green line ends up to an ExitProcess.
The following screenshot is where the red line goes to:

The loop at loc_4011A0 seems to be decrypting the data. Remember that the address of the data is in register edi. The decryption algorithm uses a ror 0x0c (rotate 12 bits to the right). After decryption, it stores the data address to register eax and then calls the sub_4011D0 function.
Knowing the location and size of the decrypted data, we should be able to create a memory dump during our debug session.
Inside sub_4011DO, the address stored in eax is transferred to the esi register, and subsequently to register edi. We then encounter a call to CreateProcessA that runs "calc":

The process named "calc" is actually the Windows default calculator application. The sixth parameter of CreateProcessA, dwCreationFlags, is what interests us here. The value of 4 denotes CREATE_SUSPENDED. The calculator was run as a process in suspended mode. This means that it is not running and was only loaded in the calculator's own process space.
If we were to make a block diagram of sub_4011D0 with the sequence of API functions, we would have something like this.

The sequence of APIs demonstrates a behavior called process hollowing. Process hollowing is a technique, commonly used by malware, to mask its code under a legitimate process. This technique creates a process in a suspended state, and then its memory is unmapped and replaced with a different process image. In this case, the legitimate process is Calculator.
The NtUnmapViewOfSection API is a function that unmaps or removes the PE image layout from a given process space. This API comes from the NTDLL.DLL library file. Instead of using LoadLibrary, the GetModuleHandle was used. LoadLibrary is used to load a library that has not yet been loaded, while GetModuleHandle is used to retrieve the handle of an already loaded library. In this case, the program assumed that NTDLL.DLL was already loaded.
The following screenshot shows the disassembly code that retrieves the function address of NtUnmapViewOfSection:

The decrypted data from the resource section's RCData is passed to sub_4011D0. Every call to WriteProcessMemory reads chunks of data from the decrypted data. Given this, we are expecting the decrypted data to be that of a Win32 PE file.
To summarize, the code initially creates a window. However, the registered window properties are almost empty, except for the callback, Wndproc. The Wndproc callback is the code that initially executes when the window is created. As a result, the creation of a window using RegisterClassEx and CreateWindow APIs were just used to pass code execution. In other words, the whole window creation was the simple equivalent of a jmp instruction.
Here's another diagram outlining the flow of code at the Wndproc callback:
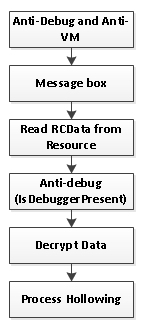
In the first section of the Wndproc code, we encountered anti-debug (timing tricks with rdtsc) and anti-vm (cpuid bit 31 and 5) tricks. Once we get passed that, a message box appears. The data from the resource's RCData is copied to an allocated memory. We encounter another anti-debugging trick using the IsDebuggerPresent API. The data is decrypted and passed to a process-hollowing code using Calculator.
Our next target for analysis would be the decrypted image executed using process hollowing. We will start directly with debugging.